
| Skip to content |
|
|
|
Freight Mobility Trends and Highway Bottlenecks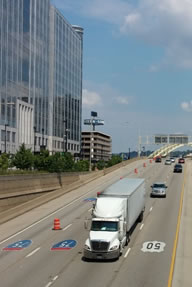
Source: FHWA The Federal Highway Administration’s (FHWA) Office of Operations has created a Freight Mobility Trends Analysis Tool to present national freight statistics and identify freight highway bottlenecks on the Interstate System, National Highway System (NHS), National Highway Freight Network (NHFN), and Strategic Highway Network (STRAHNET). This page provides information on Freight Mobility Trends. Freight Mobility Trends ReportThe Freight Mobility Trends Report provides high-level, national trends in freight mobility and assesses freight movement over a range of locations based on truck travel data:
The Freight Mobility Trends Report uses vehicle probe-based travel time data from FHWA's National Performance Management Research Data Set (NPMRDS). The report is produced annually and compares data from the most recent year to the previous year. 2019 Freight Mobility Trends Report Freight Mobility Trends ToolThe FHWA Freight Mobility Trends Analysis Tool is an interactive dashboard that presents National freight statistics and identifies freight highway bottlenecks on the Interstate System, NHS, NHFN, and STRAHNET. This program uses a Freight Mobility Trends dashboard with indicators to assess freight movement based on truck travel data. The three dashboards are as follows:
General instructions are available at: Freight Mobility Trends instructions. Freight Highway BottlenecksThe Freight Mobility Trends Analysis Tool was used to identify major freight highway bottlenecks and congested corridors based on annual truck-hours of delay per mile. Delay per mile is calculated for each Interstate segment using the NPMRDS travel time data. The delay per mile measure compares performance over the entire Interstate System and across all States for corridors of different lengths. The following Freight Highway Bottleneck Reports list the top 100 Interstate bottlenecks and congested corridors in the United States. FHWA conducts this analysis on an annual basis to update the list, track trends, and gain insight into successful transportation management techniques to address congestion at major bottlenecks. 2021 National List of Major Freight Highway Bottlenecks and Congested Corridors (HTML, PDF 939KB) 2020 National List of Major Freight Highway Bottlenecks and Congested Corridors (HTML, PDF 1.2MB) 2019 National List of Major Freight Highway Bottlenecks and Congested Corridors (HTML, PDF 656KB) 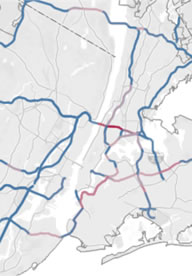
Source: FHWA 2018 National List of Major Freight Highway Bottlenecks and Congested Corridors (HTML, PDF 510KB) This analysis uses delay per mile to assess bottlenecks over the entire Interstate System. Individual State Departments of Transportation (DOTs) and MPOs use a variety of bottleneck identification methods based upon their local traffic characteristics, infrastructure constraints, and impediments to efficient freight movement. These methods include congestion, delay, reliability, and truck-specific infrastructure restrictions. FHWA recommends reviewing individual State Freight Plans for State-specific bottleneck analysis. Staff ContactsJaesup Lee |
||
|
United States Department of Transportation - Federal Highway Administration |
||