
| Skip to content |
|
|
|
2021 National List of Major Freight Highway Bottlenecks and Congested Corridors
|
|||||||||||||||||||||||||||||||||||||||||||||||||||||||||||||||||||||||||||||||||||||||||||||||||||||||||||||||||||||||||||||||||||||||||||||||||||||||||||||||||||||||||||||||||||||||||||||||||||||||||||||||||||||||||||||||||||||||||||||||||||||||||||||||||||||||||||||||||||||||||||||||||||||||||||||||||||||||||||||||||||||||||||||||||||||||||||||||||||||||||||||||||||||||||||||||||||||||||||||||||||||||||||||||||||||||||||||||||||||||||||||||||||||||||||||||||||||||||||||||||||||||||||||||||||||||||||||||||||||||||||||||||||||||||||||||||||||||||||||||||||||||||||||||||||||||||||||||||||||||||||||||||||||||||||||||||||||||||||||||||||||||||||||||||||||||||||||||||||||||||||||||||||||||||||||||||||||||||||||||||||||||||||||||||||||||||||||||||||||||||||||||||||||||||||||||||||||||||||||||||||||||||||||||||||||||||||||||||||||||||||||||||||||||||||||||||||||||||||||||||||||||||||||||||||||||||||||||||||||||||||||||||||||||||||||||||||||||||||||||||||||||||||||||||||||||||||||||||||||||
| 2021 Rank |
2020 Rank |
Road |
Urban Area, State |
Limits of Congested Corridor |
Corridor Length (Miles) |
AADTT (Trucks) |
Delay (Hours) |
Delay/ Mile |
Change From 2020 |
Change From 2019 |
PTI |
BI |
TTI |
TRI |
Total Congestion Cost of Full Corridor ($/year) |
|---|---|---|---|---|---|---|---|---|---|---|---|---|---|---|---|
1 |
1 |
I-95/ I-295 |
New York-Newark, NY-NJ-CT |
US-46 in NJ to I-278/I-678 in NY |
12 |
26,626 |
2,182,899 |
340,120 |
86% |
29% |
11.98 |
271.4 |
3.86 |
2.11 |
$159,883,554 |
2 |
2 |
I-90/ I-94 |
Chicago, IL-IN |
I-94N to I-55 |
10.5 |
16,052 |
1,140,838 |
123,947 |
79% |
-12% |
8.13 |
172.2 |
2.97 |
2.38 |
$63,058,035 |
3 |
27 |
I-71/ I-75 |
Cincinnati, OH-KY-IN |
I-275 in KY to Western Hills in OH |
9.2 |
21,302 |
543,489 |
109,555 |
286% |
146% |
5.44 |
130.6 |
2.25 |
1.41 |
$30,037,300 |
4 |
3 |
I-278 |
New York-Newark, NY-NJ-CT |
I-95/I-678 to Grand Central Pkwy.; and |
7.7 9.2 |
19,650 |
2,703,702 |
106,846 |
58% |
21% |
7.62 |
199.9 |
2.71 |
2.38 |
$149,451,493 |
5 |
23 |
I-80 |
San Francisco-Oakland, CA |
US-101 to Bay Bridge; |
10.7 |
15,758 |
717,622 |
105,254 |
254% |
106% |
8.09 |
215.6 |
2.5 |
1.78 |
$39,665,893 |
6 |
4 |
I-678 |
New York-Newark, NY-NJ-CT |
I-495 to Belt Parkway; and |
5.8 |
13,550 |
480,092 |
101,075 |
50% |
1% |
7.1 |
175.1 |
2.59 |
2.33 |
$26,538,634 |
7 |
15 |
I-10 |
Baton Rouge, LA |
I-110 to SR-1 |
2.2 |
22,378 |
647,215 |
90,002 |
143% |
56% |
6.43 |
257.5 |
1.8 |
2.54 |
$35,771,085 |
8 |
31 |
I-80/ I-94 |
Chicago, IL-IN |
I-294 to I-94 |
4.8 |
49,806 |
963,494 |
82,968 |
200% |
28% |
3.05 |
126.2 |
1.43 |
2.57 |
$53,248,838 |
9 |
- |
I-69C |
McAllen, TX |
At I-2 |
2.7 |
17,046 |
236,951 |
78,304 |
133% |
119% |
4.45 |
136.8 |
1.83 |
2.05 |
$13,093,864 |
10 |
6 |
I-87 |
New York-Newark, NY-NJ-CT |
I-278 to 230th Street |
5.9 |
11,502 |
408,332 |
77,972 |
76% |
20% |
7.39 |
216.7 |
2.34 |
1.78 |
$22,570,472 |
11 |
5 |
I-495 |
New York-Newark, NY-NJ-CT |
Little Neck Parkway to Queens Midtown Tunnel |
14.3 |
20,124 |
1,597,202 |
76,833 |
66% |
8% |
5.69 |
177.6 |
2.13 |
1.82 |
$88,287,636 |
12 |
11 |
I-45 |
Houston, TX |
US-90 to I-69 |
4.2 |
18,374 |
593,798 |
73,569 |
85% |
-13% |
4.73 |
131.5 |
2.02 |
1.63 |
$32,817,007 |
13 |
8 |
I-35 |
Waco, TX |
At 5th Street |
1.4 |
29,552 |
630,635 |
72,581 |
68% |
13% |
4.64 |
193.6 |
1.57 |
2.86 |
$34,852,255 |
14 |
35 |
I-710 |
Los Angeles-Long Beach-Anaheim, CA |
Cesar Chavez Ave. to Atlantic Blvd. |
3 |
17,386 |
378,710 |
70,329 |
176% |
-18% |
6.2 |
231.7 |
1.77 |
2.9 |
$20,931,647 |
15 |
10 |
I-10 |
Los Angeles-Long Beach-Anaheim, CA |
20th Street to I-5; |
15.3 |
16,674 |
1,385,645 |
68,351 |
66% |
-21% |
7.6 |
240.8 |
2.23 |
2.63 |
$76,583,680 |
16 |
7 |
I-75 |
Chattanooga, TN-GA |
At I-24 |
1.6 |
23,078 |
102,909 |
66,083 |
50% |
62% |
4.39 |
150.8 |
1.71 |
1.53 |
$5,687,739 |
17 |
17 |
I-5 |
Los Angeles-Long Beach-Anaheim, CA |
SR-134 Ventura Fwy. to I-605 |
19.8 |
16,674 |
1,320,114 |
63,774 |
85% |
-7% |
5.75 |
199.4 |
1.92 |
1.88 |
$72,966,141 |
18 |
16 |
I-290 |
Chicago, IL-IN |
I-90/I-94 to I-294 |
13.5 |
14,894 |
617,075 |
62,566 |
79% |
-34% |
4.61 |
155.9 |
1.8 |
1.95 |
$34,107,314 |
19 |
9 |
I-35 |
Austin, TX |
US 290 N to Ben White Blvd/SH 71 |
7.9 |
18,820 |
454,504 |
62,363 |
49% |
-44% |
5.97 |
190.9 |
2.05 |
1.73 |
$25,120,597 |
20 |
38 |
I-5 |
Seattle, WA |
I-90 to 85th St; and |
9.6 |
14,582 |
882,485 |
62,041 |
147% |
-11% |
5.74 |
216 |
1.99 |
2.54 |
$48,774,259 |
21 |
12 |
I-610 |
Houston, TX |
I-69 to I-10 and |
4.1 |
15,452 |
379,358 |
61,566 |
60% |
-41% |
5.71 |
210 |
1.93 |
2.49 |
$20,967,423 |
22 |
24 |
I-75/ I-85 |
Atlanta, GA |
I-20 to I-75/I-85 split |
4.2 |
14,710 |
326,884 |
61,019 |
109% |
-4% |
5.93 |
166.4 |
2.22 |
1.82 |
$18,068,079 |
23 |
36 |
I-285 |
Atlanta, GA |
East/ SR-400 to US-78; and |
11.7 |
23,710 |
1,203,300 |
59,712 |
137% |
11% |
3.71 |
139.1 |
1.55 |
2.39 |
$66,501,658 |
24 |
- |
I-40/ I-55 |
Memphis, TN-MS-AR |
Between I-40 and I-55 split exits 279 and 277 in AR |
2.7 |
29,118 |
158,998 |
59,510 |
661% |
2309% |
5.22 |
231.5 |
1.56 |
4.64 |
$8,786,757 |
25 |
22 |
I-69/ US-59 |
Houston, TX |
SR-527 to I 10 |
4.4 |
13,774 |
350,962 |
58,407 |
95% |
-35% |
7.07 |
251.2 |
2.1 |
2.32 |
$19,396,490 |
26 |
18 |
I-405 |
Los Angeles-Long Beach-Anaheim, CA |
At SR-73 and |
2.5 |
15,162 |
1,311,450 |
58,005 |
73% |
-39% |
5.89 |
207.1 |
1.94 |
2.7 |
$72,484,527 |
27 |
54 |
I-75 |
Cincinnati, OH-KY-IN |
SR-562 to SR-126 |
3 |
23,338 |
246,864 |
56,959 |
219% |
65% |
4.11 |
141.8 |
1.52 |
2.27 |
$13,644,113 |
28 |
39 |
I-105 |
Los Angeles-Long Beach-Anaheim, CA |
I-405 to Long Beach Blvd |
13.7 |
16,674 |
767,698 |
55,564 |
122% |
-14% |
6.78 |
270.3 |
1.8 |
4.63 |
$42,429,278 |
29 |
- |
I-55 |
Memphis, TN-MS-AR |
I-40 and I-55 split in AR to Crump Blvd on TN side of Mississippi River |
4.7 |
21,294 |
144,247 |
54,996 |
1555% |
1709% |
6.61 |
323.4 |
1.55 |
5.85 |
$7,972,033 |
30 |
70 |
I-15 |
Las Vegas-Henderson, NV |
I-515 to Tropicana Ave |
5.5 |
31,010 |
634,588 |
54,634 |
258% |
147% |
3.09 |
118.6 |
1.41 |
1.96 |
$35,068,519 |
31 |
14 |
I-24 |
Nashville-Davidson, TN |
US-41 to SR-155 |
5.8 |
26,772 |
474,415 |
53,456 |
42% |
-38% |
3.74 |
171.5 |
1.49 |
3.05 |
$26,221,736 |
32 |
13 |
I-35W |
Dallas-Fort Worth-Arlington, TX |
At I-30 |
1.2 |
13,818 |
97,911 |
52,554 |
38% |
111% |
4.62 |
121.3 |
2.06 |
1.3 |
$5,411,445 |
33 |
73 |
I-93 |
Boston, MA-NH-RI |
At I-90; and |
5.0 |
13,704 |
543,540 |
49,510 |
233% |
81% |
5.22 |
176.9 |
1.88 |
2.94 |
$30,042,839 |
34 |
29 |
I-24/ I-65 |
Nashville-Davidson, TN |
I-65 to I-24 |
1.8 |
27,488 |
84,780 |
48,337 |
75% |
50% |
2.88 |
98.1 |
1.43 |
1.31 |
$4,685,762 |
35 |
20 |
I-95 |
Washington, DC-VA-MD |
SR-123 to SR-286 |
6.3 |
17,652 |
595,518 |
46,146 |
41% |
-6% |
3.93 |
145 |
1.61 |
2.03 |
$32,912,098 |
36 |
53 |
I-80/ I-294 |
Chicago, IL-IN |
I-94 to I-294 |
6.5 |
37,032 |
300,763 |
46,132 |
145% |
40% |
3.05 |
126.4 |
1.34 |
2.65 |
$16,622,028 |
37 |
64 |
I-10 |
Houston, TX |
I-69 to I-45 |
2.1 |
19,098 |
291,811 |
44,603 |
176% |
-75% |
3.98 |
144.6 |
1.58 |
1.78 |
$16,128,461 |
38 |
26 |
I-25 |
Denver-Aurora, CO |
I-70 to University Blvd |
8.7 |
24,402 |
350,753 |
43,161 |
52% |
-23% |
4.16 |
152 |
1.65 |
2.47 |
$19,386,789 |
39 |
52 |
I-24 |
Chattanooga, TN-GA |
I-75 to US-41 |
3.5 |
39,326 |
610,877 |
42,780 |
125% |
33% |
3.95 |
186.6 |
1.38 |
3.58 |
$33,763,659 |
40 |
44 |
I-75 |
Atlanta, GA |
I-85 to Moores Mill Rd |
3.3 |
16,804 |
261,395 |
42,285 |
95% |
78% |
4.85 |
208.3 |
1.57 |
2.5 |
$14,445,832 |
41 |
34 |
I-76 |
Philadelphia, PA-NJ-DE-MD |
University Ave to US-1 |
6.2 |
11,440 |
305,582 |
42,017 |
62% |
-37% |
5.39 |
188.5 |
1.84 |
2.06 |
$16,891,818 |
42 |
21 |
I-270 |
Denver-Aurora, CO |
I-25 to I-70 |
5.8 |
10,750 |
182,009 |
40,436 |
32% |
-19% |
5.85 |
191.9 |
1.98 |
1.86 |
$10,059,745 |
43 |
32 |
I-5 |
Portland, OR-WA |
Columbia River to Terwilliger Blvd |
10.5 |
19,440 |
503,062 |
40,407 |
48% |
-27% |
4.71 |
202.4 |
1.55 |
2.75 |
$27,804,513 |
44 |
49 |
I-10 |
New Orleans, LA |
SR-49 to I-610 to and at Pontchartrain Expy. |
7.5 |
39,384 |
412,570 |
39,944 |
102% |
-35% |
4.3 |
153.1 |
1.7 |
2.23 |
$22,800,365 |
45 |
45 |
I-55 |
Chicago, IL-IN |
I-94 to SR-171 |
10 |
14,356 |
363,710 |
38,433 |
78% |
-29% |
4.89 |
181.9 |
1.69 |
2.22 |
$20,102,458 |
46 |
- |
I-345/ US-75 |
Dallas-Fort Worth-Arlington, TX |
Woodall Rodgers Fwy to I-30 |
2 |
13,210 |
73,033 |
37,216 |
34% |
5% |
5.24 |
216.6 |
1.63 |
3.03 |
$4,036,493 |
47 |
19 |
I-30 |
Little Rock, AR |
I-630 to I-40 |
2.9 |
40,520 |
334,023 |
36,188 |
9% |
-30% |
1.98 |
56 |
1.21 |
1.74 |
$18,461,092 |
48 |
48 |
I-95 |
Philadelphia, PA-NJ-DE-MD |
At I-676 |
1.7 |
26,644 |
60,526 |
35,778 |
77% |
0% |
3.42 |
157.8 |
1.33 |
3.07 |
$3,345,131 |
49 |
47 |
I-635 |
Dallas-Fort Worth-Arlington, TX |
I-35 to SR-78 |
14 |
18,302 |
624,526 |
35,693 |
73% |
-4% |
3.8 |
137 |
1.6 |
2.1 |
$34,515,016 |
50 |
40 |
I-676 |
Philadelphia, PA-NJ-DE-MD |
I-76 to I-95 |
2.2 |
8,760 |
135,423 |
35,595 |
47% |
-12% |
4.69 |
142.4 |
2.03 |
1.64 |
$7,485,968 |
51 |
- |
I-610 |
New Orleans, LA |
At I-10 |
1.4 |
14,920 |
50,400 |
35,067 |
59% |
-7% |
4.8 |
220.4 |
1.49 |
3.65 |
$2,785,692 |
52 |
- |
I-515 |
Las Vegas-Henderson, NV |
I-15 to Flamingo Rd |
7.1 |
18,342 |
281,575 |
34,631 |
367% |
171% |
4.3 |
132.6 |
1.79 |
1.56 |
$15,561,856 |
53 |
63 |
I-15 |
Los Angeles-Long Beach-Anaheim, CA |
At I-10 |
3.2 |
16,674 |
174,824 |
34,480 |
106% |
-28% |
3.07 |
114.1 |
1.42 |
2 |
$9,662,995 |
54 |
30 |
I-70 |
Denver-Aurora, CO |
I-25 to I-270 |
4.8 |
16,580 |
144,385 |
34,127 |
23% |
-36% |
3.97 |
141.9 |
1.64 |
1.79 |
$7,980,896 |
55 |
71 |
I-294 |
Chicago, IL-IN |
At I-290; and |
6.1 |
31,888 |
351,488 |
33,250 |
118% |
-21% |
3.06 |
131.9 |
1.31 |
2.39 |
$19,426,409 |
56 |
28 |
I-30 |
Dallas-Fort Worth-Arlington, TX |
I-35 to Grand Ave. |
4 |
15,156 |
297,056 |
33,199 |
20% |
6% |
4.28 |
157.2 |
1.65 |
1.94 |
$16,418,607 |
57 |
33 |
I-95 |
Bridgeport-Stamford, CT-NY |
At US-1 in Fairfield; and |
1.5 |
20,496 |
1,116,502 |
32,554 |
22% |
19% |
3.48 |
139.3 |
1.46 |
2.22 |
$61,708,615 |
58 |
55 |
I-95 |
New Haven, CT |
I-91 to SR-10 |
1.8 |
15,794 |
58,948 |
32,277 |
82% |
20% |
3.92 |
172.6 |
1.43 |
2.98 |
$3,258,121 |
59 |
61 |
I-15 |
Riverside-San Bernardino, CA |
At SR-91 |
2.2 |
11,350 |
113,529 |
32,247 |
92% |
-33% |
6.66 |
245.2 |
2.05 |
3.73 |
$6,274,869 |
60 |
I-15 |
Ogden-Layton, UT |
I-84 to 650 N |
4 |
24,584 |
172,848 |
32,081 |
101% |
33% |
3.38 |
155.6 |
1.32 |
2.85 |
$9,552,901 |
|
61 |
86 |
I-90 |
Chicago, IL-IN |
I-90/94 to I-294 |
6.7 |
22,800 |
352,554 |
31,695 |
166% |
-27% |
6.29 |
160.3 |
2.42 |
2.5 |
$19,483,539 |
62 |
65 |
I-110 |
Los Angeles-Long Beach-Anaheim, CA |
I-10 to SR-42 Stauson Ave. |
3.4 |
11,556 |
96,545 |
31,370 |
94% |
-36% |
4.86 |
158.3 |
1.86 |
2.04 |
$5,336,276 |
63 |
90 |
I-64 |
St. Louis, MO-IL |
Market St to I-70 (over Mississippi River) |
5 |
10,130 |
41,181 |
30,634 |
170% |
-28% |
3.47 |
129.8 |
1.42 |
2.94 |
$2,275,952 |
64 |
58 |
I-880 |
San Francisco-Oakland, CA |
SR-92 to SR-84 |
6.4 |
16,524 |
268,839 |
30,103 |
75% |
-9% |
3.02 |
109.3 |
1.43 |
1.62 |
$14,858,141 |
65 |
I-45 |
Dallas-Fort Worth-Arlington, TX |
Illinois Ave to Wright Fwy |
3.4 |
16,680 |
101,570 |
29,874 |
206% |
89% |
2.93 |
89.6 |
1.42 |
1.47 |
$5,613,271 |
|
66 |
51 |
I-695 |
Baltimore, MD |
I-95 to I-795 |
10.1 |
19,174 |
31,097 |
29,491 |
53% |
-36% |
2.73 |
110.4 |
1.3 |
2.11 |
$1,718,878 |
67 |
46 |
I-605 |
Los Angeles-Long Beach-Anaheim, CA |
I-5 to SR-60 |
6.5 |
16,024 |
179,208 |
29,179 |
38% |
-79% |
3.27 |
94.4 |
1.68 |
1.43 |
$9,905,503 |
68 |
69 |
I-215 |
Riverside-San Bernardino, CA |
I-10 to SR-80 |
5.9 |
14,384 |
435,697 |
28,811 |
88% |
-18% |
2.92 |
79.5 |
1.54 |
1.28 |
$24,083,078 |
69 |
41 |
I-35E |
Dallas-Fort Worth-Arlington, TX |
I-30 to John W. Carpenter/SH 183 |
2.8 |
17,298 |
117,682 |
28,780 |
23% |
-23% |
3.02 |
111.3 |
1.42 |
1.69 |
$6,505,010 |
70 |
68 |
I-210 |
Los Angeles-Long Beach-Anaheim, CA |
SR-39/164 Azusa Ave to SR-19 Rosemead Blvd |
10 |
19,966 |
255,762 |
28,244 |
80% |
-53% |
2.87 |
116.3 |
1.36 |
1.8 |
$14,136,524 |
71 |
74 |
I-580 |
Concord, CA |
At I-680 |
1.1 |
16,674 |
30,924 |
28,133 |
96% |
-42% |
3.66 |
166.8 |
1.37 |
3.01 |
$1,709,154 |
72 |
43 |
I-94 |
Chicago, IL-IN |
I-90/94 to US-14 |
2.3 |
16,000 |
91,783 |
27,301 |
23% |
-19% |
3.03 |
117.7 |
1.39 |
1.63 |
$5,072,824 |
73 |
50 |
I-405 |
Seattle, WA |
I-90 to SR-520 |
3.7 |
10,364 |
121,276 |
27,213 |
40% |
-33% |
4.35 |
171.6 |
1.56 |
2.27 |
$6,702,947 |
74 |
62 |
I-85 |
Atlanta, GA |
I-75 to SR 13/141; and |
2.8 |
23,884 |
322,228 |
27,192 |
63% |
-28% |
5.32 |
169.4 |
1.96 |
1.8 |
$17,807,833 |
75 |
79 |
I-580 |
San Francisco-Oakland, CA |
At I-980 and |
1.4 |
16,674 |
37,888 |
26,717 |
106% |
-31% |
3.07 |
100.5 |
1.47 |
1.6 |
$2,093,729 |
76 |
80 |
I-10 |
Riverside-San Bernardino, CA |
At I-215 |
8.5 |
20,308 |
223,143 |
26,329 |
345% |
-16% |
2.35 |
80.4 |
1.27 |
1.64 |
$12,333,853 |
77 |
66 |
I-24/ I-40 |
Nashville-Davidson, TN |
I-24 to I-65 |
3.0 |
12,032 |
42,086 |
25,217 |
57% |
-26% |
3.11 |
111.9 |
1.46 |
1.48 |
$2,326,247 |
78 |
79 |
I-40 |
Memphis, TN-MS-AR |
At I-55 |
2.8 |
19,464 |
71,443 |
24,961 |
95% |
911% |
1.9 |
33.2 |
1.4 |
1.77 |
$3,948,148 |
79 |
|
I-70 |
Rural, IN |
SR-9 to N 600 W |
9.6 |
18,104 |
231,819 |
24,229 |
608% |
276% |
3.51 |
138 |
1.46 |
1.61 |
$12,813,635 |
80 |
98 |
I-20 |
Dallas-Fort Worth-Arlington, TX |
At SR-360 |
5.8 |
26,572 |
139,885 |
24,095 |
123% |
106% |
1.97 |
56.6 |
1.22 |
1.39 |
$7,730,484 |
81 |
88 |
I-40 |
Knoxville, TN |
At I-140 |
2.3 |
20,680 |
54,804 |
24,063 |
108% |
20% |
2.64 |
108.7 |
1.25 |
2.24 |
$3,028,903 |
82 |
- |
I-110 |
El Paso, TX-NM |
I-10 to Mexican boarder |
0.7 |
2,168 |
16,422 |
23,785 |
166% |
379% |
11.22 |
130.8 |
4.8 |
1.24 |
$907,489 |
83 |
- |
I-205 |
Rural, CA |
At I-580 |
4.0 |
13,870 |
89,660 |
23,343 |
31% |
-43% |
4.24 |
197 |
1.43 |
3.04 |
$4,955,402 |
84 |
- |
I-630 |
Little Rock, AR |
At I-30 |
0.7 |
33,186 |
15,886 |
23,312 |
127% |
-3% |
1.8 |
46.6 |
1.22 |
1.37 |
$877,947 |
85 |
37 |
I-495 |
Washington, DC-VA-MD |
I-66 (VA) to I-95 (MD) |
19.5 |
8644 |
83,856 |
23,167 |
264% |
72% |
2.39 |
90 |
1.25 |
1.84 |
$5,515,292 |
86 |
- |
I-74/ I-465 |
Indianapolis, IN |
I-65 to SR-37 |
4.3 |
20,244 |
99,783 |
23,167 |
264% |
72% |
2.39 |
89.9 |
1.25 |
1.84 |
$5,515,292 |
87 |
75 |
I-12 |
Baton Rouge, LA |
At I-10 |
3.1 |
19,292 |
72,240 |
23,108 |
62% |
-2% |
2.07 |
65.9 |
1.24 |
1.88 |
$3,992,476 |
88 |
59 |
I-10 |
Lake Charles, LA |
At I-210 |
9.3 |
29,982 |
208,203 |
22,434 |
31% |
-63% |
1.57 |
32.8 |
1.17 |
1.4 |
$11,506,626 |
89 |
77 |
I-20 |
Atlanta, GA |
I-285 to SR-6 |
6.0 |
11,800 |
133,215 |
22,379 |
73% |
16% |
2.98 |
108.7 |
1.43 |
1.69 |
$7,363,013 |
90 |
78 |
I-820 |
Dallas-Fort Worth-Arlington, TX |
At I-35W |
3.0 |
8,596 |
66,133 |
22,237 |
72% |
379% |
3.61 |
98.5 |
1.68 |
1.37 |
$3,655,498 |
91 |
76 |
I-376 |
Pittsburgh, PA |
Fort Pitt Bridge to Squirrel Hill |
4.5 |
5,156 |
35,777 |
22,195 |
58% |
-29% |
5.19 |
211.7 |
1.67 |
2.7 |
$1,977,539 |
92 |
60 |
I-95 |
Aberdeen-Bel Air South-Bel Air North, MD |
SR 24 to SR 152 |
1.6 |
23,414 |
35,629 |
21,597 |
28% |
-40% |
2.76 |
117.5 |
1.27 |
2.31 |
$1,969,047 |
93 |
- |
I-55 |
St. Louis, MO-IL |
I-44 and I-64 |
1.5 |
17,276 |
33,118 |
21,408 |
264% |
83% |
2.72 |
106.6 |
1.29 |
2.09 |
$1,830,424 |
94 |
- |
I-287 |
New York-Newark, NY-NJ-CT |
I-87 to SR-100 |
2.5 |
20,914 |
52,564 |
21,385 |
90% |
-32% |
2.03 |
62.5 |
1.23 |
1.26 |
$2,905,230 |
95 |
- |
I-35 |
San Antonio, TX |
At I-10 |
4.4 |
24,856 |
92,582 |
21,195 |
111% |
-46% |
2.22 |
79.6 |
1.22 |
1.6 |
$5,116,612 |
96 |
- |
I-65 |
Nashville, TN |
At SR-386 |
2.6 |
13,768 |
53,488 |
20,874 |
84% |
4% |
3.44 |
156 |
1.33 |
2.75 |
$2,955,977 |
97 |
- |
I-5 |
San Diego, CA |
Via de la Valle to Encinitas Blvd |
5.2 |
16,674 |
105,443 |
20,351 |
|
|
2.69 |
108 |
1.29 |
2.05 |
$31,211,000 |
98 |
- |
I-4 |
Tampa, FL |
East of I-275 |
5.8 |
13,750 |
110,354 |
19,103 |
68% |
-12% |
1.36 |
61 |
2.32 |
1.32 |
$16,630,000 |
99 |
- |
I-95 |
Miami, FL |
Florida Turnpike to I-395 |
7.7 |
4,816 |
147,218 |
19,018 |
72% |
-13% |
3.90 |
146 |
1.58 |
2.00 |
$8,136,264 |
100 |
- |
I-94 |
Milwaukee, WI |
At I-41/I-894 |
2.9 |
7,004 |
43,760 |
15,219 |
75% |
-19% |
2.6 |
102 |
1.27 |
2.03 |
$2,418,631 |
AADTT = average daily truck traffic; BI = buffer index; PTI = planning time index; TRI = travel reliability index; TTI = travel time index.
Information is provided in the table for the overall congested corridor, the bottleneck segment with the greatest delay, and congestion costs for all congested segments with the urbanized area.
There was an overall increase in delay for nearly all bottlenecks as traffic volumes began to resume after the 2020 COVID-19 global pandemic stay at home orders. Nationwide, there was a reduction in total truck delay on the Interstate system of 41 percent between 2019 and 2020 followed by an increase in 2021. Total truck delay on the Interstate system in 2021 returned to 84 percent of 2019 pre-pandemic delay.
While there was a large increase in delay for nearly all bottlenecks, the following bottlenecks saw the greatest relative percent increase in delay between 2020 and 2021. Major roadwork was another source of increased delay on certain routes. As can be seen in Table 2, the emergency closure of the I-40 Hernando DeSoto Bridge over the Mississippi River caused largest increase in delay on I-55 and other roadways in the Memphis, TN-AR area.
Road |
Urban Area, State |
Percent Increase in Delay Per Mile From 2020 |
|---|---|---|
| I–55 | Memphis, TN-MS-AR | 1555% |
| I–40/ I–55 | Memphis, TN-MS-AR | 661% |
| I–70 | Rural, IN | 608% |
| I–515 | Las Vegas-Henderson, NV | 367% |
| I–580 | San Francisco-Oakland, CA | 363% |
| I–71/ I–75 | Cincinnati, OH-KY-IN | 286% |
| I–74/ I–465 | Indianapolis, IN | 264% |
| I–55 | St. Louis, MO-IL | 264% |
| I–15 | Las Vegas-Henderson, NV | 258% |
| I–80 | San Francisco-Oakland, CA | 254% |
Based upon changes to truck hours of delay per mile, the following bottlenecks saw a relative increase in delay, moving the locations to the top 100 bottlenecks, or a relative decrease in delay, dropping the locations below the top 100 bottlenecks.
The following bottlenecks were added to the list in 2021:
Road |
Urban Area, State |
|---|---|
| I–55 | Memphis, TN-MS-AR |
| I–40/ I–55 | Memphis, TN-MS-AR |
| I–70 | Rural, IN |
| I–515 | Las Vegas-Henderson, NV |
| I–74/ I–465 | Indianapolis, IN |
| I–55 | St. Louis, MO-IL |
| I–45 | Dallas-Fort Worth-Arlington, TX |
| I–110 | El Paso, TX-NM |
| I–69C | McAllen, TX |
| I–630 | Little Rock, AR |
| I–35 | San Antonio, TX |
| I–15 | Ogden-Layton, UT |
| I–287 | New York-Newark, NY-NJ-CT |
| I–610 | New Orleans, LA |
| I–345/ US-75 | Dallas-Fort Worth-Arlington, TX |
| I–205 | Rural, CA |
| I–5 | San Diego, CA |
| I–4 | Tampa-St. Petersburg, FL |
| I–94 | Milwaukee, WI |
The following bottlenecks from 2020 dropped off the list in 2021:
| Road | Urban Area, State |
|---|---|
| I–680 | San Francisco-Oakland, CA |
| I–580 | Livermore, CA |
| I–435 | Kansas City, MO-KS |
| I–15 | Salt Lake City, UT |
| I–95 | Washington, DC-MD-VA |
| I–78 | New York-Newark, NY-NJ |
| I–84 | Waterbury, CT |
| I–39 | Rockford IL |
| I–70 | St. Louis, MO |
| I–270 | St. Louis, MO |
| I–4 | Orlando, FL |
| I–270 | Washington, DC-MD-VA |
| I–225 | Denver-Aurora, CO |
| I–95 | Fredericksburg, VA |
| I–295 | New York-Newark, NY-NJ-CT |
| I–80/ | Chicago, IL-IN |
| I–35 | Kansas City, MO-KS |
| I–15 | Murrieta-Temecula-Menifee, CA |
| I–75 | Toledo, OH |
The following map shows the top Interstate bottlenecks in the U.S. as listed in table 1 based on Annual Truck Hours of Delay per Mile for 2021
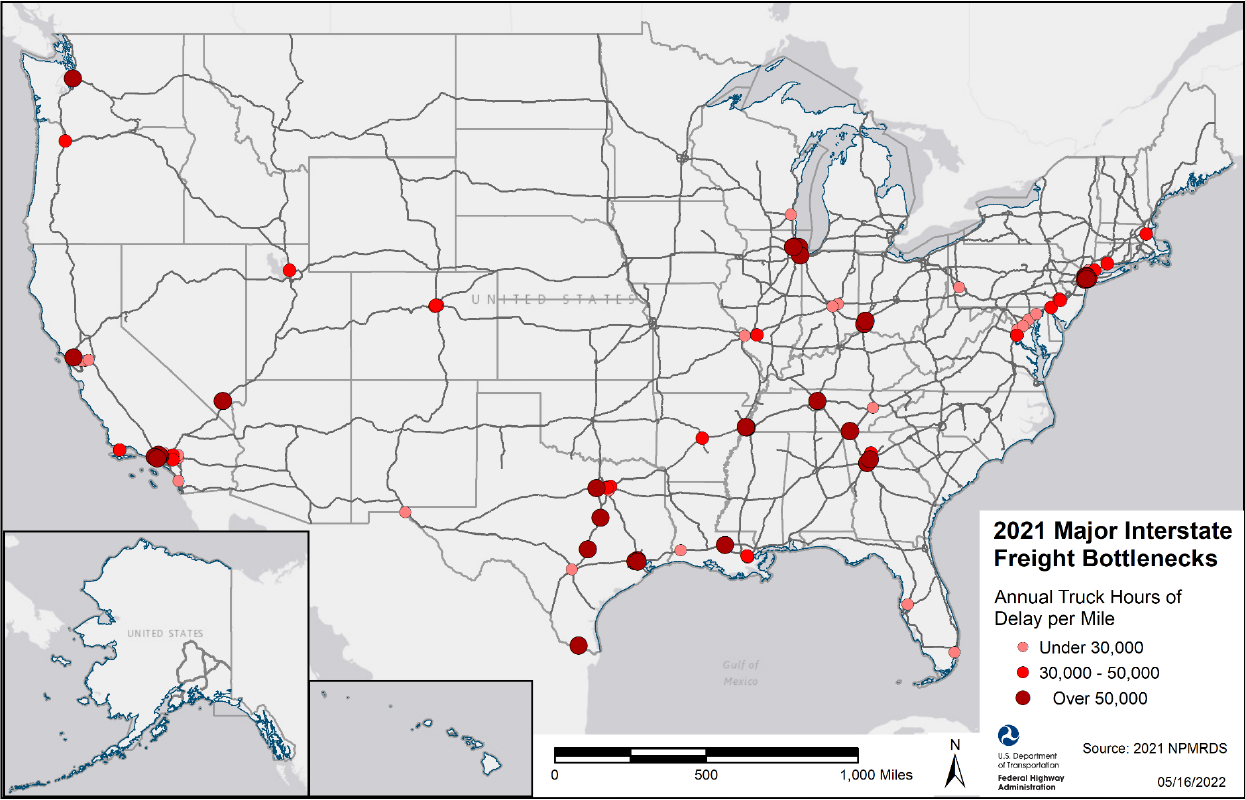
Map 1. Major Interstate Highway Freight Bottlenecks Based on Annual Truck Hours of Delay per Mile, 2021 NPMRDS
Description automatically generated with medium confidence.
The analysis in this report uses delay per mile for assessing bottlenecks to allow for comparison over the entire Interstate system across all States. Individual State DOTs and Metropolitan Planning Organizations (MPOs) use a range of bottleneck identification methods based upon their freight plan development process and local traffic characteristics, infrastructure constraints, and impediments to efficient freight movement.
There is a range of methods for measuring congestion, delay, and reliability. Reliability is another factor that is important to the freight industry and can be measured with metrics such as the Truck Travel Time Reliability national performance measure or some of the other indices listed in Table 1.
In addition to congestion-based delay, some truck freight bottlenecks can be attributed to infrastructure restrictions that uniquely impact trucks, such as bridges with weight or clearance restrictions; steep grades; frequent adverse weather; or constraints at facilities, such as ports, intermodal rail facilities, and border crossings.
Individual State Freight Plans should be reviewed for additional information on the various types of freight bottlenecks.
|
United States Department of Transportation - Federal Highway Administration |
||