
| Skip to content |
|
|
|
2020 National List of Major Freight Highway Bottlenecks and Congested Corridors
|
|||||||||||||||||||||||||||||||||||||||||||||||||||||||||||||||||||||||||||||||||||||||||||||||||||||||||||||||||||||||||||||||||||||||||||||||||||||||||||||||||||||||||||||||||||||||||||||||||||||||||||||||||||||||||||||||||||||||||||||||||||||||||||||||||||||||||||||||||||||||||||||||||||||||||||||||||||||||||||||||||||||||||||||||||||||||||||||||||||||||||||||||||||||||||||||||||||||||||||||||||||||||||||||||||||||||||||||||||||||||||||||||||||||||||||||||||||||||||||||||||||||||||||||||||||||||||||||||||||||||||||||||||||||||||||||||||||||||||||||||||||||||||||||||||||||||||||||||||||||||||||||||||||||||||||||||||||||||||||||||||||||||||||||||||||||||||||||||||||||||||||||||||||||||||||||||||||||||||||||||||||||||||||||||||||||||||||||||||||||||||||||||||||||||||||||||||||||||||||||||||||||||||||||||||||||||||||||||||||||||||||||||||||||||||||||||||||||||||||||||||||||||||||||||||||||||||||||||||||||||||||||||||||||||||||||||||||||||||||||||||||||||||||||||||||||||||||||||||||||||
| 2020 Rank | 2019 Rank |
Road | Urban Area | State | Generalized Bottleneck Location/Congested Corridor | Length (Miles) | AADTT (Trucks) | Delay (Hours) | Delay/ Mile | Change from 2019 | PTI | BI | TTI | TRI | Total Corridor Congestion Cost ($/year) |
|---|---|---|---|---|---|---|---|---|---|---|---|---|---|---|---|
| 1 | 1 |
I-95/I-295 | New York-Newark | NY/ NJ | I-278/I-678 to NJ side of GW Bridge/SR-4 | 8.2 |
19,904 |
234,370 |
183,109 |
-30% |
8.66 |
226% |
2.66 |
1.66 |
$60,862,576 |
| 2 | 2 |
I-90/I-94 | Chicago | IL | I-94N to I-55 | 10.5 |
12,346 |
126,718 |
69,266 |
-51% |
5.97 |
186% |
2.05 |
1.60 |
$39,388,090 |
| 3 | 10 |
I-278 | New York-Newark | NY | I-95/I-678 to Grand Central Pkwy.; and SR-27 Prospect Expy. to SR-29 Queens Blvd. | 7.7 9.2 |
13,842 |
541,710 |
67,503 |
-24% |
5.41 |
177% |
1.92 |
1.72 |
$107,226,782 |
| 4 | 6 |
I-678 | New York-Newark | NY | I-495 to Belt Parkway; and I-295/I-95 to south end Bronx-Whitestone Bridge |
5.8
2.9 |
14,356 |
90,053 |
67,177 |
-33% |
6.08 |
271% |
1.92 |
2.11 |
$19,834,950 |
| 5 | 16 |
I-495 | New York-Newark | NY | Little Neck Parkway to Queens Midtown Tunnel | 14.3 |
19,030 |
167,893 |
46,377 |
-35% |
3.15 |
105% |
1.47 |
1.61 |
$73,483,130 |
| 6 | 20 |
I-87 | New York-Newark | NY | I-278 to 230th Street | 5.9 |
11,496 |
113,682 |
44,289 |
-32% |
5.87 |
210% |
1.86 |
2.36 |
$23,666,057 |
| 7 | 50 |
I-75 | Chattanooga | TN | At I-24 | 1.6 |
22,912 |
68,517 |
43,998 |
8% |
3.17 |
115% |
1.43 |
1.46 |
$5,440,999 |
| 8 | - |
I-35 | Waco | TX | At 5th Street | 1.4 |
26,742 |
60,431 |
43,287 |
-32% |
2.50 |
81% |
1.37 |
1.95 |
$20,107,086 |
| 9 | 4 |
I-35 | Austin | TX | US 290 N to Ben White Blvd/SH 71 | 7.9 |
18,982 |
87,157 |
41,852 |
-62% |
4.74 |
175% |
1.70 |
2.25 |
$50,933,236 |
| 10 | 12 |
I-10 | Los Angeles-Long Beach-Anaheim | CA | 20th Street to I-5; And at I-605 |
15.3 6.0 |
13,082 |
103,007 |
41,130 |
-53% |
5.30 |
181% |
1.86 |
1.84 |
$65,058,852 |
| 11 | 14 |
I-45 | Houston | TX | US-90 to I-69 | 4.2 |
12,264 |
64,657 |
39,684 |
-53% |
4.06 |
125% |
1.75 |
1.52 |
$37,320,233 |
| 12 | 5 |
I-610 | Houston | TX | I-69 to I-10 and At I-45 |
4.1 2.1 |
16,284 |
45,396 |
38,509 |
-63% |
3.55 |
143% |
1.45 |
2.16 |
$30,430,274 |
| 13 | 82 |
I-35W | Dallas-Fort Worth-Arlington | TX | At I-30 | 1.2 |
13,532 |
70,787 |
37,995 |
52% |
4.02 |
129% |
1.74 |
1.45 |
$10,085,773 |
| 14 | 11 |
I-24 | Nashville-Davidson | TN | US-41 to SR-155 | 5.8 |
25,954 |
100,495 |
37,683 |
-57% |
2.82 |
113% |
1.31 |
1.83 |
$27,255,669 |
| 15 | 26 |
I-10 | Baton Rouge | LA | I-110 to SR-1 | 2.2 |
21,916 |
79,576 |
36,968 |
-36% |
3.35 |
147% |
1.35 |
2.94 |
$18,806,906 |
| 16 | 8 |
I-290 | Chicago | IL | I-90/I-94 to I-294 | 13.5 |
16,470 |
59,893 |
35,003 |
-63% |
3.33 |
136% |
1.40 |
2.09 |
$30,201,406 |
| 17 | 18 |
I-5 | Los Angeles-Long Beach-Anaheim | CA | SR-134 Ventura Fwy. to I-605 |
19.8 |
10,268 |
103,481 |
34,553 |
-50% |
4.80 |
145% |
1.92 |
1.70 |
$49,766,987 |
| 18 | 7 |
I-405 | Los Angeles-Long Beach-Anaheim | CA | At SR-73 and SR-2 Santa Monica Blvd to SR-42 Manchester Blvd | 2.5
7.5
|
13,082 |
124,105 |
33,532 |
-65% |
4.93 |
211% |
1.58 |
2.86 |
$58,755,827 |
| 19 | 33 |
I-30 | Little Rock | AR | I-630 to I-40 | 2.9 |
40,500 |
62,015 |
33,062 |
-36% |
1.52 |
30% |
1.18 |
1.25 |
$8,219,699 |
| 20 | 37 |
I-95 | Washington | VA | SR-123 to SR-286 | 6.3 |
17,758 |
224,407 |
32,764 |
-33% |
3.26 |
119% |
1.41 |
1.83 |
$29,433,824 |
| 21 | 36 |
I-270 | Denver-Aurora | CO | I-25 to I-70 | 5.8 |
11,028 |
98,322 |
30,700 |
-39% |
4.09 |
157% |
1.58 |
2.07 |
$9,298,149 |
| 22 | 9 |
I-69/ US-59 | Houston | TX | SR-527 to I 10 | 4.4 |
9,284 |
32,014 |
29,879 |
-66% |
6.21 |
253% |
1.76 |
3.62 |
$19,917,616 |
23 |
34 |
I-80 | San Francisco-Oakland | CA | US-101 to Bay Bridge; And at I-580 | 10.7 |
5,318 |
52,639 |
29,708 |
-42% |
7.36 |
257% |
1.99 |
1.90 |
$18,096,301 |
24 |
22 |
I-75/ I-85 | Atlanta | GA | I-20 to I-75/I-85 split | 4.2 |
16,616 |
19,889 |
29,150 |
-54% |
4.12 |
195% |
1.69 |
2.75 |
$10,569,277 |
| 25 | 43 |
I-80/ I-94 | Chicago | IL | I-294 to I-94 | 4.8 |
41,800 |
101,368 |
29,068 |
-38% |
2.05 |
75% |
1.18 |
1.92 |
$6,186,898 |
| 26 | 27 |
I-25 | Denver-Aurora | CO | I-70 to University Blvd | 8.7 |
14,208 |
46,921 |
28,475 |
-49% |
3.40 |
134% |
1.45 |
2.00 |
$27,293,667 |
| 27 | 45 |
I-71/ I-75 | Cincinnati | KY/OH | I-275 to Western Hills | 9.2 |
21,038 |
166,424 |
28,397 |
-36% |
2.70 |
100% |
1.32 |
1.99 |
$25,081,187 |
| 28 | 68 |
I-30 | Dallas-Fort Worth-Arlington | TX | I-35 to Grand Ave. | 4 |
17,528 |
100,720 |
27,704 |
-12% |
3.05 |
120% |
1.38 |
1.99 |
$19,267,107 |
| 29 | - |
I-24/ I-65 | Nashville-Davidson | TN | I-65 to I-24 | 1.8 |
26,112 |
48,517 |
27,662 |
-14% |
2.38 |
90% |
1.25 |
2.01 |
$2,961,1650 |
| 30 | 32 |
I-70 | Denver-Aurora | CO | I-25 to I-270 | 4.8 |
12,566 |
64,712 |
27,6541 |
-48%% |
3.40 |
135% |
1.45 |
2.19 |
$13,540,489 |
| 31 | - |
I-80/ I-94 | Chicago | IN | I-66 (VA) to I-95 (MD) | 9 |
46,002 |
41,471 |
27,648 |
-57% |
1.61 |
43% |
1.12 |
1.49 |
$31,420,056 |
| 32 | 28 |
I-5 | Portland | OR | Columbia River to Terwilliger Blvd | 10.5 |
12,264 |
72,756 |
27,387 |
-50% |
4.20 |
196% |
1.40 |
3.55 |
$23,353,128 |
| 33 | 78 |
I-95 | Bridgeport-Stamford | CT | At US-1 in Fairfield; and At US-1 in Stamford | 1.5
1.8
|
20,046 |
48,416 |
26,609 |
-2% |
3.17 |
123% |
1.38 |
2.29 |
$49,051,842 |
| 34 | 19 |
I-76 | Philadelphia | PA | University Ave to US-1 | 6.2 |
7,134 |
86,555 |
26,000 |
-61% |
4.64 |
129% |
1.80 |
1.65 |
$23,081,385 |
| 35 | 13 |
I-710 | Los Angeles-Long Beach-Anaheim | CA | Cesar Chavez Ave. to Atlantic Blvd. | 3 |
10,874 |
34,873 |
25,518 |
-70% |
3.51 |
135% |
1.47 |
2.32 |
$20,079,146 |
| 36 | 30 |
I-285 | Atlanta | GA | East/ SR-400 to US-78; and West/ I-20 to Northside Dr | 11.7
11.2
|
12,420 |
40,984 |
25,225 |
-53% |
3.61 |
150% |
1.44 |
1.97 |
$67,144,527 |
| 37 | 31 |
I-495 | Washington | MD | I-66 (VA) to I-95 (MD) | 19.5 |
19,3584 |
130,868 |
25,171 |
-53% |
2.42 |
91% |
1.26 |
1.96 |
$42,907,765 |
| 38 | 17 |
I-5 |
Seattle | WA | I-90 to 85th St; and SR-18 to Port of Tacoma Rd | 9.6
7.1
|
14,026 |
50,047 |
25,096 |
-64% |
3.32 |
130% |
1.41 |
1.93 |
$30,737,968 |
| 39 | 21 |
I-105 | Los Angeles-Long Beach-Anaheim | CA | I-405 to Long Beach Blvd | 13.7 |
10,874 |
50,701 |
25,023 |
-61% |
3.50 |
114% |
1.54 |
1.48 |
$24,741,563 |
| 40 | 51 |
I-676 | Philadelphia | PA | I-76 to I-95 | 2.2 |
7,666 |
57,491 |
24,254 |
-40% |
4.31 |
127% |
1.87 |
1.47 |
$5,486,314 |
| 41 | 56 |
I-35E | Dallas-Fort Worth-Arlington | TX | I-30 to John W. Carpenter/SH 183 | 2.8 |
14,976 |
55,930 |
23,363 |
-38% |
2.75 |
103% |
1.35 |
1.81 |
$13,369,641 |
| 42 | 15 |
I-680 | San Francisco-Oakland | CA | SR-262 to SR-238 | 4.3 |
12,476 |
61,568 |
23,180 |
-71% |
3.80 |
165% |
1.43 |
2.82 |
$4,366,568 |
| 43 | 63 |
I-94 | Chicago | IL | I-90/94 to US-14 | 2.3 |
16,000 |
74,921 |
22,285 |
-34% |
2.70 |
105% |
1.32 |
1.88 |
$7,415,369 |
| 44 | 84 |
I-75 | Atlanta | GA | I-85 to Moores Mill Rd | 3.3 |
18,194 |
26,816 |
21,651 |
-9% |
3.24 |
155% |
1.27 |
3.00 |
$11,798,954 |
| 45 | 29 |
I-55 | Chicago | IL | I-94 to SR-171 | 10 |
11,800 |
94,901 |
21,627 |
-60% |
3.29 |
125% |
1.42 |
2.34 |
$25,564,476 |
| 46 | 3 |
I-605 | Los Angeles-Long Beach-Anaheim | CA | I-5 to SR-60 | 6.5 |
12,802 |
88,753 |
21,146 |
-85% |
2.76 |
90% |
1.38 |
1.48 |
$14,120,562 |
| 47 | 57 |
I-635 | Dallas-Fort Worth-Arlington | TX | I-35 to SR-78 | 14 |
19,250 |
27,812 |
20,637 |
-44% |
2.32 |
82% |
1.27 |
1.81 |
$30,709,177 |
| 48 | 59 |
I-95 | Philadelphia | PA | At I-676 | 2 |
10,142 |
36,568 |
20,230 |
-43% |
2.83 |
97% |
1.42 |
1.83 |
$6,557,444 |
| 49 | 43 |
I-10 | New Orleans | LA | SR-49 to I-610 to and at Pontchartrain Expy. | 7.5
3.9 |
11,336 |
30,154 |
19,794 |
-68% |
4.10 |
156% |
1.59 |
2.07 |
$21,417,020 |
| 50 | 49 |
I-405 | Seattle | WA | I-90 to SR-520 | 3.7 |
10,630 |
86,763 |
19,469 |
-52% |
3.99 |
155% |
1.51 |
2.52 |
$6,969,360 |
| 51 | 44 |
I-695 | Baltimore | MD | I-95 to I-795 | 10.1 |
22,036 |
20,387 |
19,334 |
-58% |
1.77 |
48% |
1.20 |
1.43 |
$17,310,587 |
| 52 | 65 |
I-24 | Chattanooga | TN | I-75 to US-41 | 3.5 |
23,472 |
78,874 |
19,014 |
-41% |
2.11 |
72% |
1.22 |
1.84 |
$11,710,215 |
| 53 | I-80/ I-294 | Chicago | IL | I-94 to I-294 | 6.2 |
36,606 |
122,649 |
18,812 |
-43% |
1.44 |
27% |
1.13 |
1.35 |
$7,485,719 |
|
| 54 | 62 |
I-75 | Cincinnati | OH | SR-562 to SR-126 | 3 |
17,814 |
77,364 |
17,850 |
-48% |
2.14 |
58% |
1.22 |
1.77 |
$10,991,102 |
| 55 | 80 |
I-95 | New Haven | CT | I-91 to SR-10 | 1.8 |
19,640 |
32,444 |
17,765 |
-34% |
1.92 |
58% |
1.21 |
1.67 |
$1,980,159 |
| 56 | 94 |
I-580 | Livermore | CA | I-205 to First Street | 7.1 |
14,928 |
124,122 |
14,470 |
-17% |
2.23 |
75% |
1.25 |
1.70 |
$7,575,595 |
| 57 | - |
I-435 | Kansas City | MO | At US-24 | 3.7 |
11,774 |
64,358 |
17,276 |
-15% |
3.08 |
114% |
1.36 |
1.96 |
$3,927,996 |
| 58 | 64 |
I-880 | San Jose | CA | At I-980; and At US-101 | 2.5
5.8
|
9,722 |
35,101 |
17,228 |
-48% |
1.64 |
31% |
1.20 |
1.19 |
$23,143,890 |
| 59 | 24 |
I-10 | Lake Charles | LA | At I-210 | 9.3 |
29,022 |
158,359 |
17,063 |
-72% |
1.45 |
25% |
1.14 |
1.30 |
$9,665,120 |
| 60 | 58 |
I-95 | Baltimore | MD | I-395 to I-895 | 4.2 |
18,224 |
49,419 |
16,920 |
-53% |
1.76 |
32% |
1.32 |
1.18 |
$11,109,218 |
| 61 | 40 |
I-15 | Riverside-San Bernardino | CA | At SR-91 | 2.2 |
9,934 |
36,713 |
16,775 |
-65% |
3.13 |
129% |
1.35 |
2.42 |
$4,899,917 |
| 62 | 55 |
I-85 | Atlanta | GA | SI-75 to SR 13/141; and I-285 to SR-378 | 2.8
6.6
|
8,182 |
52,475 |
16,670 |
-56% |
4.79 |
170% |
1.74 |
2.44 |
$15,354,291 |
| 63 | - |
I-15 | Los Angeles-Long Beach-Anaheim | CA | At I-10 | 3.2 |
11,680 |
53,013 |
16,622 |
-65% |
2.69 |
107% |
1.28 |
1.89 |
$5,156,032 |
| 64 | 35 |
I-10 | Houston | TX | I-69 to I-45 | 2.1 |
17,356 |
30,461 |
16,164 |
-64% |
2.17 |
73% |
1.25 |
1.84 |
$16,242,350 |
| 65 | 38 |
I-110 | Los Angeles-Long Beach-Anaheim | CA | I-10 to SR-42 Stauson Ave. | 3.4 |
12,102 |
49,700 |
16,149 |
-50% |
3.23 |
107% |
1.49 |
2.05 |
$6,755,652 |
| 66 | 79 |
I-24/ I-40 | Nashville-Davidson | TN | I-24 to I-65 | 3.0 |
11,300 |
26,825 |
16,073 |
-53% |
2.89 |
119% |
1.32 |
2.21 |
$1,637,217 |
| 67 | 41 |
I-15 | Salt Lake City-West Valley City | UT | At I-215 (SR-173 to SR-48) | 2.4 |
45,478 |
49,192 |
15,967 |
-74% |
1.38 |
26% |
1.29 |
1.25 |
$15,490,214 |
| 68 | 25 |
I-210 | Los Angeles-Long Beach-Anaheim | CA | SR-39/164 Azusa Ave to SR-19 Rosemead Blvd | 10 |
12,464 |
114,186 |
15,682 |
-74% |
2.53 |
103% |
1.24 |
2.16 |
$22,869,600 |
| 69 | 61 |
I-215 | Riverside-San Bernardino | CA | I-10 to SR-80l | 5.9 |
11,026 |
161,553 |
15,328 |
56% |
2.44 |
74% |
1.32 |
1.37 |
$17,321,952 |
| 70 | 88 |
I-15 | Las Vegas-Henderson | NV | I-515 to Tropicana Ave | 5.5 |
18,936 |
72,397 |
15,251 |
-311% |
1.94 |
61% |
1.19 |
1.64 |
$11,710,310 |
| 71 | 48 |
I-294 | Chicago | IL | At I-290; and At I-90 | 6.1
3.9
|
30,570 |
46,549 |
15,223 |
-64% |
1.68 |
48% |
1.14 |
1.56 |
$10,821,997 |
| 72 | 95 |
I-95/ I-495 | Washington | MD | At SR-200 | 1.4 |
20,722 |
20,781 |
15,067 |
-43% |
1.27 |
16% |
1.10 |
1.11 |
$2,188,838 |
| 73 | 77 |
I-93 | Boston | MA | At I-90; and At SR-3 | 5.0;
5.5
|
10,180 |
53,981 |
14,864 |
-46% |
2.83 |
99% |
1.44 |
1.69 |
$9,853,317 |
| 74 | - |
I-580 | Concord | CA | At I-680 | 1.1 |
10,738 |
15,761 |
14,338 |
-71% |
3.32 |
152% |
1.32 |
2.57 |
$4,083,645 |
| 75 | - |
I-12 | Baton Rouge | LA | At I-10 | 3.1 |
18,918 |
44,658 |
14,285 |
-39% |
1.24 |
8% |
1.25 |
1.25 |
$3,867,734 |
| 76 | 69 |
I-376 | Pittsburgh | PA | Fort Pitt Bridge to Squirrel Hill | 4.5 |
5,108 |
22,636 |
14,043 |
-55% |
4.10 |
176% |
1.47 |
2.96 |
$1,381,546 |
| 77 | - |
I-20 | Atlanta | GA | I-285 to SR-6 | 6.0 |
11,494 |
76,838 |
12,908 |
-33% |
2.14 |
67% |
1.26 |
1.51 |
$4,689,687 |
| 78 | - |
I-820 | Dallas-Fort Worth-Arlington | TX | At I-35W | 3.0 |
7,742 |
38,359 |
12,898 |
178% |
2.83 |
88% |
1.44 |
1.38 |
$2,341,166 |
| 79 | - |
I-40 | Memphis | AR | At I-55 | 19,840 |
36,706 |
12,824 |
420% |
1.15 |
-5% |
1.20 |
1.08 |
$2,240,291 |
|
| 80 | 70 |
I-10 | Riverside-San Bernardino | CA | At I-215 | 1.6 |
13,934 |
108,455 |
12,797 |
-59% |
1.96 |
54% |
1.18 |
1.57 |
$8,266,256 |
| 81 | 81 |
I-78 | New York-Newark | NJ | US-22 to SR-440 | 5.2 |
11,644 |
16,557 |
12,509 |
-52% |
1.94 |
39% |
1.40 |
1.18 |
$3,703,807 |
| 82 | 71 |
I-84 | Waterbury | CT | At Union Street | 1.7 |
8,568 |
21,377 |
12,597 |
33% |
2.67 |
89% |
1.34 |
1.61 |
$1,304,699 |
| 83 | - |
I-39/ I-90 | Rockford | IL | I-90 to US-20 | 1.7 |
14,410 |
21,740 |
12,518 |
613% |
1.70 |
44% |
1.18 |
1.56 |
$1,326,872 |
| 84 | - |
I-70 | St. Louis | MO | I-270 to SR-94 | 4.2 |
18,230 |
51,513 |
12,403 |
-34% |
1.82 |
55% |
1.14 |
1.60 |
$4,266,608 |
| 85 | 60 |
I-270 | St. Louis | MO | I-64 to SR 100 | 3.2 |
23,506 |
61,047 |
11,897 |
-66% |
1.33 |
17% |
1.13 |
1.20 |
$14,876,697 |
| 86 | 46 |
I-90 | Chicago | IL | I-90/94 to I-294 | 6.4 |
5,588 |
29,541 |
11,894 |
-73% |
3.99 |
168% |
1.49 |
2.36 |
$5,945,087 |
| 87 | - |
I-4 | Orlando | FL | SR-423 to SR-414 | 9.9 |
12,024 |
116,538 |
11,820 |
-15% |
2.03 |
58% |
1.25 |
1.49 |
$7,112,630 |
| 88 | 99 |
I-40 | Knoxville | TN | At I-140 | 2.3 |
22,756 |
70,375 |
11,557 |
-42% |
1.47 |
31% |
1.12 |
1.36 |
$5,328,433 |
| 89 | 87 |
I-270 | Washington | MD | At I-495 | 1.5 |
18,740 |
22,906 |
11,457 |
-49% |
1.63 |
34% |
1.21 |
1.19 |
$13,506,493 |
| 90 | 47 |
I-64 | St. Louis | MO | Market St to I-70 (over Mississippi River) | 5 |
18,794 |
25,345 |
11,358 |
-73% |
1.43 |
23% |
1.16 |
1.21 |
$1,546,872 |
| 91 | 91 |
I-4 | Tampa-St. Petersburg | FL | I-275 to US 41/50th | 3.5 |
12,364 |
65,590 |
11,354 |
-47% |
2.00 |
52% |
1.24 |
1.26 |
$4,003,162 |
| 92 | 98 |
I-65 | Nashville-Davidson | TN | I-40 to I-440 | 1.9 |
9,996 |
28,438 |
11,317 |
-44% |
3.31 |
152% |
1.31 |
2.88 |
$8,004,319 |
| 93 | - |
I-225 | Denver-Aurora | CO | At Colfax Ave | 1.8 |
11,616 |
20,561 |
11,212 |
-41% |
2.34 |
90% |
1.23 |
1.91 |
$1,254,909 |
| 94 | 90 |
I-95 | Miami | FL | South of Florida Turnpike to SR 824 | 8 |
8,178 |
59,704 |
11,078 |
-49% |
3.10 |
104% |
1.47 |
1.67 |
$11,883,540 |
| 95 | 76 |
I-95 | FredericksBurg | VA | US-17 to Russell Rd | 14.5 |
20,630 |
15,603 |
11,018 |
-61% |
1.37 |
23% |
1.9 |
1.28 |
$952,295 |
| 96 | I-35 | Kansas City | KS | US-69 to US-169 | 2.1 |
13,532 |
22,739 |
10,854 |
-20% |
1.79 |
45% |
1.20 |
1.52 |
$1,387,832 |
|
| 97 | 42 |
I-15 | Murrieta-Temecula-Menifee | CA | At SR-79 | 6,444 |
68,296 |
10,836 |
-44% |
3.19 |
133% |
1.37 |
2.45 |
$4,168,328 |
|
| 98 | - |
I-20 | Dallas-Fort Worth-Arlington | TX | At SR-360 | 24,334 |
62,859 |
10,827 |
-39% |
1.42 |
26% |
1.11 |
1.26 |
$7,328,494 |
|
| 99 | - |
I-295 | New York-Newark | NY | I-495 to Cross Island Pkwy | 3.4 |
13,182 |
36,627 |
10,775 |
-38% |
1.65 |
37% |
1.18 |
1.31 |
$2,235,432 |
| 100 | - |
I-75 | Toledo | OH | At I-475 to South Ave | 3.9 |
30,210 |
42,405 |
10,753 |
25% |
1.19 |
8% |
1.10 |
1.08 |
$3,530,697 |
Information is provided in the table for the primary bottleneck corridor, the bottleneck segment with the greatest delay, and congestion costs for all congested segments with the urbanized area.
There was an overall large reduction in truck delay between 2019 and 2020 due to reduced travel during the COVID-19 global pandemic. Nationwide, there was a reduction in total truck delay on the Interstate system of 21 percent between 2019 and 2020. For the top 100 bottlenecks, which represent some of the most congested corridors in major metropolitan areas, there was reduction in total truck delay of 45 percent.
Based upon a comparison of truck hours of delay per mile, the following bottlenecks saw the greatest relative percent change (increase or decrease) in delay between 2019 and 2020. Those locations that saw an increase in delay in 2020 are mostly attributed to major construction projects and work zones along the corridors. Any changes due to capacity or operational improvements will show up in subsequent year analyses.
The following bottlenecks saw the greatest percent increase in delay from 2019. Increased delay is largely associated with major roadwork.
| Road | Urban Area | State | Increase in Delay Per Mile from 2019 | |
|---|---|---|---|---|
| Hours | Percent | |||
| I-39/I-90 | Rockford | IL | 10,762 |
613% |
| I-40 | Memphis | AR | 10,356 |
420% |
| I-820 | Dallas-Fort Worth | TX | 8,258 |
178% |
| I-80 | Rural | CA | 9,450 |
134% |
| I-35W | Dallas | TX | 13,042 |
52% |
| I-84 | Waterbury | CT | 3,148 |
33% |
| I-75 | Chattanooga | TN | 3,251 |
8% |
The following bottlenecks saw the greatest percent decrease in delay from 2019:
| Road | Urban Area | State | Decrease in Delay Per Mile from 2019 | |
|---|---|---|---|---|
| Hours | Percent | |||
| I-605 | Los Angeles | CA | (118,631) |
-85% |
| I-10 | Phoenix | AZ | (38,766) |
-80% |
| I-15 | Salt Lake City | UT | (45,367) |
-74% |
| I-210 | Los Angeles | CA | (44,732) |
-74% |
| I-64 | St. Louis | MO | (31,413) |
-73% |
| I-35 | St. Antonio | TX | (28,629) |
-73% |
| I-90 | Chicago | IL | (31,451) |
-73% |
| I-680 | San Francisco | CA | (58,060) |
-71% |
| I-40 | Albuquerque | NM | (22,682) |
-71% |
| I-580 | Concord | CA | (34,333) |
-71% |
Based upon changes to truck hours of delay per mile, the following bottlenecks saw a relative increase in delay, moving the locations to the top 100 bottlenecks, or a relative decrease in delay, dropping the locations below the top 100 bottlenecks.
The following bottlenecks were added to the list in 2020:
| Road | Urban Area | State |
|---|---|---|
| I-35 | Waco | TX |
| I-24/I-65 | Nashville-Davidson | TN |
| I-80/I-94 | Chicago | IN |
| I-80/I-294 | Chicago | IL |
| I-435 | Kansas City | MO |
| I-15 | Los Angeles-Long Beach-Anaheim | CA |
| I-580 | Concord | CA |
| I-12 | Baton Rouge | LA |
| I-20 | Atlanta | GA |
| I-820 | Dallas-Fort Worth-Arlington | TX |
| I-40 | Memphis | AR |
| I-39/I-90 | Rockford | IL |
| I-70 | St. Louis | MO |
| I-4 | Orlando | FL |
| I-225 | Denver-Aurora | CO |
| I-35 | Kansas City | KS |
| I-20 | Dallas-Fort Worth-Arlington | TX |
| I-295 | New York-Newark | NY |
| I-75 | Toledo | OH |
The following bottlenecks from 2019 dropped off the list in 2020:
| Road | Urban Area | State |
|---|---|---|
| I-20/I-59 | Birmingham | AL |
| I-10 | Phoenix | AZ |
| I-805 | San Diego | CA |
| I-238 | San Fransisco | CA |
| I-395 | Washington | DC/VA |
| I-95 | Wilmington | DE |
| I-65 | Indianapolis | IN |
| I-95 | Boston | MA |
| I-494 | Minneapolis | MN |
| I-94 | Minneapolis | MN |
| I-670 | Kansas City | MO |
| I-280 | New York | NJ |
| I-40 | Albuquerque | NM |
| I-71 | Columbus | OH |
| I-205 | Portland | OR |
| I-405 | Portland | OR |
| I-84 | Portland | OR |
| I-35 | San Antonio | TX |
| I-15 | Ogden | UT |
The following map shows the top Interstate bottlenecks in the U.S. (table 1) based on Freight Mobility Indicators of Annual Truck Hours of Delay per Mile for 2020.
Map-1. Major Freight Highway Bottlenecks Based Upon Truck Hours of Delay per Mile, 2020 NPMRDS
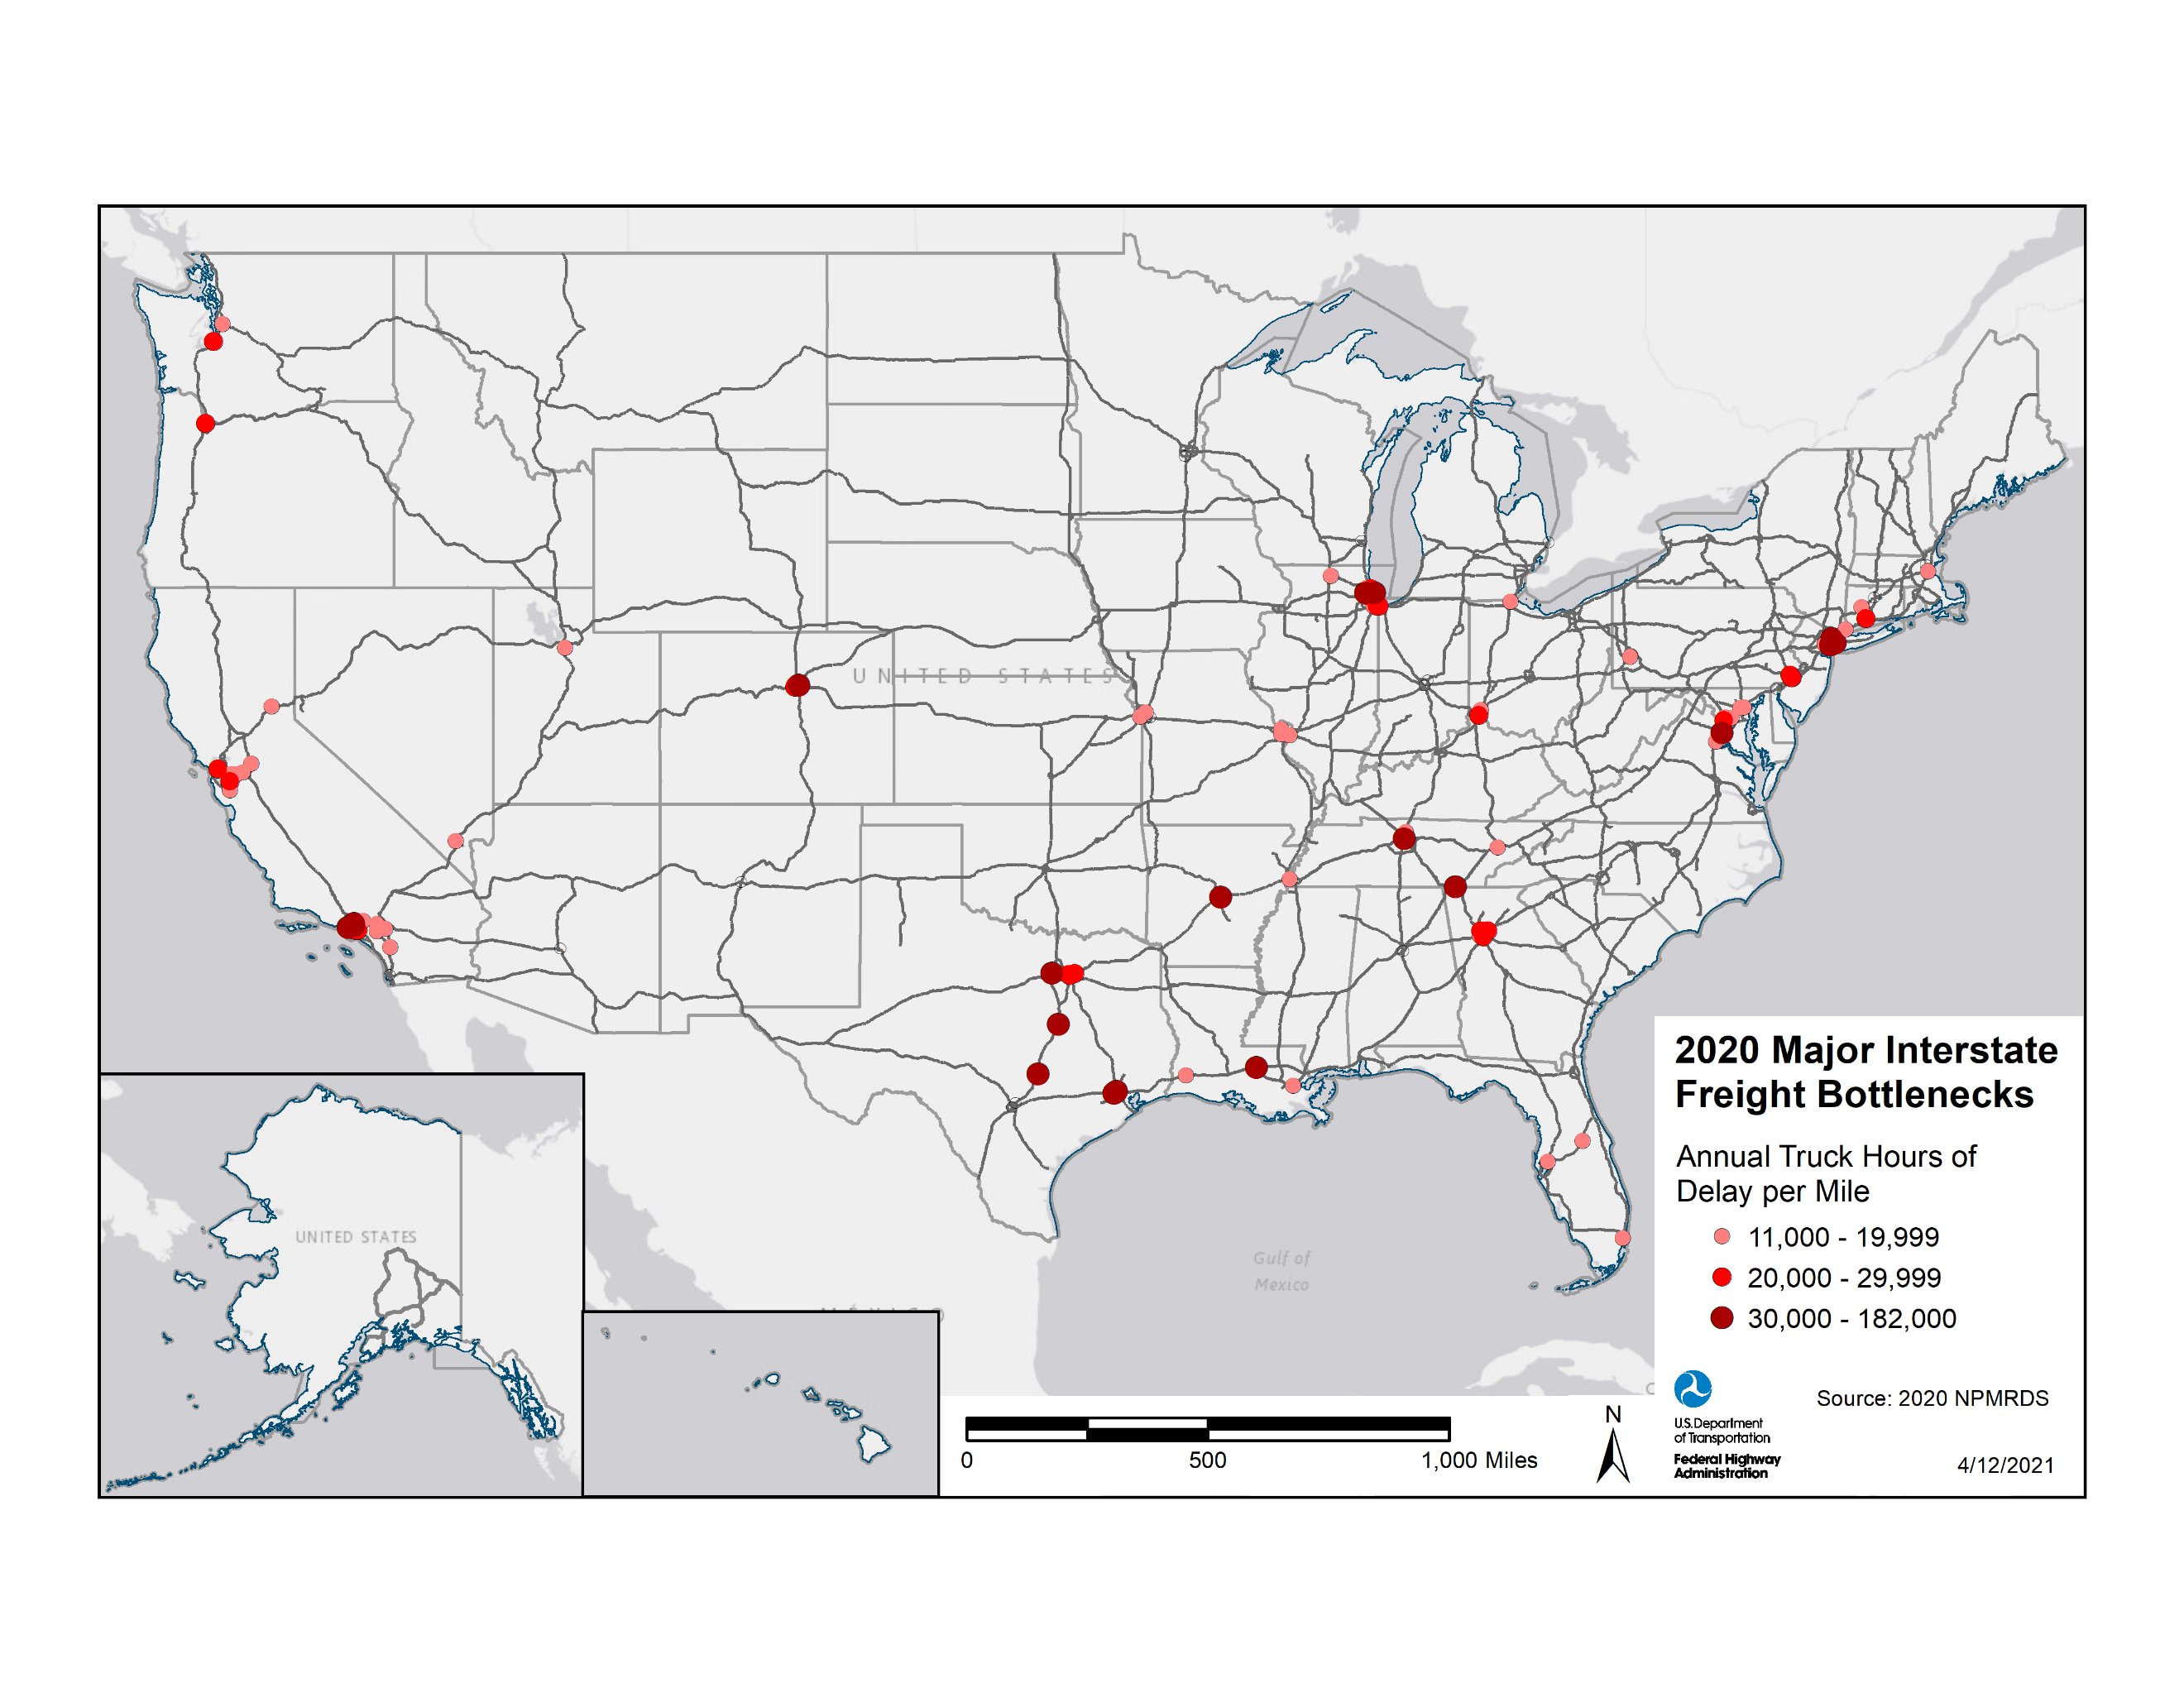
The analysis in this report uses delay per mile for assessing bottlenecks to allow for comparison over the entire Interstate system across all States. Individual State DOTs and Metropolitan Planning Organizations (MPOs) use a range of bottleneck identification methods based upon their freight plan development process and local traffic characteristics, infrastructure constraints, and impediments to efficient freight movement.
There is a range of methods for measuring congestion, delay, and reliability. Reliability is another factor that is important to the freight industry and can be measured with metrics such as the Truck Travel Time Reliability national performance measure or some of the other indices listed in Table 1.
In addition to congestion-based delay, some truck freight bottlenecks can be attributed to infrastructure restrictions that uniquely impact trucks, such as bridges with weight or clearance restrictions; steep grades; frequent adverse weather; or constraints at facilities, such as ports, intermodal rail facilities, and border crossings.
Individual State Freight Plans should be reviewed for additional information on the various types of freight bottlenecks.
|
United States Department of Transportation - Federal Highway Administration |
||