
| Skip to content |
|
|
|
National List of Major Freight Highway Bottlenecks and Congested Corridors
|
|||||||||||||||||||||||||||||||||||||||||||||||||||||||||||||||||||||||||||||||||||||||||||||||||||||||||||||||||||||||||||||||||||||||||||||||||||||||||||||||||||||||||||||||||||||||||||||||||||||||||||||||||||||||||||||||||||||||||||||||||||||||||||||||||||||||||||||||||||||||||||||||||||||||||||||||||||||||||||||||||||||||||||||||||||||||||||||||||||||||||||||||||||||||||||||||||||||||||||||||||||||||||||||||||||||||||||||||||||||||||||||||||||||||||||||||||||||||||||||||||||||||||||||||||||||||||||||||||||||||||||||||||||||||||||||||||||||||||||||||||||||||||||||||||||||||||||||||||||||||||||||||||||||||||||||||||||||||||||||||||||||||||||||||||||||||||||||||||||||||||||||||||||||||||||||||||||||||||||||||||||||||||||||||||||||||||||||||||||||||||||||||||||||||||||||||||||||||||||||||||||||||||||||||||||||||||||||||||||||||||||||||||||||||||||||||||||||||||||||||||||||||||||||||||||||||||||||||||||||||||||||||||||||||||||||||||||||||||||||||||||||||||||||||||||||||||||||||||||||||
| 2019 Rank | 2018 Rank |
Road | Urban Area | State | Generalized Bottleneck Location/Congested Corridor | Length (Miles) | AADTT (Trucks) | Delay (Hours) | Delay/ Mile | Change from 2018 | PTI | BI | TTI | TRI | Total Corridor Congestion Cost ($/year) |
|---|---|---|---|---|---|---|---|---|---|---|---|---|---|---|---|
| 1 | 1 |
I-95/I-295 | New York | NY/ NJ | I-278/I-678 to NJ side of GW Bridge/SR-4 | 8.2 |
19,110 |
336,775 |
263,116 |
4% |
10.56 |
205% |
3.47 |
1.44 |
76,000,000 |
| 2 | 3 |
I-90/I-94 | Chicago | IL | I-94N to I-55 | 10.5 |
16,006 |
257,845 |
140,942 |
-9% |
7.22 |
159% |
2.76 |
1.45 |
86,900,000 |
| 3 | 4 |
I-605 | Los Angeles | CA | I-5 to SR-60 | 6.5 |
21,926 |
365,837 |
139,777 |
11% |
4.73 |
127% |
2.07 |
1.30 |
62,500,000 |
| 4 | 2 |
I-35 | Austin | TX | Airport Blvd to Stassney Ln | 7.9 |
22,148 |
231,906 |
111,359 |
-47% |
9.93 |
298% |
2.47 |
2.51 |
109,900,000 |
| 5 | 6 |
I-610 | Houston | TX | I-69 to I-10 | 3.8 |
14,758 |
104,501 |
104,009 |
2% |
9.21 |
229% |
2.81 |
1.62 |
60,800,000 |
| 6 | 5 |
I-678 | New York | NY | I-495 to Belt Parkway and I-295/I-95 to south end Bronx-Whitestone Bridge |
5.8 2.9 |
13,020 |
134,371 |
100,237 |
-3% |
6.33 |
171% |
2.34 |
1.31 |
40,000,000 |
| 7 | 11 |
I-405 | Los Angeles | CA | At SR-73 and I-105 to SR-42 Manchester Blvd | 7.5 |
24,278 |
238,811 |
95,686 |
3% |
6.27 |
217% |
1.98 |
2.24 |
147,800,000 |
| 8 | 7 |
I-290 | Chicago | IL | I-90/I-94 to I-290 | 13.5 |
17,452 |
162,175 |
94,778 |
-6% |
5.49 |
163% |
2.03 |
1.41 |
59,700,000 |
| 9 | 8 |
I-69/ US-59 |
Houston | TX | Buffalo Speedway to I-45 | 4.4 |
13,662 |
187,114 |
89,185 |
-7% |
7.19 |
205% |
2.32 |
1.84 |
57,800,000 |
| 10 | 12 |
I-278 | New York | NY | I-95/I-678 to Grand Central Pkwy. and SR-27 Prospect Expy. to SR-29 Queens Blvd. |
7.7 9.2 |
13,214 |
708,920 |
88,339 |
2% |
6.03 |
164% |
2.24 |
1.55 |
147,000,000 |
| 11 | 9 |
I-24 | Nashville | TN | US-41 to SR-155 | 5.8 |
25,550 |
122,135 |
86,920 |
-7% |
5.05 |
179% |
1.80 |
1.72 |
52,200,000 |
| 12 | 10 |
I-10 | Los Angeles | CA | 20th Street to I-5 And at I-605 |
15.3 6.0 |
14,072 |
217,248 |
86,745 |
-7% |
7.26 |
162% |
2.74 |
1.50 |
164,100,000 |
| 13 | 15 |
I-710 | Los Angeles | CA | Cesar Chavez Ave. to Atlantic Blvd. | 3.0 |
13,666 |
117,160 |
85,730 |
19% |
7.38 |
240% |
2.12 |
2.02 |
47,500,000 |
| 14 | 23 |
I-45 | Houston | TX | US-90 to I-69 | 3.5 |
14,368 |
137,629 |
84,471 |
37% |
5.78 |
143% |
2.34 |
1.54 |
58,800,000 |
| 15 | 17 |
I-680 | San Francisco | CA | SR-262 to SR-238 | 4.3 |
12,812 |
215,782 |
81,240 |
15% |
8.73 |
268% |
2.36 |
2.09 |
14,000,000 |
| 16 | 25 |
I-495 | New York | NY | Little Neck Parkway to Queens Midtown Tunnel | 14.3 |
17,976 |
256,729 |
70,916 |
16% |
4.33 |
139% |
1.74 |
1.81 |
112,400,000 |
| 17 | 21 |
I-5 | Seattle | WA | SR-16 to SR-18 and I-90 to 85th St |
9.6 7.1 |
13,752 |
139,061 |
69,732 |
6% |
6.43 |
194% |
2.21 |
1.66 |
62,500,000 |
| 18 | 14 |
I-5 | Los Angeles | CA | SR-134 Ventura Fwy. to I-605 | 19.8 |
14,194 |
164,580 |
68,560 |
-15% |
6.80 |
224% |
2.10 |
2.01 |
123,200,000 |
| 19 | 20 |
I-76 | Philadelphia | PA | University Ave to US-1 | 6.2 |
9,210 |
82,470 |
67,019 |
2% |
7.94 |
214% |
2.52 |
1.79 |
37,500,000 |
| 20 | 19 |
I-87 | New York | NY | I-278 to 230th Street | 5.9 |
9,800 |
166,565 |
64,891 |
-2% |
7.54 |
218% |
2.35 |
1.99 |
25,100,000 |
| 21 | 27 |
I-105 | Los Angeles | CA | I-405 to SR-19 | 13.7 |
14,794 |
131,310 |
64,807 |
8% |
4.54 |
112% |
2.02 |
1.34 |
56,800,000 |
| 22 | 22 |
I-75/ I-85 |
Atlanta | GA | I-20 to I-75/I-85 split | 4.2 |
14,710 |
43,279 |
63,432 |
0% |
5.53 |
172% |
2.03 |
1.52 |
19,300,000 |
23 |
34 |
I-10 | New Orleans | LA | I-610 to Pontchartrain Expy. | 3.7 |
28,358 |
567,191 |
61,114 |
12% |
4.12 |
154% |
1.43 |
3.60 |
73,000,000 |
24 |
73 |
I-10 | Lake Charles | LA | At I-210 | 9.3 |
28,358 |
567,191 |
61,114 |
93% |
4.12 |
154% |
1.43 |
4.00 |
31,500,000 |
| 25 | 26 |
I-210 | Los Angeles | CA | SR-39/164 Azusa Ave to SR-19 Rosemead Blvd | 10.0 |
20,014 |
155,249 |
60,414 |
0% |
3.72 |
120% |
1.68 |
1.35 |
67,600,000 |
| 26 | 18 |
I-10 | Baton Rouge | LA | I-110 to SR-1 | 2.2 |
21,436 |
124,256 |
57,724 |
-16% |
5.10 |
235% |
1.52 |
3.97 |
33,800,000 |
| 27 | 32 |
I-25 | Denver | CO | I-70 to University Blvd | 8.7 |
14,060 |
91,776 |
55,696 |
-3% |
5.00 |
166% |
1.88 |
1.72 |
54,200,000 |
| 28 | 29 |
I-5 | Portland | OR | Columbia River to Terwilliger Blvd | 10.5 |
15,976 |
156,900 |
55,154 |
-7% |
5.17 |
177% |
1.81 |
1.95 |
53,100,000 |
| 29 | 31 |
I-55 | Chicago | IL | I-94 to SR-171 | 10.0 |
14,752 |
308,860 |
53,860 |
-6% |
4.67 |
160% |
1.76 |
1.68 |
58,300,000 |
| 30 | 37 |
I-285 | Atlanta | GA | East/ SR-400 to US-78 and West/ I-20 to Northside Dr |
11.7 11.2 |
23,710 |
87,447 |
53,821 |
7% |
3.43 |
128% |
1.51 |
1.58 |
137,500,000 |
| 31 | 46 |
I-495 | Washington | MD/ VA |
I-66 (VA) to I-95 (MD) | 19.5 |
19,088 |
278,191 |
53,507 |
18% |
3.81 |
141% |
1.55 |
1.78 |
93,900,000 |
| 32 | 33 |
I-70 | Denver | CO | I-25 to I-270 | 4.8 |
11,946 |
125,104 |
53,461 |
-4% |
4.61 |
148% |
1.85 |
1.50 |
26,700,000 |
| 33 | 55 |
I-30 | Little Rock | AR | At I-630 | 1.9 |
39,640 |
97,397 |
51,924 |
28% |
2.32 |
84% |
1.24 |
1.86 |
11,700,000 |
| 34 | 35 |
I-80/ I-580 |
San Francisco | CA | US-101 to University Ave | 10.7 |
5,474 |
90,562 |
51,110 |
-2% |
9.15 |
199% |
2.97 |
1.37 |
35,200,000 |
| 35 | 39 |
I-10 | Houston | TX | I-69 to I-45 | 2.1 |
18,170 |
94,429 |
50,107 |
1% |
4.92 |
189% |
1.67 |
2.00 |
53,700,000 |
| 36 | 40 |
I-270 | Denver | CO | I-25 to I-70 | 5.8 |
10,728 |
160,467 |
50,104 |
1% |
5.33 |
175% |
1.92 |
1.82 |
14,500,000 |
| 37 | 47 |
I-95 | Washington | VA | SR-123 to SR-286 | 6.3 |
16,184 |
337,261 |
49,241 |
10% |
4.40 |
153% |
1.71 |
1.69 |
49,800,000 |
| 38 | 24 |
I-110/ CA-110 |
Los Angeles | CA | I-10 to SR-42 Stauson Ave. | 3.4 |
7,780 |
98,619 |
48,762 |
-21% |
7.65 |
173% |
2.77 |
1.96 |
23,100,000 |
| 39 | 36 |
I-10 | Phoenix | AZ | At I-17 from 51st Ave to SR-143 | 13.9 |
23,436 |
160,526 |
48,254 |
-6% |
3.41 |
134% |
1.45 |
1.92 |
91,200,000 |
| 40 | 45 |
I-15 | Riverside | CA | At SR-91 | 2.2 |
10,534 |
105,431 |
48,175 |
5% |
6.08 |
228% |
1.86 |
2.17 |
18,600,000 |
| 41 | 30 |
I-15 | Salt Lake City | UT | At I-215 (SR-173 to SR-48) | 2.4 |
65,670 |
146,145 |
47,435 |
5% |
1.74 |
46% |
1.18 |
1.27 |
62,139,000 |
| 42 | 44 |
I-15 | Los Angeles | CA | At I-10 | 3.2 |
18,198 |
150,438 |
47,170 |
0% |
3.71 |
144% |
1.49 |
2.24 |
12,700,000 |
| 43 | 59 |
I-80/ I-94 |
Chicago | IL | I-294 to I-94 | 4.8 |
41,800 |
162,559 |
46,615 |
23% |
3.00 |
133% |
1.28 |
2.64 |
9,100,000 |
| 44 | 50 |
I-695 | Baltimore | MD | I-95 to I-795 | 10.1 |
20,994 |
48,956 |
46,428 |
9% |
3.48 |
146% |
1.41 |
2.36 |
45,400,000 |
| 45 | 57 |
I-71/ I-75 |
Cincinnati | KY/ OH |
I-275 to Western Hills | 9.2 |
30,594 |
58,663 |
44,603 |
12% |
2.28 |
64% |
1.37 |
1.19 |
18,300,000 |
| 46 | 81 |
I-90 | Chicago | IL | I-90/94 to I-294 | 6.7 |
7,190 |
107,654 |
43,345 |
53% |
6.39 |
161% |
2.45 |
1.35 |
32,300,000 |
| 47 | 51 |
I-64 | St. Louis | MO | Market St to I-70 (over Mississippi River) | 5.0 |
18,480 |
95,442 |
42,771 |
3% |
4.08 |
165% |
1.53 |
2.16 |
9,100,000 |
| 48 | 28 |
I-294 | Chicago | IL | At I-290 and At I-90 |
6.1 3.9 |
18,898 |
117,655 |
42,295 |
-29% |
3.80 |
156% |
1.45 |
2.14 |
40,900,000 |
| 49 | 61 |
I-405 | Seattle | WA | I-90 to SR-520 | 3.7 |
9,592 |
181,650 |
40,760 |
10% |
6.25 |
228% |
1.88 |
2.63 |
12,800,000 |
| 50 | 127 |
I-75 | Chattanooga | TN | At I-24 | 1.6 |
23,596 |
63,454 |
40,747 |
116% |
3.38 |
129% |
1.43 |
1.68 |
6,000,000 |
| 51 | 65 |
I-676 | Philadelphia | PA | I-76 to I-95 | 2.2 |
7,390 |
66,004 |
40,448 |
13% |
5.92 |
181% |
2.07 |
1.86 |
7,300,000 |
| 52 | 56 |
I-238 | San Francisco | CA | I-880 to I-580 | 2.1 |
18,052 |
82,338 |
40,088 |
0% |
3.13 |
93% |
1.55 |
1.27 |
4,600,000 |
| 53 | 64 |
I-35 | San Antonio | TX | At I-10 | 3.0 |
27,030 |
39,992 |
39,338 |
8% |
1.66 |
37% |
1.21 |
1.50 |
24,300,000 |
| 54 | 53 |
I-494 | Minneapolis | MN | SR-77 to W Bush Lake Rd | 6.6 |
12,284 |
78,992 |
38,514 |
-7% |
5.37 |
189% |
1.86 |
1.82 |
9,000,000 |
| 55 | 58 |
I-85 | Atlanta | GA | I-75 to SR 13/141 and I-285 to SR-378 | 2.8; 6.6 |
17,078 |
163,020 |
37,663 |
-4% |
3.76 |
151% |
1.48 |
1.83 |
35,700,000 |
| 56 | 48 |
I-35E | Dallas | TX | I-30 to Market Center Blvd. | 2.8 |
15,572 |
90,016 |
37,601 |
-15% |
3.46 |
124% |
1.54 |
1.87 |
24,900,000 |
| 57 | 54 |
I-635 | Dallas | TX | I-35 to SR-78 | 14.0 |
20,228 |
67,349 |
37,059 |
-9% |
2.43 |
66% |
1.45 |
1.23 |
61,400,000 |
| 58 | 42 |
I-95 | Baltimore | MD | I-395 to I-895 | 8.1 |
18,962 |
37,591 |
36,203 |
-24% |
2.36 |
75% |
1.32 |
1.67 |
34,900,000 |
| 59 | 79 |
I-95 | Philadelphia | PA | At I-676 | 2.0 |
10,170 |
64,693 |
35,789 |
16% |
3.25 |
87% |
1.71 |
1.26 |
11,900,000 |
| 60 | 67 |
I-270 | St. Louis | MO | I-64 to SR 100 | 3.5 |
35,200 |
111,888 |
35,500 |
3% |
2.24 |
85% |
1.21 |
1.91 |
28,200,000 |
| 61 | 63 |
I-215 | Riverside | CA | I-10 to SR-80 | 5.9 |
14,482 |
180,876 |
35,057 |
-4% |
3.52 |
115% |
1.51 |
1.47 |
35,300,000 |
| 62 | 38 |
I-75 | Cincinnati | OH | SR-562 to SR-126 | 3.0 |
22,350 |
26,881 |
34,492 |
-31% |
3.94 |
156% |
1.54 |
1.58 |
29,500,000 |
| 63 | 52 |
I-94 | Chicago | IL | I-90/94 to US-14 | 2.3 |
16,000 |
113,471 |
33,752 |
-19% |
3.52 |
138% |
1.47 |
1.66 |
12,900,000 |
| 64 | 74 |
I-880 | San Francisco | CA | At I-980 and At US-101 |
2.5; 5.8 |
12,070 |
212,423 |
32,983 |
3% |
3.99 |
145% |
1.61 |
1.63 |
55,800,000 |
| 65 | 70 |
I-24 | Chattanooga | TN | I-75 to US-41 | 3.5 |
22,266 |
34,046 |
32,057 |
-3% |
3.18 |
145% |
1.30 |
2.86 |
18,500,000 |
| 66 | 100 |
I-40 | Albuquerque | NM | At I-25 | 1.7 |
28,886 |
52,481 |
31,823 |
37% |
2.13 |
63% |
1.30 |
1.88 |
9,700,000 |
| 67 | 72 |
I-805 | San Diego | CA | SR-52 to SR-163 | 2.5 |
12,420 |
80,062 |
31,791 |
-2% |
5.62 |
242% |
1.62 |
3.96 |
13,900,000 |
| 68 | 60 |
I-30 | Dallas | TX | I-35 to Grand Ave. | 4.0 |
18,622 |
54,192 |
31,390 |
-15% |
3.53 |
134% |
1.43 |
1.81 |
14,300,000 |
| 69 | 84 |
I-376 | Pittsburgh | PA | Fort Pitt Bridge to Squirrel Hill | 4.5 |
5,182 |
50,528 |
31,346 |
13% |
6.64 |
235% |
2.00 |
2.51 |
2,800,000 |
| 70 | 78 |
I-10 | Riverside | CA | At I-215 | 1.6 |
23,010 |
49,901 |
31,196 |
1% |
2.62 |
102% |
1.26 |
2.12 |
17,300,000 |
| 71 | 75 |
I-84 | Hartford | CT | SR-2 to Prospect Ave | 4.0 |
11,584 |
123,868 |
29,849 |
-6% |
3.77 |
144% |
1.52 |
2.14 |
7,700,000 |
| 72 | 73 |
I-405 | Portland | OR | I-5 to US-26 | 2.3 |
8,594 |
22,135 |
29,467 |
-9% |
6.31 |
213% |
1.97 |
2.13 |
1,200,000 |
| 73 | 86 |
I-95 | Wilmington | DE | At I-295/I-495 | 3.7 |
24,278 |
48,048 |
28,402 |
6% |
3.05 |
138% |
1.29 |
2.67 |
2,700,000 |
| 74 | 43 |
I-94 | Minneapolis | MN | SR-280 to Hennepin Ave | 4.5 |
8,700 |
31,602 |
28,016 |
-41% |
4.07 |
117% |
1.87 |
1.37 |
4,400,000 |
| 75 | 80 |
I-205 | Portland | OR | At I-84 | 3.6 |
10,580 |
127,148 |
27,951 |
-6% |
4.10 |
171% |
1.50 |
2.64 |
7,100,000 |
| 76 | 82 |
I-95 | Fredericksburg | VA | US-17 to Russell Rd | 14.5 |
19,778 |
217,884 |
27,933 |
-1% |
2.97 |
118% |
1.36 |
1.59 |
20,000,000 |
| 77 | 96 |
I-93 | Boston | MA | At I-90 and At SR-3 |
5.0; 5.5 |
8,762 |
99,456 |
27,386 |
12% |
3.58 |
102% |
1.75 |
1.38 |
19,600,000 |
| 78 | 85 |
I-95 | Bridgeport | CT | At US-1 in Fairfield and At US-1 in Stamford |
1.5; 1.8 |
11,786 |
49,655 |
27,289 |
-2% |
4.26 |
155% |
1.63 |
1.77 |
51,000,000 |
| 79 | 71 |
I-40 | Nashville | TN | I-24 to I-65 | 3.0 |
10,758 |
40,849 |
27,148 |
-17% |
3.95 |
162% |
1.48 |
2.42 |
4,100,000 |
| 80 | 87 |
I-95 | New Haven | CT | I-91 to SR-10 | 1.8 |
12,094 |
48,954 |
26,805 |
1% |
4.26 |
177% |
1.53 |
2.73 |
2,700,000 |
| 81 | 94 |
I-78 | New York | NJ | US-22 to SR-440 | 5.0 |
12,166 |
34,185 |
26,033 |
4% |
3.85 |
105% |
1.86 |
1.48 |
6,700,000 |
| 82 | 98 |
I-35W | Dallas | TX | At I-30 | 1.2 |
10,852 |
46,490 |
24,953 |
5% |
3.55 |
116% |
1.64 |
1.45 |
11,900,000 |
| 83 | 68 |
I-15 | Ogden | UT | SR-232 to SR-273 | 2.0 |
20,606 |
66,654 |
24,114 |
27% |
2.62 |
108% |
1.25 |
2.21 |
5,995,000 |
| 84 | 88 |
I-75 | Atlanta | GA | I-85 to Moores Mill Rd | 3.3 |
16,806 |
29,466 |
23,791 |
-9% |
3.66 |
176% |
1.32 |
3.30 |
6,300,000 |
| 85 | 155 |
I-65 | Indianapolis | IN | I-70 N to Fall Creek Blvd | 2.2 |
13,802 |
27,140 |
23,639 |
120% |
1.69 |
45% |
1.16 |
1.46 |
1,500,000 |
| 86 | 140 |
I-20/I-59 | Birmingham | AL | At I-65 | 2.0 |
14,870 |
45,814 |
23,124 |
34% |
1.40 |
21% |
1.16 |
2.14 |
2,500,000 |
| 87 | 119 |
I-270 | Washington | MD | At I-495 | 1.5 |
13,602 |
32,657 |
22,345 |
9% |
3.24 |
139% |
1.35 |
2.59 |
26,400,000 |
| 88 | 16 |
I-15 | Las Vegas | NV | I-515 to Tropicana Ave | 5.5 |
13,322 |
105,126 |
22,146 |
-69% |
2.86 |
104% |
1.39 |
1.75 |
17,000,000 |
| 89 | 111 |
I-280 | New York | NJ | Garden State Pkwy to SR-21 | 2.4 |
8,900 |
52,373 |
22,029 |
4% |
4.12 |
138% |
1.59 |
1.96 |
2,900,000 |
| 90 | 94 |
I-95 | Miami | FL | Florida Turnpike to I-395 | 9.5 |
9,490 |
117,996 |
21,894 |
-12% |
4.01 |
119% |
1.79 |
1.62 |
29,400,000 |
| 91 | 97 |
I-4 | Tampa | FL | I-275 to 36th St | 5.8 |
13,116 |
124,896 |
21,620 |
-11% |
2.81 |
87% |
1.41 |
1.53 |
6,900,000 |
| 92 | 110 |
I-670 | Kansas City | MO | At I-70 | 1.1 |
8,716 |
22,474 |
21,163 |
0% |
3.99 |
168% |
1.48 |
2.68 |
1,200,000 |
| 93 | 89 |
I-395 | Washington | DC/ VA |
US-50 to VA-236 | 10.4 |
10,408 |
12,903 |
21,150 |
-19% |
5.25 |
159% |
2.03 |
1.62 |
700,000 |
| 94 | 112 |
I-580 | Livermore | CA | I-205 to First Street | 7.1 |
14,306 |
148,916 |
20,960 |
0% |
2.65 |
96% |
1.31 |
1.82 |
8,300,000 |
| 95 | 109 |
I-95 | Washington | MD | I-495 to SR-200 | 4.6 |
21,322 |
113,022 |
20,807 |
-3% |
2.26 |
77% |
1.24 |
1.61 |
6,300,000 |
| 96 | 124 |
I-95 | Boston | MA | SR-38 to I-93 | 2.5 |
8,114 |
80,374 |
20,726 |
5% |
4.27 |
174% |
1.56 |
2.46 |
8,600,000 |
| 97 | 103 |
I-84 | Portland | OR | At I-5 | 1.7 |
9,086 |
34,768 |
20,359 |
-9% |
2.78 |
86% |
1.49 |
1.34 |
3,400,000 |
| 98 | 90 |
I-65 | Nashville | TN | I-40 to I-440 | 1.9 |
21,904 |
37,827 |
20,093 |
-22% |
2.00 |
54% |
1.22 |
1.71 |
13,500,000 |
| 99 | 114 |
I-40 | Knoxville | TN | I-75/I-640 to I-275 | 2.3 |
16,692 |
45,684 |
20,059 |
-3% |
2.65 |
109% |
1.25 |
2.32 |
2,500,000 |
| 100 | 115 |
I-71 | Columbus | OH | At I-670 | 4.5 |
15,194 |
88,459 |
19,511 |
-5% |
2.46 |
93% |
1.25 |
1.96 |
7,300,000 |
Generalized Bottleneck Location/Congested Corridor and Length: Extent of congestion for corridor caused by one or more bottlenecks, estimated based upon review of corridor congestion scans in the NPMRDS. For major congested corridors, this may include multiple contiguous bottlenecks.
Annual Average Daily Truck Traffic (AADTT) (Trucks): NPMRDS (single unit and combination) trucks conflated from Highway Performance Monitoring System (HPMS).
Annual Truck Hours of Delay/Mile: Difference between actual travel time and reference travel time ("free-flow" travel time), multiplied by truck volumes, then divided by the segment length. For larger bottlenecks that span multiple roadway segments, delay is provided for the most congested segment and direction of the bottleneck, not the full corridor.
Planning time index (PTI): Ratio of the 95th percentile travel time to the reference travel time ("free-flow" travel time), computed during the AM and PM peak periods.
Buffer index (BI): Represents the extra time (or time cushion) that travelers must add to their average travel time when planning trips to ensure on-time arrival.
Travel time index (TTI): Ratio of the peak-period travel time to the reference travel time ("free-flow" travel time), computed for the AM and PM peak periods.
Travel Reliability Index (TRI): Calculated the same as the MAP-21 performance measure for Truck Travel Time Reliability (TTTR), as the ratio of the 95th percentile travel time to the 50th percentile travel time during five different time periods of the day. Results will differ from the NPMRDS TTTR due to differences in route segmentation.
Total Corridor Congestion Cost ($/year): Calculated for the full extent of delay along the congested corridor as a function of both the time and fuel used while the truck is in congested traffic, factoring costs of personnel, commercial vehicle operation, and wasted fuel. For major bottlenecks with long congestion queues, this will include multiple roadway segments. For major congested corridors, the congestion cost will include the full cost of congestion along the corridor through the entire urban area, which may include multiple bottlenecks.
Based upon a comparison of truck hours of delay per mile, the following bottlenecks saw the greatest relative percent change (increase or decrease) in delay between 2018 and 2019. In many cases, major increases in delay from one year to the next can be attributed to major construction projects/work zones along the corridors. Any changes due to capacity or operational improvements will show up in subsequent year analyses.
The following bottlenecks saw the greatest percent increase in delay from 2018:
| Road | Urban Area | State | Increase in Delay Per Mile from 2018 | |
|---|---|---|---|---|
| Hours | Percent | |||
| I-65 | Indianapolis | IN | 12,895 |
120% |
| I-75 | Chattanooga | TN | 21,861 |
116% |
| I-10 | Lake Charles | LA | 29,486 |
93% |
| I-90 | Chicago | IL | 14,948 |
53% |
| I-45 | Houston | TX | 22,875 |
37% |
| I-40 | Albuquerque | NM | 8,515 |
37% |
| I-20/I-59 | Birmingham | AL | 5,815 |
34% |
| I-30 | Little Rock | AR | 11,237 |
28% |
| I-15 | Ogden | UT | 5,140 |
27% |
| I-80/I-94 | Chicago | IL | 8,721 |
23% |
The following bottlenecks saw the greatest percent decrease in delay from 2018:
| Road | Urban Area | State | Decrease in Delay Per Mile from 2018 | |
|---|---|---|---|---|
| Hours | Percent | |||
| I-696 | Detroit | MI | -71,875 |
-86% |
| I-90 | Seattle | WA | -22,581 |
-72% |
| I-15 | Las Vegas | NV | -48,774 |
-69% |
| I-94 | Detroit | MI | -20,605 |
-60% |
| I-45 | Dallas | TX | 19,467 |
-55% |
| I-35W | Minneapolis | MN | -19,553 |
-53% |
| I-35 | Austin | TX | -97,558 |
-47% |
| I-77 | Charlotte | NC | -12,676 |
45% |
| I-43 | Milwaukee | WI | -10,509 |
-43% |
| I-94 | Minneapolis | MN | -19,264 |
-41% |
Based upon changes to truck hours of delay per mile, the following bottlenecks saw a relative increase in delay, moving the locations to the top 100 bottlenecks, or a relative decrease in delay, dropping the locations below the top 100 bottlenecks.
The following bottlenecks were added to the list in 2019:
| Road | Urban Area | State |
|---|---|---|
| I-20/I-59 | Birmingham | AL |
| I-580 | Livermore | CA |
| I-65 | Indianapolis | IN |
| I-95 | Boston | MA |
| I-270 | Washington | MD |
| I-95 | Washington | MD |
| I-670 | Kansas City | MO |
| I-280 | Newark/New York | NJ |
| I-75 | Chattanooga | TN |
| I-40 | Knoxville | TN |
| I-15 | Ogden | UT |
The following bottlenecks from 2018 dropped off the list in 2019:
| Road | Urban Area | State |
|---|---|---|
| I-95 | Jacksonville | FL |
| I-275 | Tampa | FL |
| I-696 | Detroit | MI |
| I-94 | Detroit | MI |
| I-35W | Minneapolis | MN |
| I-77 | Charlotte | NC |
| I-85 | Greenville | SC |
| I-45 | Dallas | TX |
| I-64 | Virginia Beach | VA |
| I-90 | Seattle | WA |
| I-94 | Milwaukee | WI |
The following map shows the top Interstate bottlenecks in the U.S. (table 1) based on Freight Mobility Indicators of Annual Truck Hours of Delay per Mile for 2019.
Map-1. Major Freight Highway Bottlenecks Based Upon Truck Hours of Delay per Mile, 2019 NPMRDS
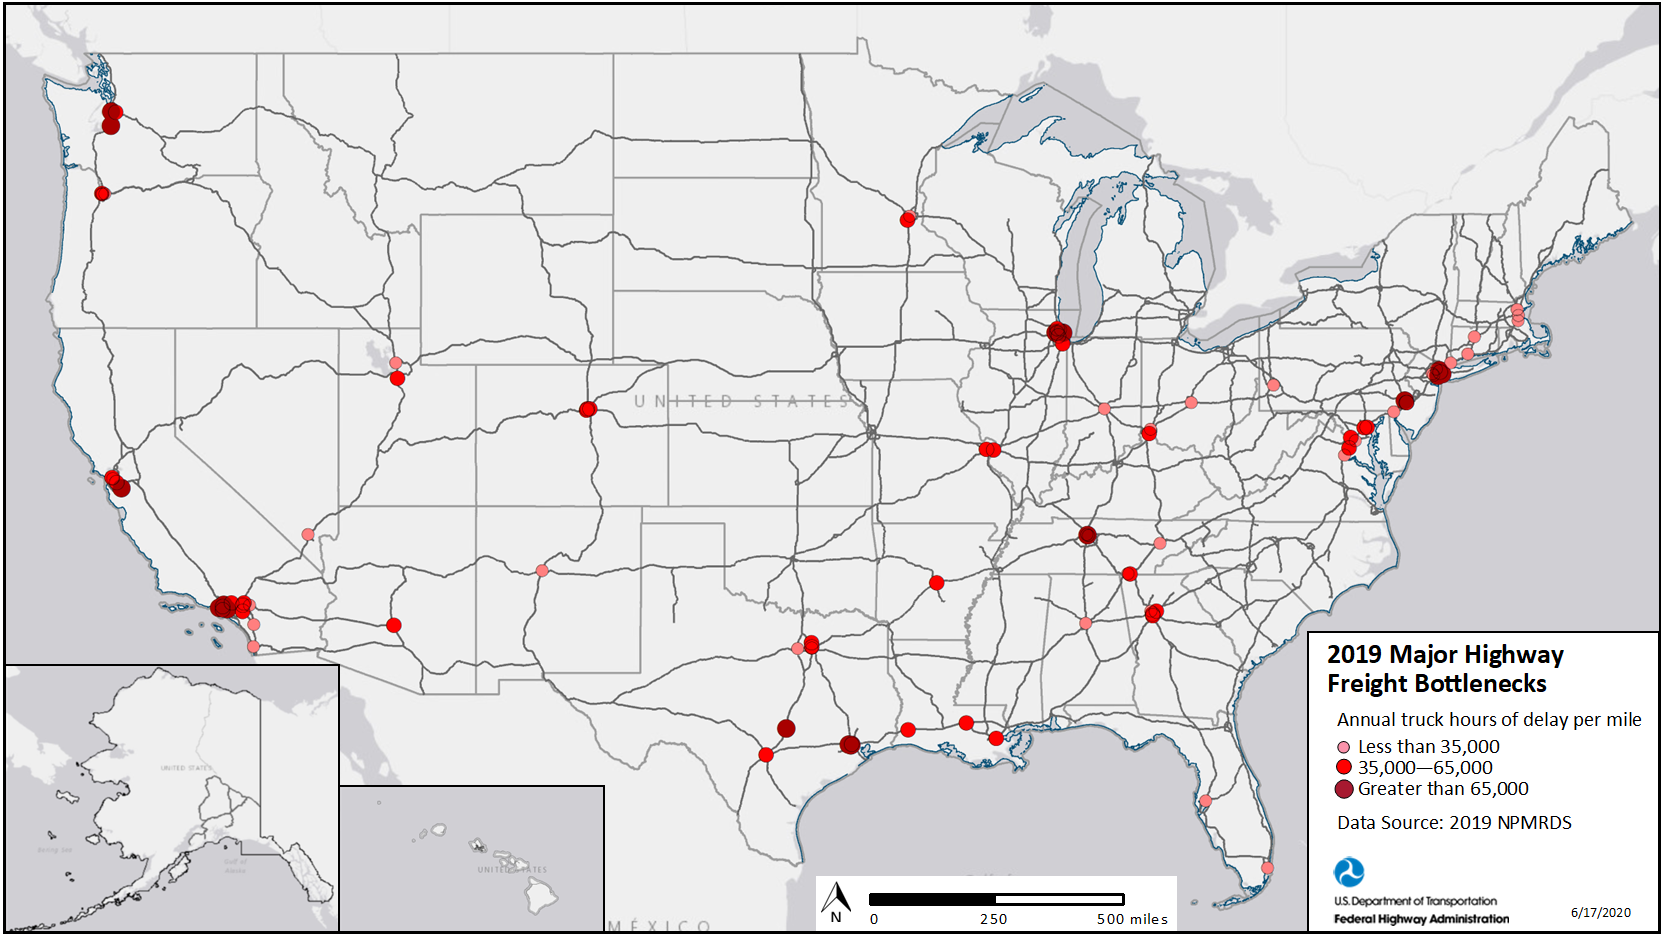
The analysis in this report uses delay per mile for assessing bottlenecks to allow for comparison over the entire Interstate system across all States. Individual State DOTs and Metropolitan Planning Organizations (MPOs) use a range of bottleneck identification methods based upon their freight plan development process and local traffic characteristics, infrastructure constraints, and impediments to efficient freight movement.
There are a range of methods for measuring congestion, delay, and reliability. Reliability is another factor that is important to the freight industry. In addition to congestion-based delay, some truck freight bottlenecks can be attributed to infrastructure restrictions that uniquely impact trucks such as bridges with weight or clearance restrictions, steep grades, frequent adverse weather, or constraints at facilities, such as ports, intermodal rail facilities, and border crossings.
|
United States Department of Transportation - Federal Highway Administration |
||