Ohio DOT Crash Analysis Presentation
Slide 01
Work Zone Safety & Mobility
Excerpts from a presentation given at the Montana Regional Work Zone Rule Workshop in April 2006.
Dave Holstein
ODOT Office of Traffic Engineering
614-644-8137
Slide 02
Linking Safety and Congestion
In Ohio
- 43% of all Interstate crashes happen on 12% of the Interstate system.
- 19% of all NON Interstate crashes happen on 2% of the NON Interstate system.
- When overlaid against Ohio’s congested locations the 12% (IR) and 2% (NON IR) are an almost exact match to the congested locations.
- Congestion causes crashes
Slide 03
Linking Safety and Congestion
- Historical WZ crash analysis in Ohio shows that congested work zones CAUSE CRASHES.
- Much of ODOT’s WZ processes revolve around identifying work zone capacity needs and determining constraints to providing that necessary capacity.
Slide 04
Why Maintenance of Traffic (MOT) is Important in Ohio
- 35th in geographical size
- 10th largest highway network
- 5th highest volume of traffic
- 5th highest volume of truck traffic
- 4th largest interstate network
- 2002 NCAA Football Champions
Slide 05
Why MOT is Important in Ohio
- Need to comply with the new Federal Regulations on Work Zone Safety and Mobility (23 CFR 630 –Subpart J)
- October 2007 Deadline
Slide 06
Why MOT is Important in Ohio
Because We Can Make a Difference
Slide 07
Why MOT is Important in Ohio
- In addition to mobility, safety, and economic reasons for good work zone processes……………
- Our Governor got REALLY mad when he was stopped in a work zone!!
Slide 08
ODOT’s WZ Process in Terms of the New Federal WZ Regulations
Historical WZ Crash Data
- 630.1008 State Level Processes and Procedures
- “Shall use field observations, wz crash data….”
- “Shall continually pursue improvement of wz safety and mobility by analyzing work zone crash and operational data from multiple projects….”
Slide 09
ODOT’s WZ Process in Terms of the New Federal WZ Regulations
Historical Crash Analysis
- Why did we do the analysis?
- ODOT is embarking on the largest construction program(s) in our history
- Director was concerned about the impact our work zones will have on crashes
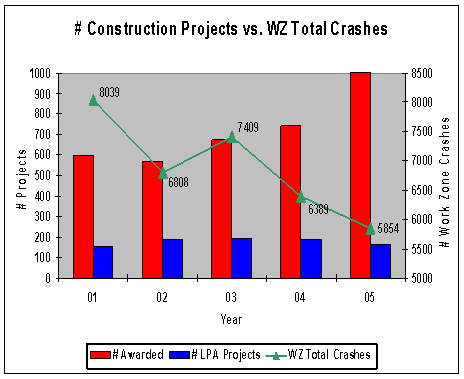
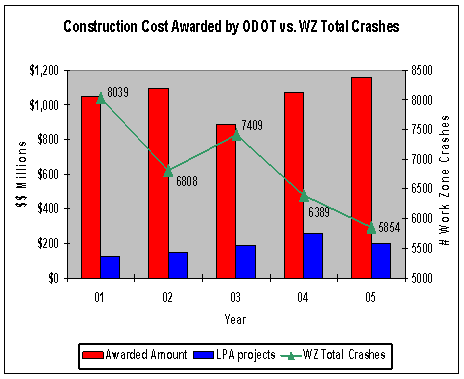
- Question - Are the ODOT work zones causing more accidents?
- If so, can we do more to limit the increase?
Slide 10
ODOT’s WZ Process in Terms of the New Federal WZ Regulations
Historical Crash Analysis
THE KNEE JERK REACTION
- “Well of course we have more crashes in work zones. Narrow lanes, barriers next to lanes, and on… and on…. and on….”
- Historical crash data analysis showed there were things we could do better!!
Slide 11
ODOT’s WZ Process in Terms of the New Federal WZ Regulations
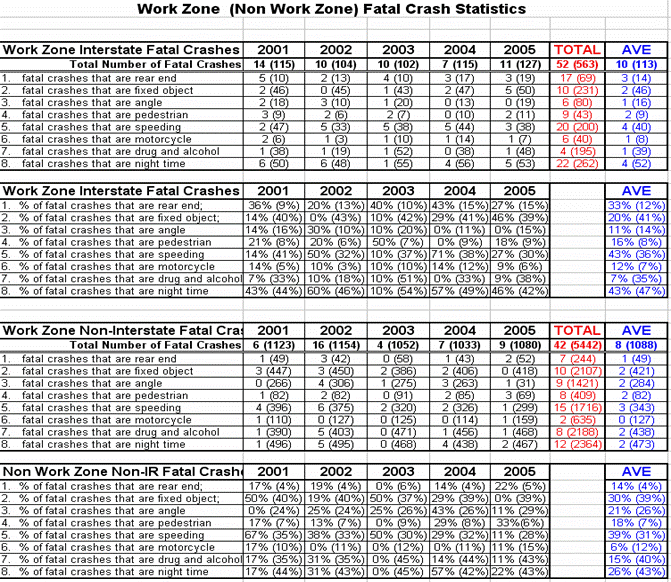
Historical Crash Analysis
Slide 12
ODOT’s WZ Process in Terms of the New Federal WZ Regulations
Historical Crash Analysis
Slide 13
ODOT’s WZ Process in Terms of the New Federal WZ Regulations
Historical Crash Analysis
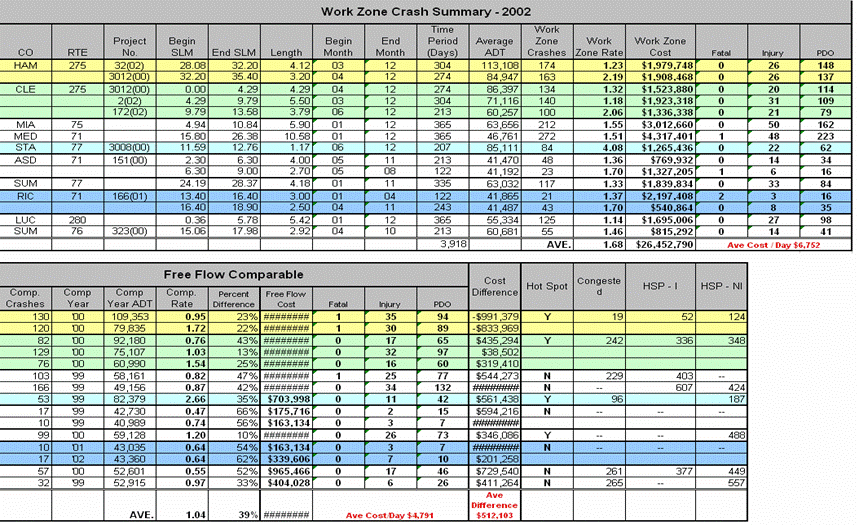
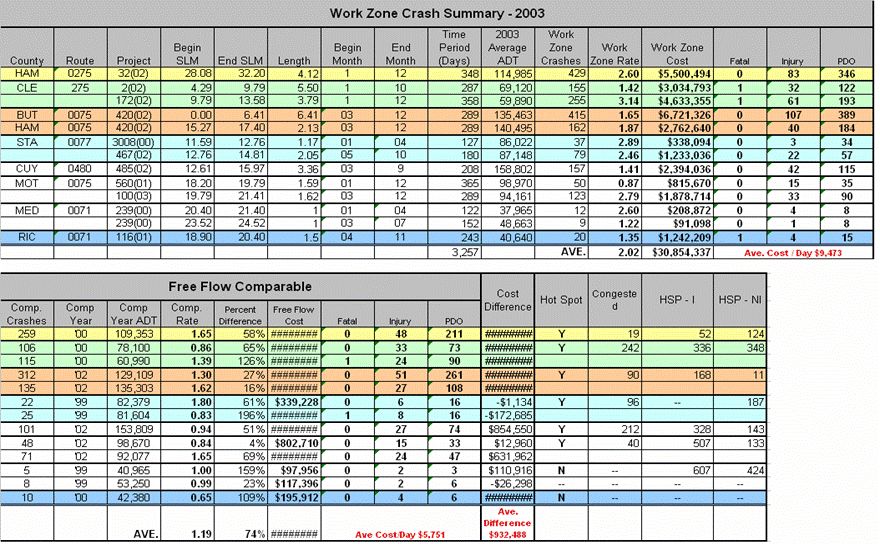
- Drilled deeper into data
- Logged and analyzed hundreds of work zone crashes. Looked for “abnormally” high concentration of crashes.
- Analysis showed need for new/revised specifications & processes
Slide 14
ODOT’s WZ Process in Terms of the New Federal WZ Regulations
Historical Crash Analysis
Results –
Geometrics - The “abnormally” high concentrations of crashes showed there were major geometric contributing factors to Ohio’s work zone crashes:
(a) Inadequate ramp merges
(b) Inadequate off-ramp capacity
(c) Insufficient paved shoulders
Slide 15
ODOT’s WZ Process in Terms of the New Federal WZ Regulations
Historical Crash Analysis
- Ramp Merges – Created new standards for work zone on-ramp merges. Merges are now required to be detailed in plans. (now explicitly looked at in MOTAA)
- Paved shoulders – Created “desired/minimum” cross section that requires a 2’ paved shoulder (now used in Maintenance of Traffic Alternative Analysis (MOTAA) and detailed design)
- Off-Ramp-Capacity – Now explicitly looked for in MOTAA.
Slide 16
ODOT’s WZ Process in Terms of the New Federal WZ Regulations
Historical Crash Analysis
- Historical wz crash analysis will be performed every two years seeking additional “lessons learned”.
- Policies/standards/specifications will be changed as necessary to keep problems from happening again.
Slide 17
ODOT’s WZ Process in Terms of the New Federal WZ Regulations
Historical Crash Analysis
- Hot off the presses – 2006 Historical Data Analysis has started…..
- Emphasis on Fatalities and Fatal Crashes…..
- Preliminary Information follows…..
Slide 18
ODOT’s WZ Process in Terms of the New Federal WZ Regulations
2006 Historical Crash Analysis
Slide 19
ODOT’s WZ Process in Terms of the New Federal WZ Regulations
2006 Historical Crash Analysis
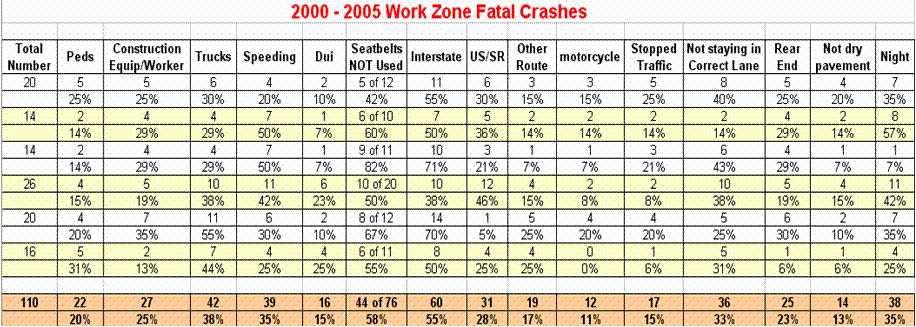
- Of the total 110 fatal WZ crashes; 22 involved pedestrians as the victim (20%).
Slide 20
ODOT’s WZ Process in Terms of the New Federal WZ Regulations
2006 Historical Crash Analysis
- 18 of the 22 pedestrians were construction workers (82%).
- 5 of the 18 were construction related vehicle running over the worker.
- 4 of the 18 were workers being inside the travel lane.
- 8 of the 18 were vehicles speeding, running off the road or driving through a coned off lane and striking a worker.
- 1 of 18 included a vehicle hitting a bucket truck and the worker fell out
Slide 21
ODOT’s WZ Process in Terms of the New Federal WZ Regulations
2006 Historical Crash Analysis
- 17 of the fatal crashes were caused by vehicles not stopping when traffic was stopped in the traveling lanes (15%).
We’re not supposed to have backups?!?!?!
- 11 of the 17 were on Interstate routes.
- 3 of the 17 during morning peak hours
- 3 of the 17 occurred during the evening peak hours
- 6 of the 17 occurred at night (9:30 pm to midnight)
??? What the heck were we doing at this time of night???
- 2 of the 17 occurred midday
- 3 of the 17 occurred due to vehicles not stopping for equipment in the travel lane.
Slide 22
ODOT’s WZ Process in Terms of the New Federal WZ Regulations
2006 Historical Crash Analysis
Slide 23
ODOT’s WZ Process in Terms of the New Federal WZ Regulations
Real Time WZ Crash Data
- 630.1008 State Level Processes and Procedures
- “Shall use field observations, wz crash data….”
- “Shall continually pursue improvement of wz safety and mobility by analyzing work zone crash and operational data from multiple projects….”
Slide 24
ODOT’s WZ Process in Terms of the New Federal WZ Regulations
Real Time Crash Analysis
- Candidate projects identified in winter.
- Coordinate w/local enforcement to have WZ crashes put aside for pickup twice/month. PHYSICALLY PICKING UP CRASH REPORTS IS THE ONLY METHOD THAT HAS WORKED.
- Data base application automatically sorts crashes into ½ mile segments (geo – locate).
- Compared to historical “non-construction” frequencies.
- “Problem” locations investigated.
Slide 25
ODOT’s WZ Process in Terms of the New Federal WZ Regulations
Real Time Crash Analysis
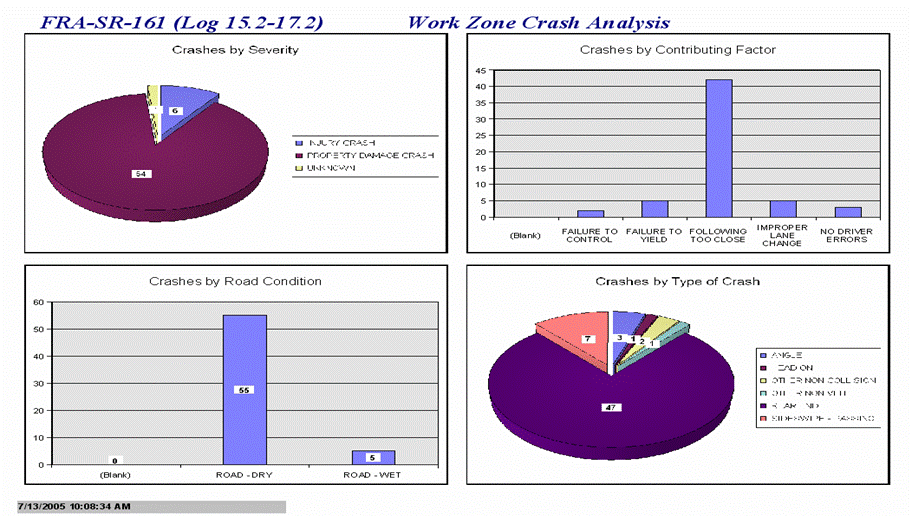
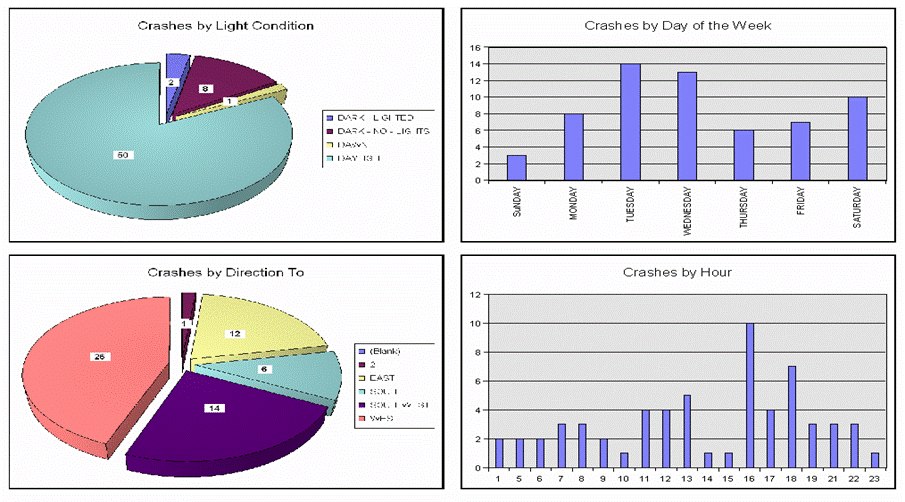
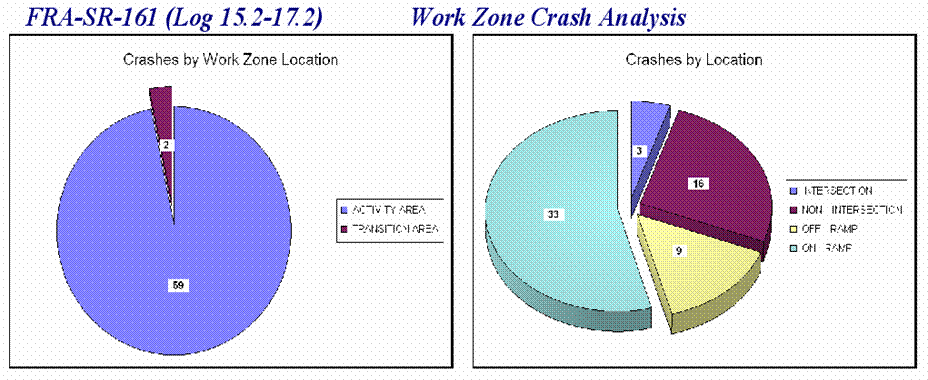
WARNING -This slide targeted to the computer enthusiasts
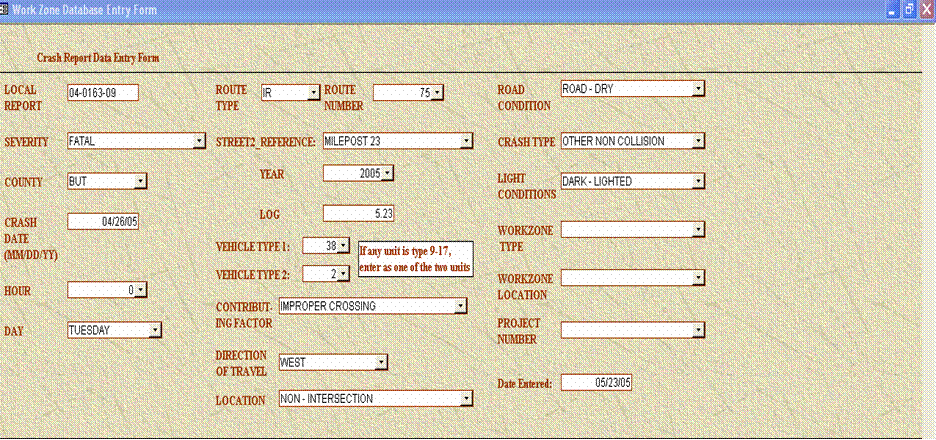
- Data input into Access data base through data entry form.
- Crash trends are sorted and analyzed using pivot tables/charts.
- Individual queries created for each wz in Access data base file.
- Excel (using visual basic coding) hits data base file and runs queries to refresh charts and graphs with latest data.
Slide 26
ODOT’s WZ Process in Terms of the New Federal WZ Regulations
Real Time Crash Analysis
- System is set up by start of construction season.
- Once Set-up, the ONLY thing needed done is to input new crash data.
- ALL CHARTS, GRAPHS, & DATA ARE GENERATED AUTOMATICALLY WITH THE PUSH OF A BUTTON – VERY COOL ……….
Slide 27
ODOT’s WZ Process in Terms of the New Federal WZ Regulations
Real Time Crash Analysis
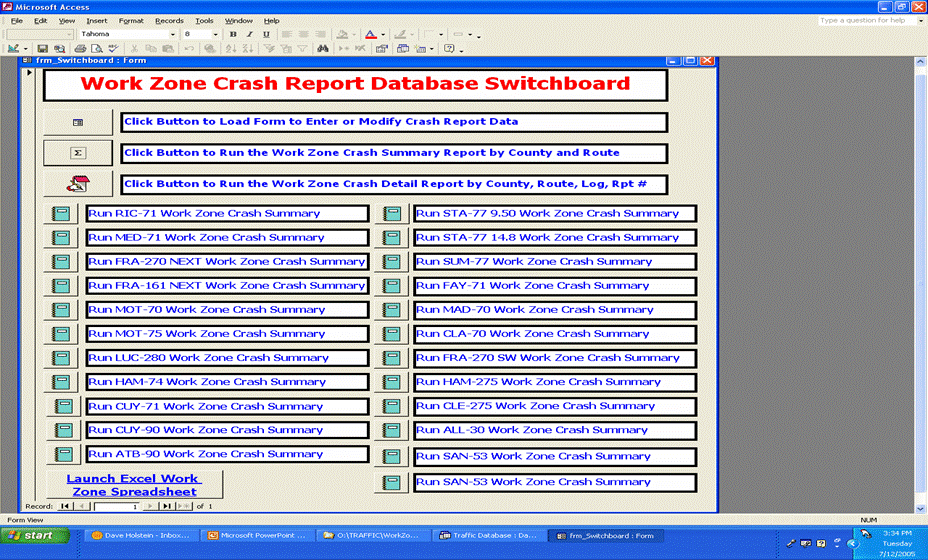
Main Screen
Slide 28
ODOT’s WZ Process in Terms of the New Federal WZ Regulations
Real Time Crash Analysis
Click to Access Data Entry Screen (note: There is an arrow on the slide pointing to the first button on the screen)
Slide 29
ODOT’s WZ Process in Terms of the New Federal WZ Regulations
Real Time Crash Analysis
Crash Report Data Entry Form
Slide 30
ODOT’s WZ Process in Terms of the New Federal WZ Regulations
Real Time Crash Analysis
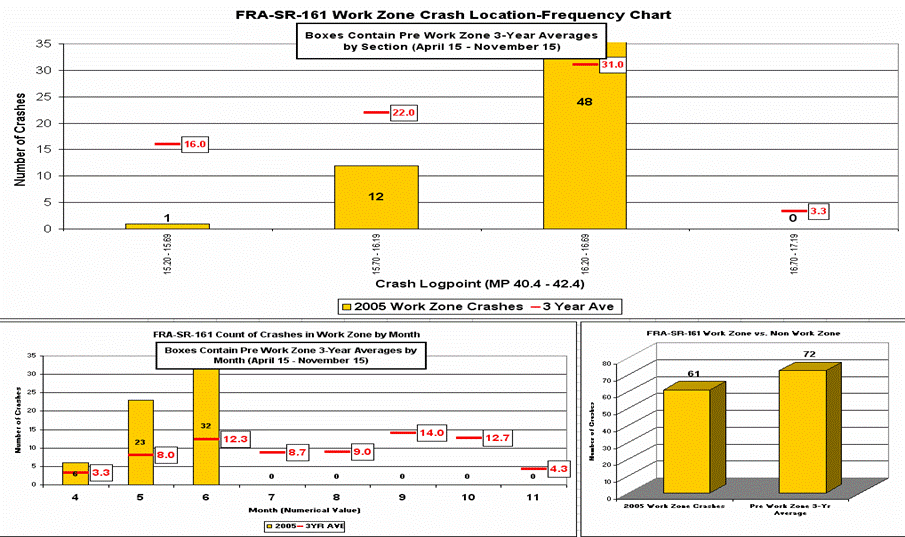
Application Outputs
Note: This slide has indicators pointing to the chart on the slide, highlighting that for Mile 16.2 to 16.99, the non work zone average number of crashes equals 21 over 7 months, while there were 48 crashes over 3 months when a work zone was in the same location.
Slide 31
ODOT’s WZ Process in Terms of the New Federal WZ Regulations
Real Time Crash Analysis
Application Outputs
Slide 32
ODOT’s WZ Process in Terms of the New Federal WZ Regulations
Real Time Crash Analysis
Application Outputs
Slide 33
ODOT’s WZ Process in Terms of the New Federal WZ Regulations
Real Time Crash Analysis
Application Outputs

