FHWA Work Zone Facts and Statistics
Introduction
Access Comprehensive Work Zone Data Sets
For additional data visit the National Work Zone Safety Information Clearinghouse.
![]()
Work zones play a key role in maintaining and upgrading our Nation's roadways. Unfortunately, daily changes in traffic patterns, narrowed rights-of-way, and other construction activities often create a combination of factors resulting in crashes, injuries, and fatalities. These crashes also cause excessive delays, especially given the constrained driving environment.
This page highlights work zone-related data insights. Understanding data trends is the first step to making changes to improve work zone safety, mobility, and constructability. For additional information and data, please visit the National Work Zone Safety Information Clearinghouse.
Work Zone Exposure. In the United States (U.S.), one work zone fatality occurs for every 4 billion vehicle-miles of travel1 and for every $112 million worth of roadway construction expenditures.2, 3
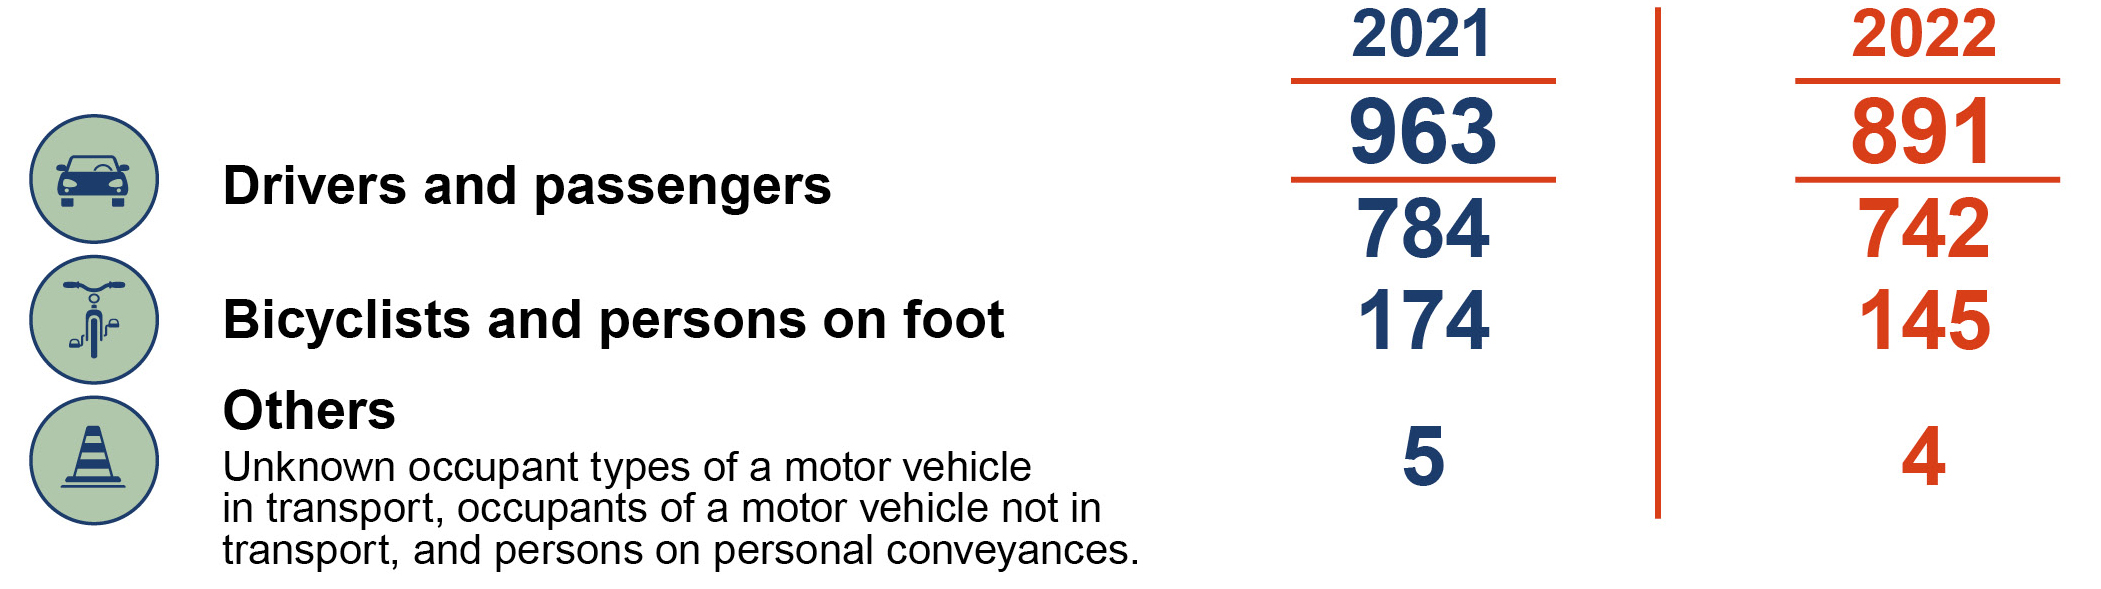
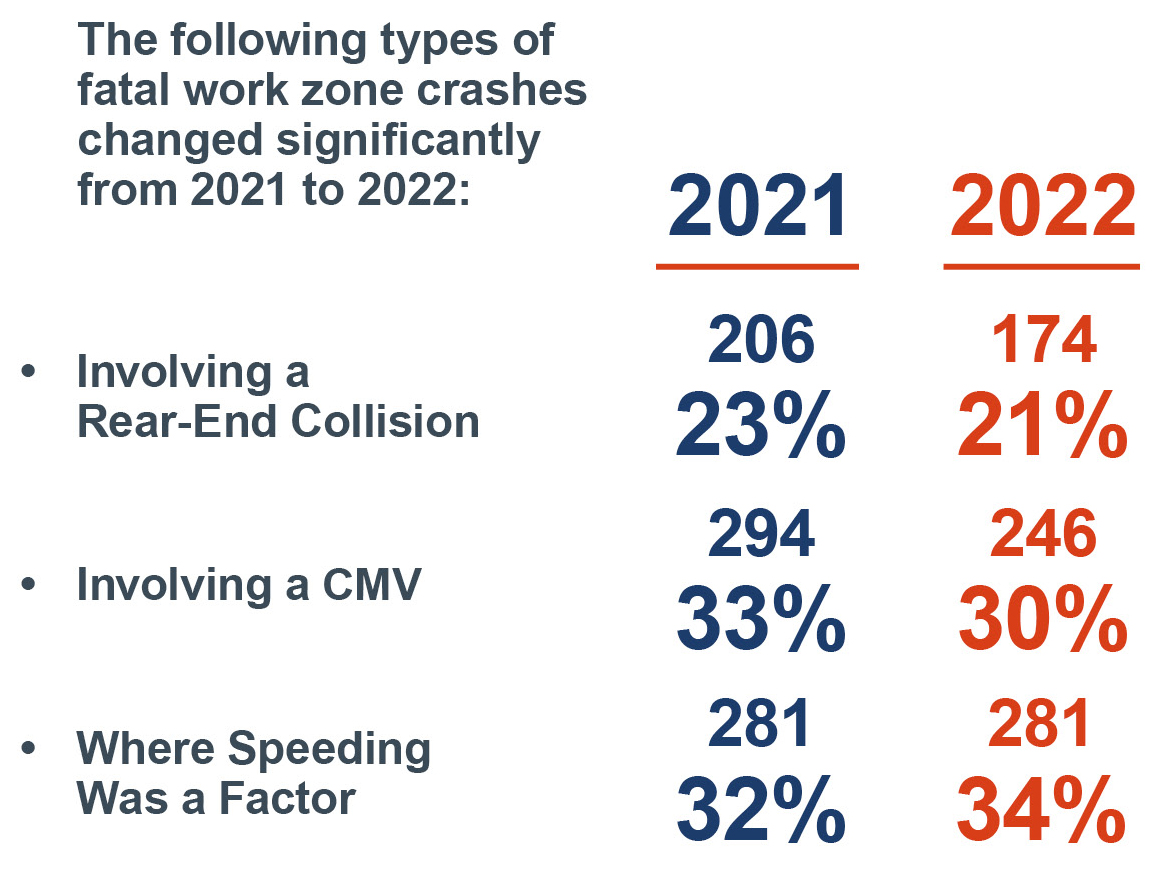
Work Zone Fatalities. Between 2021 and 2022, work zone fatalities decreased by 7 percent while overall roadway fatalities declined by 1.7 percent.4 There was a decrease in the percentages of fatal work zone crashes involving rear-end collisions, but commercial motor vehicle (CMV), and fatal work zone crashes that involved speeding increased. Persons on foot and bicyclists saw a decrease of 16.6 percent in work zone fatalities in 2022 relative to 2021.5
Work Zone Crashes. Fatal work zone crashes involving CMVs decreased slightly in 2022—from 294 fatal crashes in 2021 to 246 fatal crashes in 2022.6
Total Work Zone Traffic Fatalities7
Based on National Highway Traffic Safety Administration (NHTSA) FARS data by person type
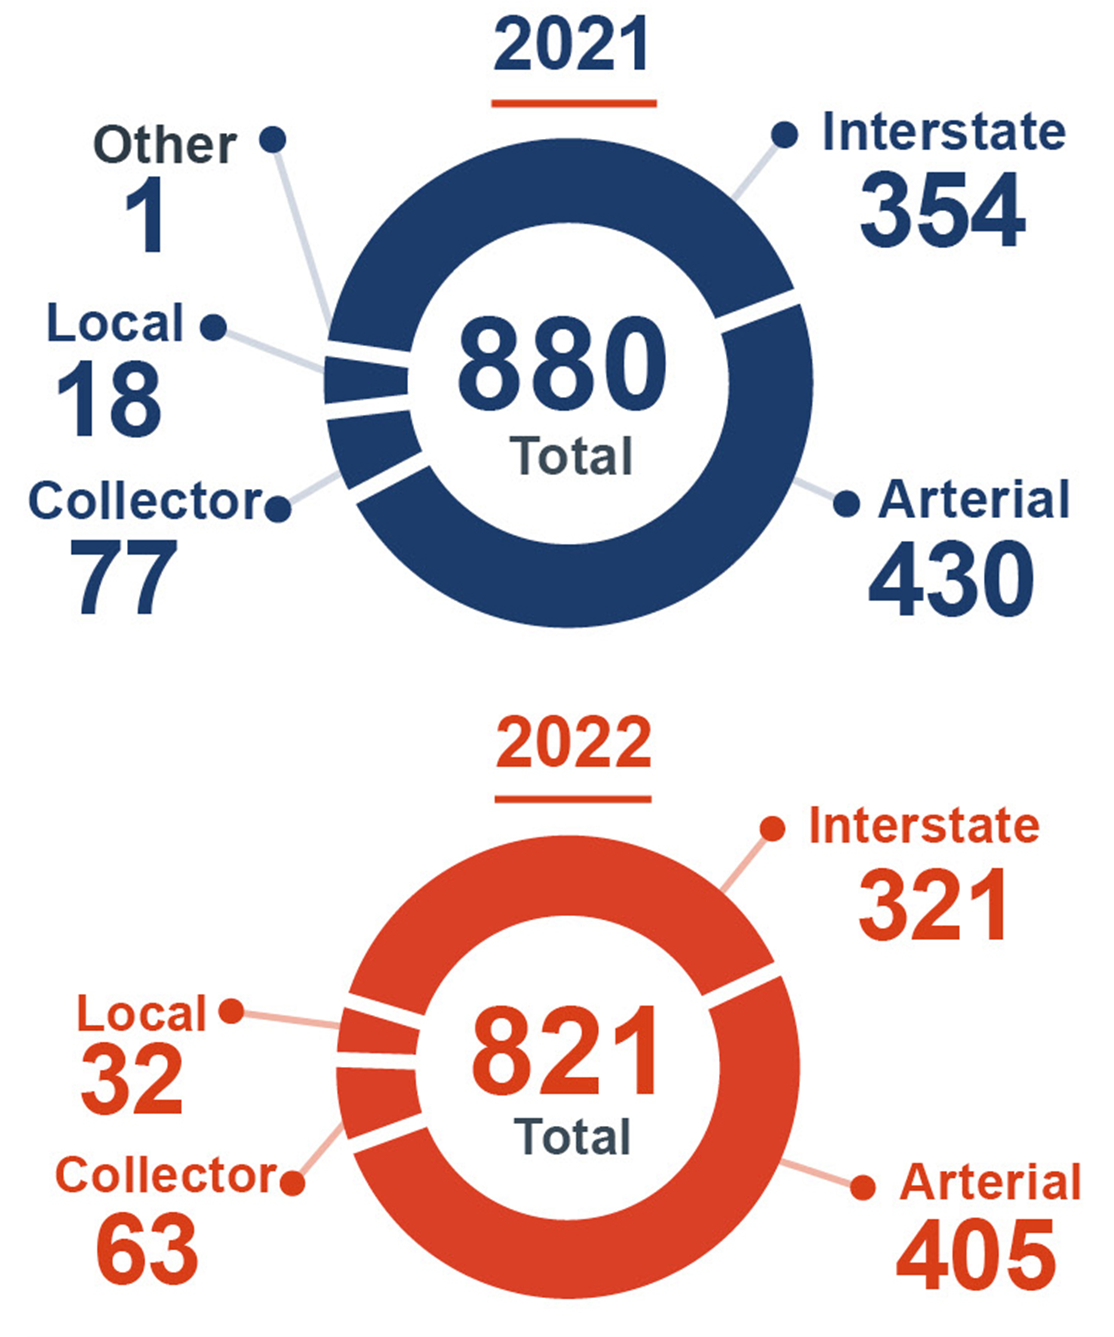
Total Work Zone Fatal Traffic Crashes8
Based on NHTSA FARS data by type of roadway
Total Work Zone Fatal Traffic Crashes By Type9
Notes:
- Data on fatal traffic crashes in work zones come from the FARS, National Highway Traffic Safety Administration (NHTSA). These data represent crashes coded as occurring in a work zone from all 50 States, the District of Columbia, and Puerto Rico. These data are extracted from law enforcement crash report forms, and as such are only as accurate as the data included in those reports. It is possible that some crashes that did occur in work zones were not recorded as being in a work zone, and so would not be included in these statistics.
- The Federal Highway Administration (FHWA), Federal Motor Carrier Safety Administration, and NHTSA use the term CMV when referring to large trucks and buses. Large trucks are identified as vehicles with a gross vehicle weight rating (GVWR) of more than 10,000 lbs (Fatality Analysis Reporting System (FARS) body type codes 60—64, 66—67, 71—72, and 78). Large trucks do not include motor homes. Buses are identified as school buses, cross-country or intercity buses, transit (city) buses, van-based buses (GVWR more than 10,000 lbs), and other types of buses (FARS body type codes 50—59). Buses do not include van-based buses with a GVWR of 10,000 lbs or less. For more information, visit COMMERCIAL MOTOR VEHICLE SAFETY IN WORK ZONES TARGETED ACTION PLAN.
Sources:
1 Bureau of Transportation Statistics — 799 fatalities in work zones in 2017 and 3,174,408,000,000 VMT in 2016. Accessible at: https://www.bts.gov/. [ Return to Note 1 ]
2 Federal Reserve Bank of St. Louis Economic Data - Average estimate of total US road construction expenditures of $89,316,083,333 in 2017. Accessible at: https://fred.stlouisfed.org/. [ Return to Note 2 ]
3 National metrics do not exist for the number of work zones occurring annually or the vehicle-miles of exposure to work zones. [ Return to Note 3 ]
4 FARS 2022 Annual Report File, NHTSA. FARS data shown here are from the 50 States, the District of Columbia, and Puerto Rico. [ Return to Note 4 ]
5 Fatality Analysis Reporting System (FARS) 2021 Final File and 2022 Annual Report File, National Highway Traffic Safety Administration (NHTSA). FARS data shown here are from the 50 States, the District of Columbia, and Puerto Rico. [ Return to Note 5 ]
6 FARS 2022 Annual Report File, NHTSA. FARS data shown here are from the 50 States, the District of Columbia, and Puerto Rico. [ Return to Note 6 ]
7 FARS 2021 Final File and 2022 Annual Report File, National Highway Traffic Safety Administration (NHTSA). FARS data shown here are from the 50 States, District of Columbia, and Puerto Rico. [ Return to Note 7 ]
8 FARS 2021 Final File and 2022 Annual Report File, NHTSA. FARS data shown here are from the 50 States, District of Columbia, and Puerto Rico. [ Return to Note 8 ]
9 FARS 2021 Final File and 2022 Annual Report File, NHTSA. FARS data shown here are from the 50 States, District of Columbia, and Puerto Rico. [ Return to Note 9 ]
Note: Figures are subject to revision, as values reported in FARS may be updated intermittently. Values shown here reflect what is reported by NHTSA as of April 2024.