Work Zone Mobility and Safety Program
Photo collage: temporary lane closure, road marking installation, cone with mounted warning light, and drum separated work zones.
Office of Operations 21st Century Operations Using 21st Century Technologies

Description of Slide 12

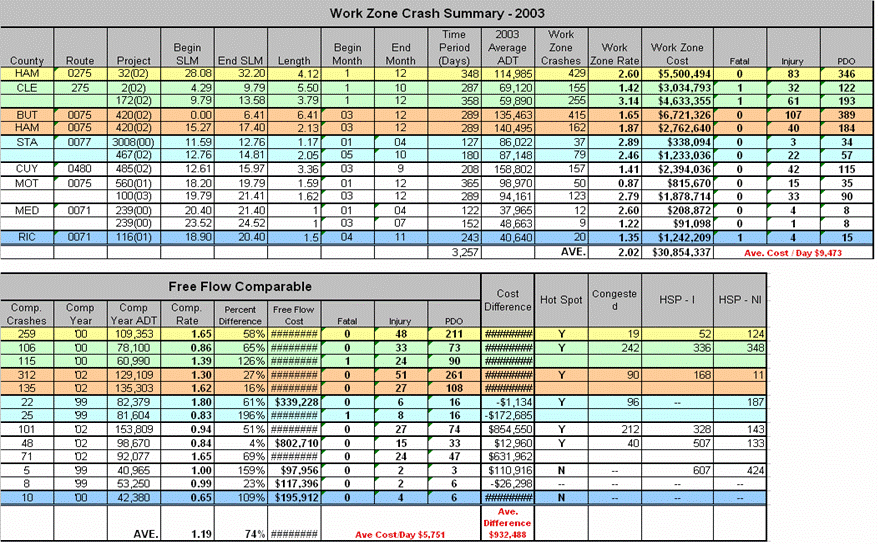
2003 work zone crash summary indicating the wz crash rate was 2.02 and the non wz crash rate was 1.19.

Description

This image shows a copy of an Excel spreadsheet, providing a work zone crash summary for 2003. The main point that this image is trying to get across is that in 2003, the average work zone crash rate was 2.02, while the free flow comparable average crash rate (or non work zone average crash rate) was 1.19.