Description of Slide 33
Description
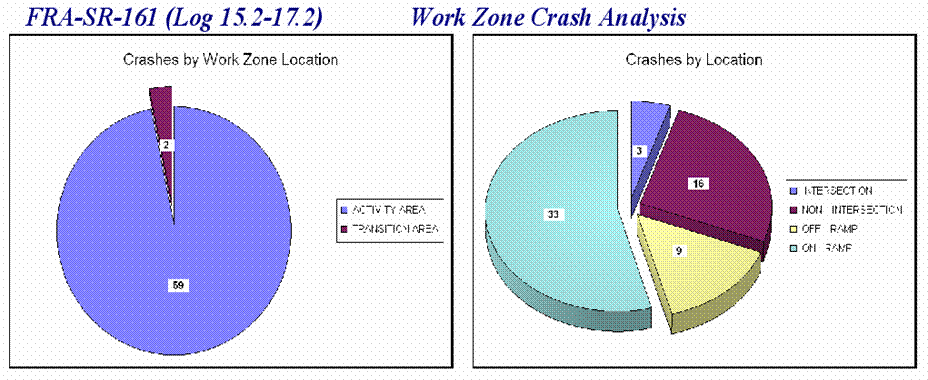
This image shows two charts for FRA-SR-151 (Log 15.2 - 17.2):
- Crashes by Work Zone Location
- Crashes by Location
Crashes by Work Zone Location
This is a pie chart. It shows 59 crashes occured in the activity area and 2 crashes occured in the transition area.
Crashes by Location
This is a pie chart. It shows that 33 crashes occured on the on ramp, 9 crashes occured on the off ramp, 16 crashes occured in a non intersection, and 3 crashes occured in an intersection.

