
Description of Slide 6 Image 1
Description
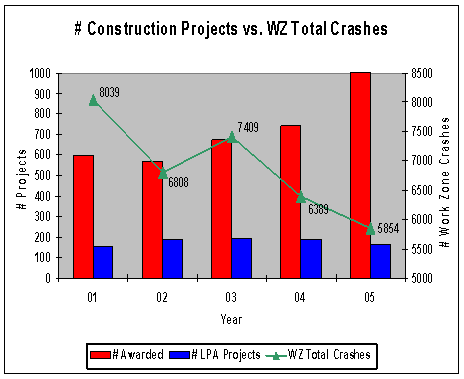
This bar graph shows the # of construction projects awarded, the # of LPA projects, and work zone total crashes from 2001 to 2005:
- 2001 - Approximately 600 projects awarded, 150 LPA projects, and 8039 work zone total crashes.
- 2002 - Approximately 575 projects awarded, 200 LPA projects, and 6808 work zone total crashes.
- 2003 - Approximately 700 projects awarded, 200 LPA projects, and 7409 work zone total crashes.
- 2004 - Approximately 750 projects awarded, 200 LPA projects, and 6389 work zone total crashes.
- 2005 - Approximately 1000 projects awarded, 150 LPA projects, and 5854 work zone total crashes.