Description of Slide 31
Description
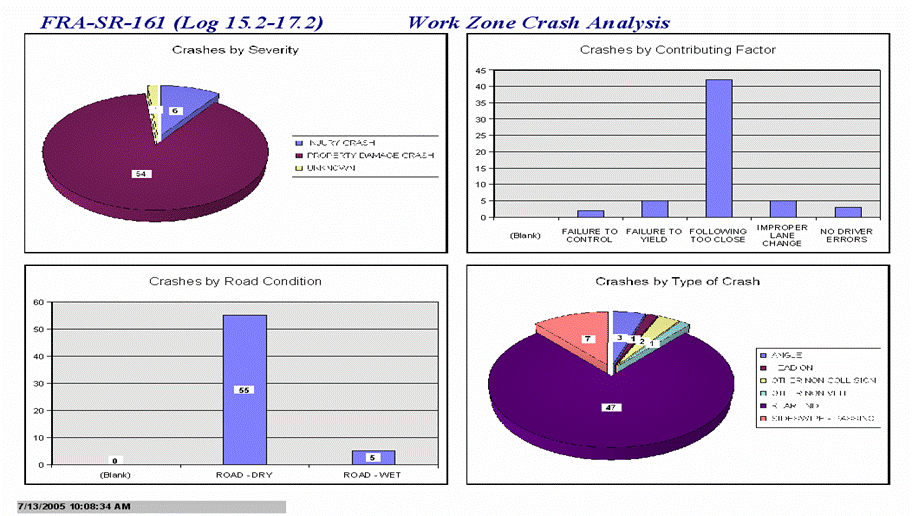
This image shows four charts for FRA-SR-161 (Log 15.2-17.2):
- Crashes by Severity
- Crashes by Road Condition
- Crashes by Contributing Factor
- Crashes by Type of Crash
Crashes by Severity
This is a pie chart. Based on the previous slide, it is assumed that the numbers are the chart represent number of crashes, and not percentages. The chart shows that 54 crashes caused property damages, 6 crashes caused injury, and 1 crash caused unknown consequences.
Crashes by Road Condition
This is a bar chart. It shows that there were 0 entries left blank for this field, 55 crashes where when the road was dry, and 5 crashes were when the road was wet.
Crashes by Contributing Factor
This is a bar chart. It shows that there were 0 entries left blank for this field, approximately 2 crashes were caused by failure to control, 5 crashes were caused by failure to yeild, approximately 42 crashes were caused by following too close, 5 crashes were caused by improper lane change, and approximately 3 crashes were caused by no driver errors.
Crashes by Type of Crash
This is a pie chart. It shows that 47 crashes were rear end, 7 crashes were sideswipe-passing, 3 were angle, 1 was head on, and 2 were other non-collision. The chart also shows 1 additional crash, but the type of crash listed on the slide is illegible.

