Description of Slide 32
Description
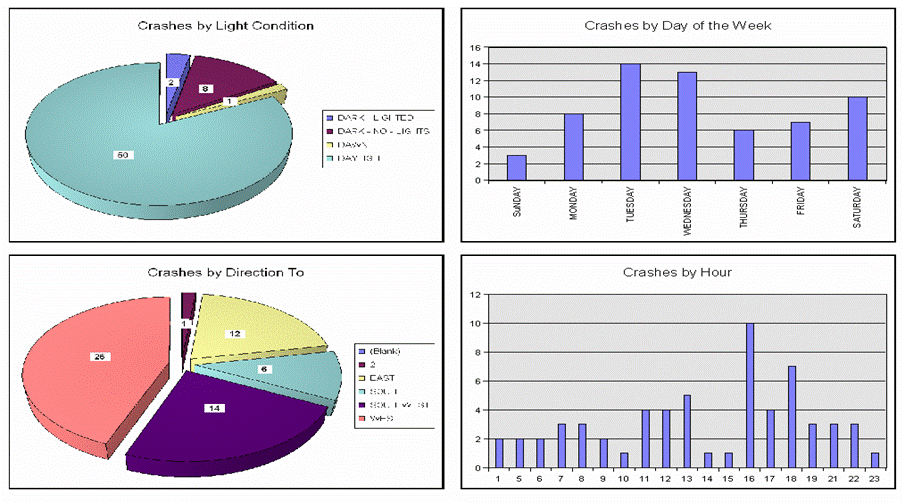
This image shows four charts for FRA-SR-161:
- Crashes by Light Condition
- Crashes by Direction To
- Crashes by Day of the Week
- Crashes by Hour
Crashes by Light Condition
This is a pie chart. It shows that 50 crashes were during the Day, 2 crashes were during the dark with no lights, 8 crashes were during the dark where it was lighted, and 1 crash was during dawn.
Crashes by Direction To
This is a pie chart. It shows that 26 crashes were heading west, 14 crashes were heading southwest, 6 crashes were heading south, and 12 crashes were heading east. The chart also shows that 1 crash was heading in a direction that is illegible on the slide.
Crashes by Day of the Week
This is a bar chart. It shows that approximately 3 crashes occured on Sunday, 8 crashes occured on Monday, 14 crashes occured on Tuesday, approximately 13 crashes occured on Wednesday, 6 crashes occured on Thursday, approximately 7 crashes occured on Friday, and 10 crashes occured on Saturday.
Crashes by Hour
This is a bar chart. It shows that 2 crashes occured at 1:00 am, 2 crashes occured at 5:00 am, 2 crashes occured at 6:00 am, approximately 3 crashes occured at 7:00 am, approximately 3 crashes occured at 8:00 am, 2 crashes occured at 9:00 am, approximately 1 crash occured at 10:00 am, 4 crashes occured at 11:00 am, 4 crashes occured at 12:00 pm, approximately 5 crashes occured at 1:00 pm, approximately 1 crash occured at 2:00 pm, approximately 1 crash occured at 2:00 pm, 1 crashoccured at 3:00 pm, 10 crashes occured at 4:00 pm, 4 crashes occured at 5:00 pm, approximately 7 crashes occured at 6:00 pm, approximately 3 crashes occured at 7:00 pm, approximately 3 crashes occured at 9:00 pm, approximately 3 crashes occured at 10:00 pm, and approximately 1 crash occured at 11:00 pm.

