Description of Slide 30
Description
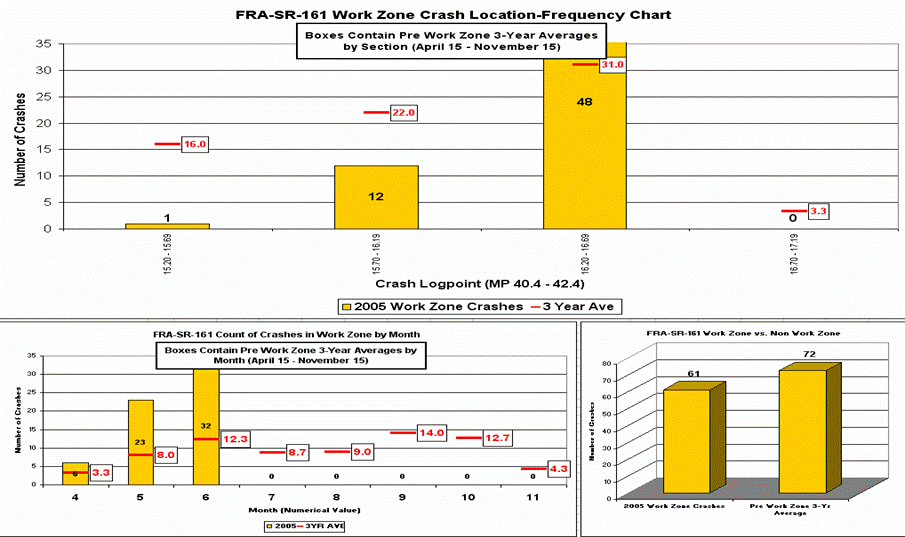
This slide provides 3 charts for FRA-SR-161:
- FRA-SR-161 Work Zone Crash Location-Frequency Chart
- FRA-SR-161 Count of Crashes in Work Zone by Month
- FRA-SR-161 Work Zone vs. Non Work Zone
FRA-SR-161 Work Zone Crash Location-Frequency Chart
This is a bar graph with number of crashes on the y-axis and crash logpoint (MP 40.4 - 42.4) on the x-axis. In 2005 there was 1 crash at Mile 15.20 - 15.69 (the pre work zone 3 year average for this point is 16), 12 crashes at Mile 15.70 - 16.19 (the pre work zone 3 year average at this point is 22) and 48 crashes at Mile 16.2 - 16.99 (the pre work zone 3 year average at this point is 31). There are arrows on the chart pointing to the 48 crash total for Mile 16.2 - 16.99 stating that the 3 month crash total of 48 is a big problem. There is also an arrow pointing to the pre work zone 3 year average highlighting that this was 31.
FRA-SR-161 Count of Crashes in Work Zone by Month
This is a bar graph with the number of crashes on the y-axis and the month (numerical value) on the x-axis. The graph compares the number of crashes in the work zone per month with the pre work zone 3 year average for that month. In April there were 6 work zone crashes and a pre work zone 3 year average of 3.3 crashes, in May there were 23 work zone crashes and a pre work zone 3 year average of 8 crashes, in June there were 32 crashes and a pre work zone 3 year average of 12.3 crashes, in July there were 0 work zone crashes and a pre work zone 3 year average of 8.7 crashes, in August there were 0 work zone crashes and a pre work zone 3 year average of 9 crashes, in September there were 0 work zone crashes and a pre work zone 3 year average of 14 crashes, in October there were 0 work zone crashes and a pre work zone 3 year average of 12.7 crashes, and in November there were 0 work zone crashes and a pre work zone 3 year average of 4.3 crashes.
FRA-SR-161 Work Zone vs. Non Work Zone
This is a bar graph with number of crashes on the y-axis and a comparison of 2005 work zone crashes and pre work zone 3 year average crashes on the x-axis. There were 61 work zone crashes in 2005. Pre work zone, there was a 3 year average of 72 crashes.

