Freight and Land Use Travel Demand Evaluation: Final Report
Section 3
Topic A: Integration of Land Use and Freight Planning
The integration of land use and freight planning underpins goods movement and travel demand management—from the econometric approaches used by private industry to match supply and demand to the planning, design, and operations tools used to define transportation system investments. Understanding relationships between land use inputs and goods movement outputs benefits from improved data sources, analytical research, and database management. In turn, those relationships provide the ability to consider more subtle elements, such as the effects freight demand and goods movement trends might have on influencing land use planning and tailoring analyses toward industry-specific needs.
This topic summarizes perhaps the most compelling study element: how freight demand is affected by land use (see Figure 1). Important considerations related to this element are discussed below.
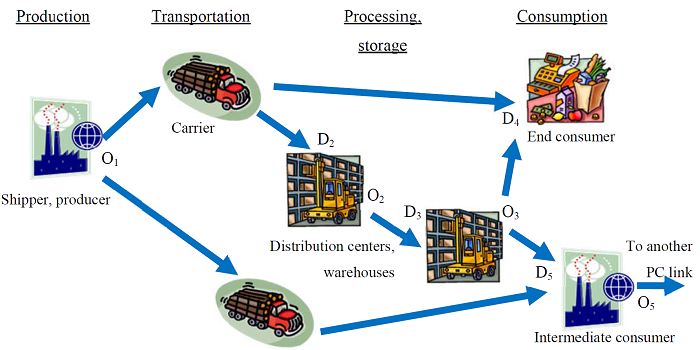
Figure 1: NCFRP Report 37 Provides Insight into Trip Generation for Different Elements of the PC Link
Source: NCFRP Report 37
When analyzing trip generation relative to freight, it should be considered in terms of freight generation (FG), freight trip generation (FTG), and service trip generation (STG). A key concept is that FG and FTG are two different measurements.
- FG is derived from freight production-consumption (PC) and is typically measured in tons. This is the sum of freight attraction (the amount of cargo that is brought to the establishment to be processed, stored, or sold to customers) and freight production (the amount of cargo sent out of the establishment for use at another establishment).
- FTG is the number of freight vehicle trips generated by an establishment. It is typically modeled by converting FG to truck trips based and logistical decisions for shipment size, frequency of deliveries, vehicle size, and modes used. The models are used to derive trip generation based on commercial establishment land use type generating trips and the relationship between those subject sites, their commercial partners upstream and downstream within the PC link, and the land use and transportation system elements surrounding those freight-generating sites.
- STG is the number of vehicle trips generated in performing services at an establishment.
Application of NCFRP Freight Trip Generation Data
NCFRP Report 37 improves estimated freight generation using commodity flow data that facilitates trip generation assessment as a function of characteristics such as establishment size and type of economic activity performed (see Figure 2). The models provided FG, FTG, and STG rates per employee for each classification of commercial establishment based upon NAICS codes. Models are provided for establishment-level FTG (both production and attraction) and STG (attraction). For many of the industry classes, the models are non-linear to represent the scale of economies of production (i.e., the larger the establishment, the higher the productivity for a unit of labor). The research found that using industrial classification systems for estimating FG and FTG rates is more effective than using standard land use classification systems. The amount of cargo consumed and produced at an establishment are the inputs and outputs of an economic process, respectively, making employment and the industry sector better predictors than variables like square footage.
Freight Trip Generation Estimates for the Commercial Center in Troy, NY
ID |
NAICS Description |
Actual NAICS |
Model Used |
FTE |
Deliveries Received/Day |
||
|---|---|---|---|---|---|---|---|
NAICS |
Geography |
Linear Model |
Non-linear Model |
||||
1 |
Retail Trade |
44 |
44 |
CR |
11.2 |
3.21 |
3.91 |
2 |
44 |
44 |
CR |
3.15 |
2.37 |
2.44 |
|
3 |
44 |
44 |
CR |
7 |
2.77 |
3.28 |
|
4 |
44 |
44 |
CR |
4.15 |
2.48 |
2.70 |
|
5 |
44 |
44 |
CR |
1.9 |
2.24 |
2.02 |
|
6 |
45 |
45 |
CR |
4.25 |
1.11 |
2.29 |
|
7 |
45 |
45 |
CR |
12.75 |
3.34 |
3.82 |
|
8 |
45 |
45 |
CR |
4.8 |
1.26 |
2.42 |
|
9 |
Accommodation and Food Service |
72 |
72 |
CR |
21 |
1.14 |
1.64 |
10 |
72 |
72 |
CR |
9.5 |
1.14 |
1.08 |
|
11 |
72 |
72 |
CR |
4.8 |
1.14 |
0.76 |
|
12 |
72 |
72 |
CR |
4.9 |
1.14 |
0.77 |
|
13 |
72 |
72 |
CR |
3.8 |
1.14 |
0.67 |
|
All FIS |
93.2 |
24.49 |
27.79 |
||||
FTA (1 delivery = 1 vehicle trip) |
24.49 |
27.79 |
|||||
ID |
NAICS Description |
Actual NAICS |
Model Used |
FTE |
Shipments Out/Day |
||
|---|---|---|---|---|---|---|---|
NAICS |
Geography |
Linear Model |
Non-linear Model |
||||
1 |
Retail Trade |
44 |
44 |
CR |
11.2 |
4.68 |
5.79 |
2 |
44 |
44 |
CR |
3.15 |
1.32 |
2.61 |
|
3 |
44 |
44 |
CR |
7 |
2.93 |
4.31 |
|
4 |
44 |
44 |
CR |
4.15 |
1.73 |
3.11 |
|
5 |
44 |
44 |
CR |
1.9 |
0.79 |
1.90 |
|
6 |
45 |
44, 45 |
CR |
4.25 |
1.84 |
3.09 |
|
7 |
45 |
44, 45 |
CR |
12.75 |
5.51 |
6.33 |
|
8 |
45 |
44, 45 |
CR |
4.8 |
2.07 |
3.34 |
|
9 |
Accommodation and Food Service |
72 |
72 |
NYC + CR |
21 |
2.39 |
3.86 |
10 |
72 |
72 |
NYC + CR |
9.5 |
1.08 |
2.21 |
|
11 |
72 |
72 |
NYC + CR |
4.8 |
0.55 |
1.36 |
|
12 |
72 |
72 |
NYC + CR |
4.9 |
0.56 |
1.38 |
|
13 |
72 |
72 |
NYC + CR |
3.8 |
0.43 |
1.16 |
|
All FIS |
93.2 |
25.89 |
40.46 |
||||
FTA (1 delivery = 1 vehicle trip) |
12.94 |
20.23 |
|||||
Figure 2: Example Freight Trip Generation Problem Described in NCFRP Report 37
Source: NCFRP Report 37
These models estimate FG at the establishment level based upon employment; however, employment data from the Census Bureau is at the ZIP code or county level. Also, planning forecasts by the MPOs and States are made at the Traffic Analysis Zone (TAZ) level. This requires aggregation and disaggregation of data between the establishment level and the TAZ level for analysis. Also, if the State or region's total FG is going to be compared with the CFS, this comparison requires further aggregation up to the regional or State level.
Another important factor is that FG, FTG, and STG rates may vary from region to region and from State to State, in part depending on differences specific to commodities in the flow, requiring local calibration. This is explored further in Topic C.
The models and data will aid practitioners in improved FG, FTG, and STG analyses for travel demand modeling. This can also be used to facilitate more precise traffic impact analyses, better curb space management, and more properly sized loading/unloading areas.
NCFRP Report 37 contains several hundred pages of tabular information that reflect a robust and deep data source, but one that may be challenging for the first-time user to absorb. The QRFM should summarize the findings of NCFRP Report 37 and provide directions to particular elements that may be most accessible to practitioners not well versed in the research subject matter, including:
The illustrative examples in Chapter 9 that organize the databases to solve a given problem, such as in the creation of Table 120 (included as Figure 2 above) to demonstrate the development of commercial parking needs for a commercial center.
Online databases that allow the user to search based upon NAICS codes or land use.
While NCFRP Report 37 provides very useful information for commercial site trip generation from both production (i.e., the manufacturer) and attraction (i.e., the retailer) ends, the research on household trip attractions for service trips is still lacking. Additional research would be beneficial on:
The total amount of freight trip ends at the residential attraction level, both through household survey queries regarding the amount and type of home deliveries as well as through more intensive service trip provider information on household deliveries.
The types of household characteristics (persons per household, age of residents, income, etc.) that may affect service trip generation at the household level.
Approach for Applying Context-Sensitive Land Use to NCFRP Report 37 Trip Generation Rates
Local land use context substantially influences total vehicular trip rates, resulting in new tools such as those developed by the U.S. Environmental Protection Agency (EPA) as part of their Mixed-Use Development (MXD) trip generation analysis approach and as documented in NCHRP Report 758, Trip Generation Rates for Transportation Impact Analysis of Infill Developments. In some cases, integrating the establishment size and economic activity independent variables of NCFRP Report 37 with the EPA MXD Trip Generation or NCHRP Report 758 approaches may improve the accuracy of FTG and STG model estimations. These approaches recognize that land use variables such as density, diversity, design, distance to transit, and distance to a regional core (often described as the "Ds") affect localized trip generation rates.
ITE is currently investigating incorporating a more sophisticated level of context-sensitivity into its published trip-generation rates. Many jurisdictions have adopted context-sensitive adjustments for total trip generation rates in their development impact analysis processes. The development of truck trip generation rates (whether for freight or service), however, remains relatively unexplored in the traditional traffic impact analysis process used by most jurisdictions.
Land use context (i.e., the "Ds") is to a certain extent implicitly reflected in NCFRP Report 37 formulas for trip generation rates. This is largely because those formulas incorporate facility size (as reflected by number of employees) and type (as reflected by NAICS codes), and the number of truck deliveries or service deliveries is not sensitive to other contextual land use elements. In other words, even if a restaurant employing a staff of 50 generates fewer vehicle trips by patrons if located in a higher density community or closer to transit, the number of goods and service deliveries will not be sensitive to those variables.
However, NCFRP Report 37 notes that, in describing the connections between the freight system and land use, it is important to distinguish between two separate aspects: 1) how land use at the establishment level influences FTG; and 2) how freight activity and land use interact with each other at the system level. The main emphasis of NCFRP Report 37 was that the impact of land use on FTG and the spatial distribution of freight and land use activities may warrant additional consideration.
NCFRP Report 37 Trip Generation Database
The resources in NCFRP Report 37 are quite robust and contain a fair amount of technical complexity. The comparison of different types of freight demand models in a database as described by NCHRP Report 739 is a FTG software tool, currently under development, which replaces the comparative assessment of freight demand models described by NCHRP Report 739.3
The software, developed by the Rensselaer Polytechnic Institute (RPI), applies FTG models at the ZIP-code and two-digit NAICS-code levels. The NCFRP Report 37 databases provide independent data regarding the warehousing component of the PC link, thereby helping practitioners differentiate between manufacturing, warehousing, distribution, and final delivery. The QRFM update will need to coordinate with database development efforts to provide a logical cross-reference and a simplified summary of access to the software and its user guide.
The advent of e-commerce has increased the complexity of the relationship between manufacturing and the ultimate destination for individual goods delivery. Long-standing definitional boundaries are being blurred and may need to be redrawn. The expert working session included a constructive discussion of the semantic and technical differences between the types of goods movement that might be considered "freight" and those that are more "life" oriented, as described in section 2 of this report.
Freight Villages Concepts and the Effect on Trip Generation
Freight villages are clusters of transportation and logistics facilities that are co-located and coordinated for synergies with an intermodal terminal and may also be referred to as intermodal distribution centers, inland ports, logistics centers, or trade gateways. The genesis for this analysis is the degree to which the freight village concept, relating to the size and location of goods delivery staging centers, could affect truck trip generation and total travel. These typically include distribution centers, warehousing, value-added industries, services, and other supportive land uses with access to intermodal connections such as highways, rail, freight airports, or possibly marine ports.
Freight villages promote synergies in logistics processes (e.g., haulage, storage, and packaging) and infrastructure (e.g., connections to networks, transshipment equipment, railway sidings, etc.). Freight villages could reduce congestion at both the regional and local levels through increased intermodal transportation, internalized trip-making for intermediate goods processing steps due to colocation of industry, and improved staging for urban distribution. Freight villages could impact FTG; however, a great deal of uncertainty exists as to whether the level of synergy due to colocation can be sufficient to realize significant changes in FTG. Practitioners might consider that:
Freight villages may provide more efficient intermodal transportation options, improving the competitiveness of other non-highway transportation modes. Shifting freight from truck to rail can reduce VMT and have a positive impact on regional congestion.
Colocation with industry can minimize intermediate trips between companies and the intermodal terminal. If manufacturers, suppliers, and distribution centers can be located on the same site, this could lower congestion at the local level by avoiding trips that would otherwise occur on the road network outside of the freight village.
Centers used for consolidation and distribution could conceivably result in fewer truck trips and more efficient urban deliveries. However, the final delivery of goods to stores and consumers is still made overwhelmingly by trucks, with delivery patterns oriented toward private company ownership rather than by trip-making efficiency, and it is unclear whether these benefits can be realized in practice.
Freight intensity in the vicinity of a freight village can cause local congestion that may spill over into the surrounding region. Intermodal transportation naturally entails the growth of truck activity around terminals, as the initial and final segments of most freight movements still need to be handled by trucks.
"Freight sprawl" caused by industrial and logistics relocation to exurban greenfield areas outside of urban areas can cause dispersal of freight generators away from the urbanized core, affecting regional transportation and logistics patterns.
Strategic Planning for Freight Locational Planning
Analysis of the movement of both people and goods can benefit from scenario planning that evaluates both land use and transportation system actions on travel needs. The expert working session included a robust discussion on the value of strategic planning at the national, regional, local, and site levels.
(Mega)Regional Planning
In 2016-2017, FHWA conducted a series of megaregion workshops that brought together local, State, and Federal transportation decisionmakers to identify how States, MPOs, and other planning partners can better coordinate freight planning, and identify common approaches to address traffic congestion and aging infrastructure at a megaregion level. The megaregion workshops identified many technical and institutional opportunities as well as constraints for implementing a more holistic approach to large-scale movement of people and goods.
At the broadest scale, the I-10 Corridor workshop brought together State government and USDOT leadership to identify a shared vision of connecting several megaregions, establishing a megaregional concept of operations, and developing an action plan for a 1,000-mile span of the corridor. Actions discussed ranged from turning data into corridor-wide traveler information, identifying new policies and technologies, and streamlining goods movement regarding permitting, weigh-in-motion, truck parking, and enforcement. For example, at the Piedmont megaregion workshop, participants focused on freight and goods movement bottlenecks. Attendees recognized the need to better link Atlanta to the Ports of Savannah and Charleston, yet those two port cities are not consistently considered part of the Piedmont megaregion. This concern about boundaries relates to the concept of "problem sheds" discussed at the Mid-South megaregion workshop, indicating the need for a nimble and problem-oriented approach to connecting stakeholders, depending on the scale and scope of the issue being addressed. Each of these workshops helped develop or strengthen interagency and interdisciplinary relationships and set the stage for implementing specific megaregional transportation solutions.
Subarea Planning
At the subarea level, studies are showing that both passenger and freight travel becomes more efficient in terms of VMT per capita (and related environmental externalities) when land uses become more compact and diverse, even though truck delays increase somewhat (an outcome similar to that found in most studies of person movement and smart growth environments). Wygonik et al. demonstrated the effects of smart growth land use in the Puget Sound Council of Governments' region in their 2017 TRB paper, Forecasting Tools for Analyzing Urban Land Use Patterns and Truck Movement.4 Several suggestions for quick-response approaches are suitable for adoption, including:
Considering suitability in terms of accessibility to designated freight corridors and intermodal connectors, land use compatibility, freight impact on area traffic congestion, and facility design and operations.
Increasing terminal times in locations where truck circulation, parking, or loading is more challenging due to development density and land cost.
Considering use of special generator zones for major warehousing facilities such as freight villages.
Applying time-of-day adjustments to reflect both the goods movement market propensity to avoid congested times as well as policies developed to further encourage off-peak period deliveries.
Site Level Planning
At the site level, additional detail is needed to ensure local development codes adequately consider goods movement. For instance, truck trip generation has typically focused on commercial uses due to the emphasis of goods distribution by commercial entities wherein the final destination is a retail store or other service (such as a hotel or a restaurant). The increase in e-commerce has increased the importance of accommodating goods movement for residential properties, particularly in denser urban areas where a high ratio of residential dwelling units to total curb space exacerbates the need for curb space management.
NCHRP Report 844, Guide for Integrating Goods and Services Movement by Commercial Vehicles in Smart Growth Environments, summarizes a wide range of strategies for accommodating goods movement demand and operations given the context-sensitivity of particularly freight-sensitive land uses with a focus on issues for areas in the process of transitioning from freight-intensive to mixed use. Figure 3 illustrates the types of development framing goods movement and livability objectives referenced in NCHRP Report 844.
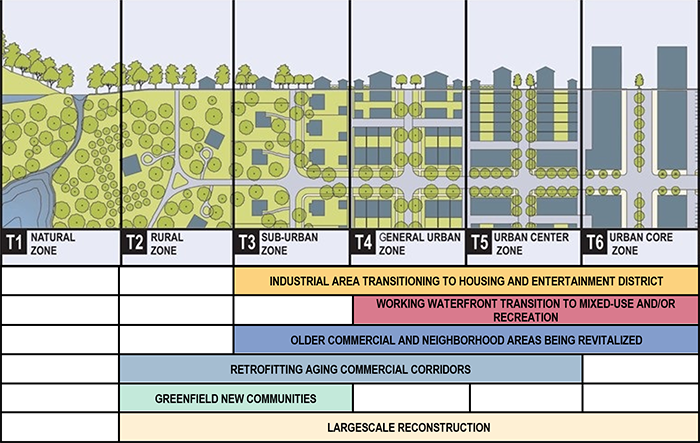
Figure 3: Relationship of Smart Growth Classification to the Rural-to-Urban Transect
Source: NCHRP Project 08-96
How-To Guide for Inventorying Freight-Generating Facilities
The improved understanding of trip generation and land use increases the importance of maintaining a good inventory of the types and locations of freight-generating land uses. As part of the SHRP2 C20 Implementation Assistance Program, the Winston-Salem MPO conducted a survey of freight facilities to support development of a tour-based truck model. Surveys of some of the identified freight nodes were conducted to verify node information as well as to gain additional insights into freight operations and characteristics. One of the additional data points that the surveys created was a correlation between daily truck trips (i.e., number of trucks entering the facility per day) and the number of truck bays present at a freight facility). This insight gave planners a technique to develop a rough estimate of truck trips that may start or end at a given facility.
This project provides a practice-ready approach for synthesizing standardized geodatabases supplemented with field data from both observed conditions (using tools such as Google Earth) and facility management surveys. This type of database provides a geographic representation of all identified freight nodes and can be classified by various descriptive variables such as facility type, category, commodity, number of truck bays, building square footage, and number of employees. The survey data helped establish or refine relationships between building square footage, full-time employment, the number of truck bays, and the number of truck trips. The process is readily transferable to agencies at State, regional, or local levels seeking better information on freight-intensive land uses. This information can be useful in identifying areas of high freight concentration for the purposes of informing land use planning, economic development, or transportation improvement priorities.
Integrating Land Use and Goods and Services Movement
The NCHRP Report 844 summarizes a wide range of strategies for accommodating demand for goods movement and operations given the context-sensitivity of particularly freight-sensitive land uses. It also focuses on issues for areas in the process of transitioning from freight-intensive to mixed use. It is expected that the topic could be added as part of a new QRFM.
In particular, Table 2.2 in NCHRP Report 844 recognizes six specific types of both new development and redevelopment that affect how goods movement may be developed or retrofitted:
- Industrial areas in transition
- Working waterfronts in transition
- Older commercial areas being revitalized
- Aging commercial corridors
- Greenfields
- Large-scale reconstruction
Table 3.1 in NCHRP Report 844 summarizes the types of strategies to best achieve goods movement objectives with minimal adverse effects, including setting the stage, creating places and streets, operating with minimal impacts, and ongoing monitoring.
NCHRP Report 844 also provides useful case studies for implementing progressive strategies. Additional research will be useful to better understand how these strategies might affect freight demand from a quantitative perspective. However, the report provides a good foundation for applying planning and freight demand management strategies within different land uses contexts.
In a similar vein, the April 2012 FHWA's Freight and Land Use Handbook was not initially considered a foundational document as it focuses more on policy and planning than on quantitative analytic solutions. This handbook would also provide broader planning concepts for the QRFM update.
Issues Associated with Unique Commodities
Most trip generation and travel forecasting processes and approaches are designed to address conditions that recur on a typical basis, such as average daily (or weekday) traffic, peak commuting hour conditions, the 30th highest hour of traffic over a given year, or the hourly or weekly trips generated by a given quantity of a certain land use type. For most long-range transportation planning purposes, seasonal variations are addressed by avoiding atypical conditions (such as holidays or snowstorms). Most goods movement references, such as NCFRP Report 37, continue to serve this need of the average demand for the typical experience. However, many goods movement demands have seasonal variations that may affect travel demand to varying degrees (Figure 4).
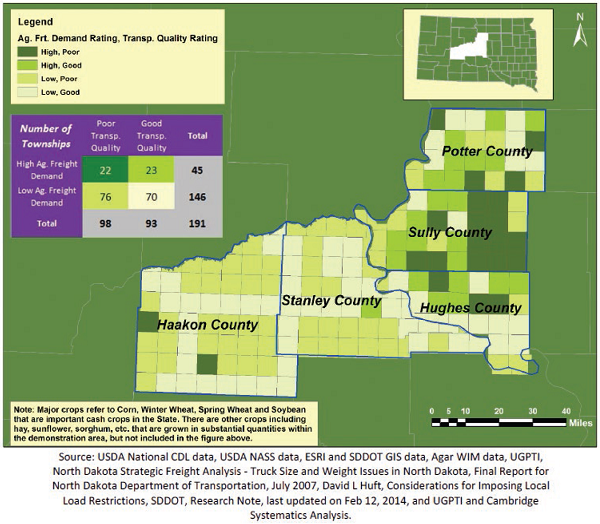
Figure 4: Example of Seasonal Estimates of Equivalent Single Axle Loads
Source: SHRP2 C20
The SHRP2 C20 program included assessments of industry-specific variability in freight demand. The South Dakota DOT Agricultural Freight Data Improvement Study (2016) included:
Innovative agricultural freight-related data sources were identified, such as the Agricultural Marketing Service, the National Agricultural Statistics Service, and the United States Department of Agriculture, that can be utilized for planning purposes over a horizon ranging from days to months, seasons, and years.
Innovative data collection methods such as unmanned aerial vehicles and smartphones offer significant promise for cost-effective means to filling large gaps in data on local roadway traffic counts and surface condition.
A compendium of conventional and unconventional agricultural freight data related to major crops and livestock facilities. The demonstration included trip generation estimates for four major crop types and two types of livestock facilities, and testing of various planning scenarios, including facility siting and public roadway closures.
The South Dakota model uses agricultural data as an input to estimate freight-related transportation demand, knitting together agricultural and transportation data sources to achieve a common baseline for analysis. The spreadsheet facilitates filling in gaps of data available in the public realm and plug-and-play using the existing spreadsheet tool with local data. This study is available at: http://nasconetwork.com/Websites/nasconetwork/files/Content/4850034/SD2014-09_Final_Report.pdf.
Freight Roadway Design Considerations
As indicated in NCHRP Report 844, the integration of goods movement and livability is increasingly relevant as many communities move away from greenfield development and segregated land uses to a greater reliance on mixing uses (facilitated by tools such as form-based zoning) and redeveloping in a more compact and transportation-efficient form. The Puget Sound Regional Council study described above demonstrated that more compact land use forms reduce both personal and goods movement VMT per capita. At the same time, these forms can bring increased total travel demand and can exacerbate design conflicts between different modes of transportation—such as trucks and bicyclists—that have very different operating characteristics. A system-wide approach to transportation with local and regional community objectives for economic development and goods movement balanced with livability can be tailored to provide more context-sensitive solutions for land use planning and transportation facility design. This can be accomplished by looking at the overall network and identifying the function of each roadway in terms of the land uses and traffic it is intended to serve so that it can be matched with appropriate context-sensitive design standards.
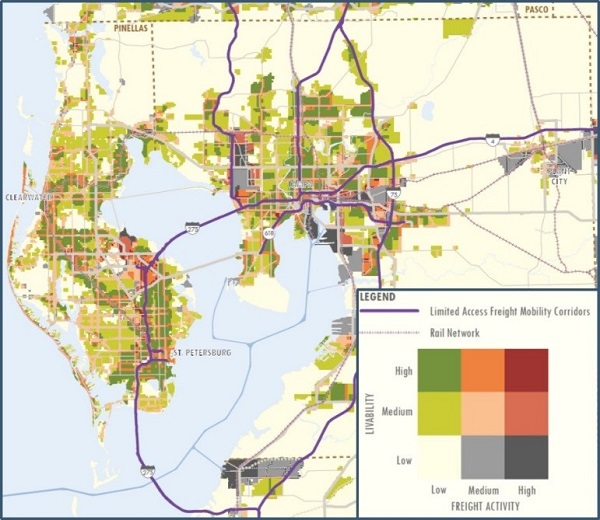
Figure 5: The Development of Transportation and Land Use Policy Can Be Informed by Both Freight-Intensive Uses and Project Freight Flows
Source: Florida DOT, District 7, FRDC
The Freight Roadway Design Considerations (FRDC) document developed by Florida DOT District 7 provides guidance to transportation planning and engineering practitioners for balancing livability and goods movement needs in a context-sensitive manner. The FRDC implements one recommended element of the 2013 Tampa Bay Regional Strategic Freight Plan available at: https://tampabayfreight.com/strategic-plan/tampa-bay-strategic-freight-plan/.
This element is to develop a new approach to the roadway design process that considers freight activity and land use compatibility analysis. The FRDC benefitted from a literature review of current practices and guidance from an internal review group and interagency coordination and commentary on draft materials throughout the development of the Tampa Bay Regional Strategic Plan. The FRDC provides guidance on identifying roadway context, understanding and clarifying design intent, and selecting among a series of design strategies to help integrate goods movement into the development of complete streets. Figure 5 illustrates the development of transportation and land use policies that can be informed by freight-intensive uses and project freight flows.
Local Transportation Impact Analysis Approaches
Currently, local jurisdictions incorporate goods movement considerations into impact analyses on a somewhat ad hoc basis. Most U.S. local jurisdictions have an established process for conducting what are conventionally termed "traffic impact studies" for new developments. These studies identify needed elements of a development's site access and circulation as well as offsite improvements to accommodate site-generated travel demand. Most jurisdictions generally follow guidance provided by the Institute of Transportation Engineers (ITE) in its 2010 Recommended Practice on Transportation Impact Analyses for Site Development (TIASD). The TIASD advises that truck impacts be considered explicitly (as contrasted with being combined with auto impacts) for land uses that would generate a significant number of truck trips (with the suggestion that separate truck analyses might be appropriate for Port/Terminal and Industrial/Agricultural land uses). This guidance applies to the various components of the site analysis, including access, loading and circulation; trip generation and distribution; and the consideration of heavy vehicle performance characteristics in the assessment of Level of Service or Quality of Service measures of effectiveness.
ITE is in the process of updating its recommended practice, which will be titled Recommended Practice on Multimodal Transportation Impact Assessment. An improved consideration of goods movement is expected to be included in the update including:
Site-level and context-sensitive trip generation.
Guidance on more specific development thresholds across non-industrial land use and transect types (such as 100 high-rise dwelling units in an urban core environment) that might warrant quantitative analysis of truck trip generation or loading zone demand.
Guidance on thresholds of development or curb space availability that might trigger the need for local agency recommendations for loading zone as part of site development approval.
You may need the Adobe® Reader® to view the PDFs on this page.
3 For more information on the FTG software tool see https://coe-sufs.org/wordpress/ncfrp33/appendix/ftg. [ Return to footnote 3 ]
4 For more information, see http://trrjournalonline.trb.org/doi/10.3141/2547-11. [ Return to footnote 4 ]