Freight and Land Use Travel Demand Evaluation: Final Report
Section 3
Topic C: Modeling Framework
Topic C covers the range of modeling tools practitioners use to conduct robust goods movement studies. The current state of the practice in all travel demand modeling tools is changing from conventional "four-step" travel demand models to Activity-Based Model (ABM) frameworks. This approach offers more flexibility to describe linked-trip behaviors and reflects a wider range of behaviors by different travelers who may have various reasons for optimizing their travel needs.
Advanced behavioral-based freight models (BBFMs) that consider supply chain and delivery systems are being developed to provide a more complete understanding of freight movement and forecasting (see Figure 7). These models are disaggregate models that incorporate supply chain procedures of firms and truck touring aspects. Advanced BBFMs contain several common components, summarized below:
- Firm synthesis, including freight production and consumption
- Commodity flows, including buyer-supplier matching and commodity flow allocation
- Transportation/logistics, including distribution channel, vehicle choice and shipment size
- Modal assignment
- Network flows, including truck touring models
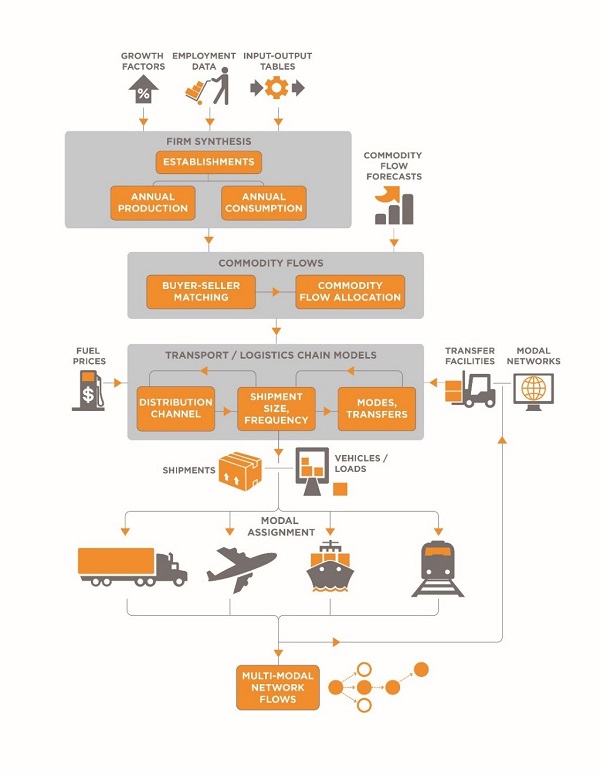
Figure 7. Behavioral Supply Chain Modeling Process
Source: RSG, University of Maryland, and Vision Engineering and Planning, 2017
Synthesis on Applying Lessons Learned from ABM to Four Step/Hybrid Models (with Focus of Land Use/Demographics as Inputs)
ABMs describe a shift from the traditional "four-step" model to one in which the decisions of individual travelers are evaluated in a probabilistic fashion. The traditional four-step model includes trip generation, trip distribution, mode split, and traffic assignment at a traffic analysis zone level for discrete but unconnected trips between a single origin and a single destination. The ABM model, however, examines continuing activity from one place to another over an extended time period, usually a typical weekday.
The primary advantage of an ABM approach is that it more realistically reflects the relationships among multiple trip purposes and locations throughout the day (i.e., a person who leaves a personal car at home when traveling to the office during the morning peak will therefore not use the personal car for a midday errand). A key constraint of the ABM approach is that it is more data-intensive than a four-step model approach. ABMs are being developed nationwide, predominantly by MPOs or State agencies that have relatively robust model development programming capacity.
The state of the practice in ABM is somewhat more advanced for person-movement than for goods movement. Several jurisdictions are making great strides in development of similar BBFMs that focus on businesses supply chains and freight movement (see Figure 8).
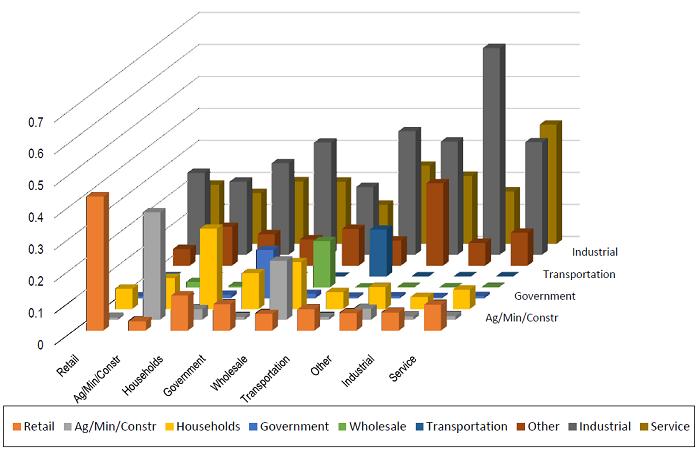
Figure 8: BBFM Representation of Industry-Specific Relationships across the PC Linkage
Source: SHRP2
The QRFM update should have a new chapter on BBFM techniques, logically situated as a modeling approach type equivalent to four-step models, commodity models, and hybrid approaches.
The challenge for the QRFM in addressing BBFM approaches will be twofold:
Highlighting the benefits of BBFM through summary materials and case studies to help promote greater dissemination of BBFM development and application technology, and
Synthesizing lessons learned from BBFM applications to help transfer key findings and quick-response approaches that might be suitable for those who are years away from applying a BBFM.
The Behavioral/Agent-Based Supply Chain Modeling Research Synthesis and Guide was developed by FHWA in parallel to this study and will help the QRFM address these objectives.
Freight Case Studies as Part of BBFM Deployment
The SHRP2 C20 process included four useful case studies on BBFM; three at the regional level (Phoenix, Arizona; Baltimore, Maryland; Portland, Oregon) and another related to statewide application (Wisconsin).
In the Phoenix region, the Maricopa Association of Governments (MAG), the Pima Association of Governments, and the Arizona DOT collaborated to develop a regional freight model that can be integrated within regional and statewide travel forecasting models to support decisionmaking and analysis across the Sun Corridor megaregion. To develop the megaregional freight model, the project team first completed a comprehensive review of freight data sources to determine what data were available and appropriate for the model.
The megaregional freight model includes independent components for firm synthesis, supply chain analysis, mode choice, and truck touring. The first two components help tailor the functional and geographic relationships among different industries. The latter two components help tailor the assignment of FTG and STG to reflect truck tours chaining several deliveries throughout the day.
The goal for the model was to better replicate the economic behaviors of establishments, shippers, and carriers by modeling travel and tour formations. The model hierarchy includes three layers, each containing one or more models:
- Financial layer: describes the production, consumption, and evolution of businesses, including a Firm Synthesis Model.
- Logistics layer: determines the transfer of goods between buyers and suppliers, including a Supplier Selection Model that generates buyers and sellers for shipments.
- Physical transportation layer: estimates truck activity for origin and destination of local goods movement using GPS data, including two models: 1) a Supply Chain Model that describes how goods are moved from origin to destination; 2) a Truck Tour-Based Model that captures any touring behavior (i.e., making multiple deliveries in a single day) by trucks in the region. Figure 9 illustrates a Truck Tour-Based Model structure used for this approach.
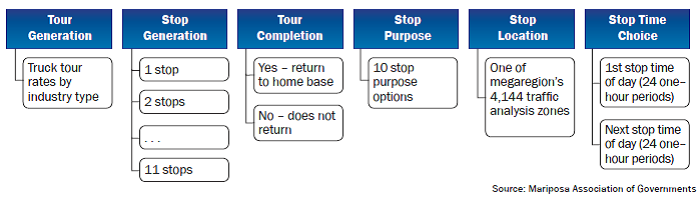
Figure 9: Truck Tour-Based Model Structure from Behavior-Based Modeling
Source: MAG
At the statewide level, the Wisconsin DOT (WisDOT) developed a proof-of-concept BBFM and compared it to the prior statewide freight model.
The WisDOT team sought to transfer the behavioral-based freight model approach developed by the Chicago Metropolitan Agency for Planning (CMAP), and identified several valuable lessons in model development and application. First, WisDOT found that some changes were needed to adjust the regional data used to validate the CMAP model to better reflect nationally available data. WisDOT also found that the BBFM improved the assessment of freight mode shift to rail for the introduction of new intermodal terminals. For routine truck touring models, however, the BBFM results were not materially different in terms of predicting truck volumes on State roadways on a statewide scale (a primary function of the statewide model). These useful lessons learned will help agencies consider the cost effectiveness of BBFMs. These advanced BBFMs may be of greatest value to metropolitan agencies evaluating a range of scenarios at a more disaggregated scale in a more urban environment where network granularity is more sensitive to the types of nuances BBFM tools provide.
Baltimore Metropolitan Council and Portland Metro Freight Modeling Systems
The Maryland State Highway Administration (SHA) and Baltimore Metropolitan Council (BMC) model is a two-agency freight model developed as part of the Freight and Commercial Vehicle Model Development project (the model work was completed in part with FHWA funding provided to SHA and BMC under a SHRP2 C20 Implementation Assistance Program grant). The SHA/BMC model included components that function at different geographical scales.
The larger, national-scale model is designed for integration with the Maryland Statewide Model (MSTM) maintained by SHA. It is a supply chain model that simulates the transport of freight between supplier and buyer businesses in the United States, focusing on movements that include Maryland. This model produces a list of commodity shipments sorted by mode and converts them to daily truck trip tables that can be assigned to the national and statewide networks in MSTM along with trip tables from the passenger model component of MSTM.
The freight truck-touring model (FTTM) simulates truck movements within the Baltimore region that deliver and pick up freight shipments at businesses. The FTTM is a tour-based model and builds a set of truck tours. These tours include transfer points at which the shipment is handled before delivery/after pick up for shipments with a more complex supply chain (i.e., a warehouse, distribution center, or consolidation center) and the suppliers and buyer of shipments where those are within the model region. The shipment list from the National Supply Chain Model (NSCM) is used as the demand input for the FTTM and describes the magnitude and location of delivery and pick-up activity in the region that must be connected by truck movements.
The commercial vehicle touring model (CVTM) for non-freight-carrying trucks simulates the remainder of the travel of light, medium, and heavy trucks for commercial service purposes (i.e., providing services and goods delivery to households and services to businesses). Like FTTM, the CVTM is a tour-based model, but demand is derived from the characteristics of the business establishments and households in the region and is not affected by the supply chain model. CVTM simulates truck and light-duty vehicle movements based on demand for services and goods from certain industries, while FTTM simulates truck tours based on commodity flows.
In Oregon, Portland Metro received a SHRP2 C20 grant and is currently developing a new behavior-based freight and commercial vehicle modeling system. The Portland Metro freight model is based on a combined supply chain and tour-based framework. This framework comprises several steps that simulate the transport of freight between each supplier and buyer business in the United States. The model has three major components:
- NSCM: Connects the Portland region with the rest of the Nation and includes global freight flows based on FAF data.
- Tour-Based Freight Truck Model: Encompasses freight delivery and pick-up movements, which converts shipments generated by the supply chain model into local truck trips.
- Tour-Based Non-freight Commercial Service Model: Generates trips based on local land uses for both commercial and residential customers.
The Tour-Based Freight Truck Model and Tour-Based Non-freight Commercial Service Model are similar to the SHA/BMC freight model described above and were calibrated using local data collected during the Portland model project.
Portland Metro developed an "establishment survey" to collect behavioral freight data that focused on travel across four counties in Portland Metro's modeling area. The survey was distributed to non-freight service providers (e.g., construction contractors) and firms associated with short-distance light- and medium-truck goods movement. GPS data for truck trips was also provided by local distribution businesses and supplemented by commercial GPS data from data vendors. Because the establishment survey collected the required data, the model allows planners to estimate the movement of service vehicles separately from typical freight vehicles.
Commodity Flow Playbook
The QRFM is designed to help practitioners quickly gain a big-picture perspective of potential resources to help address their immediate freight planning challenges. Often, the types of challenges and the range of potential resources can appear daunting. NCFRP 26, Guidebook for Developing Subnational Commodity Flow Data, is a useful approach for tackling problems that apply beyond the subnational commodity flow topic.
NCFRP 26 uses football terminology to help users construct a "game plan" from among the many plays or methods they have available to them. The game plan will be tailored to each user's specific circumstances and the problems they are trying to solve. In many cases, users will want to combine methods to take advantage of the strengths and compensate for the weaknesses of individual approaches. NCFRP 26 helps users diagnose their problem and data needs, identify their resources and skills, and explore their relationship with the private-sector freight community (the source of potentially useful data) to help craft the right game plan for their situation. NCFRP 26 provides some real-life examples of problems that planners deal with that require commodity flow data. Further, NCFRP 26 uses those examples to illustrate the thought process involved in developing an approach and selecting appropriate commodity flow data development methods.
In helping users structure a game plan for tackling commodity flow data problems, NCFRP 26 enables users to:
- Understand the nature of a problem and the types of data needed.
- Understand available capabilities and resources, including a self-diagnosis questionnaire to help identify opportunities for in-house solutions and issues that might best be addressed through interagency partnerships or consulting services.
- Follow a systematic approach for using available data and less expensive techniques to help target new primary data collection methods.
Example #2 in NCFRP 26 specifically addresses the development of an advanced freight modeling system (the subject of topic matrix C). The playbook concept could be applied to solving any freight problem and could be a useful framing tool to improve the usability of the QRFM.
Port Everglades Petroleum Commodity Flow Survey
The SHRP2 C20 project undertaken by Florida DOT also serves as a model for considering different truck types and commodity flow types in a modeling approach. This item provides an opportunity for practitioners to consider customizing more standard techniques, modifying them to apply more precisely to locally important issues.
While the Broward County last-mile analysis methodology describes the linkage between land uses, sales revenues, and observed flows, the PEV Petroleum Commodity Flow Survey focuses on aspects of data that address commodity flow forecasting and the vehicle conversion step of the process (as described in Section 5-9 of the QRFM).
Additionally, the PEV Petroleum Commodity Flow Survey summarizes the state of the practice, benefits, and limitations of a wide range of truck data collection techniques, suitable for Chapter 10 of the QRFM.
Freight Analysis Framework (FAF)
The Freight Analysis Framework (FAF), produced through a partnership between the Bureau of Transportation Statistics (BTS) and FHWA, integrates data from a variety of sources to create a comprehensive picture of freight movement among states and major metropolitan areas by all modes of transportation. Starting with data from the Commodity Flow Survey (CFS), international trade data from the Census Bureau, and data from agriculture, extraction, utility, construction, and service sectors, FAF provides estimates for tonnage and value by regions of origin and destination, commodity type, and mode for the base year and forecast years.
FAF4 data analysis and visualization tools have been significantly enhanced in the past decade, facilitating development of products that help address more directly economic outcomes of interest to decisionmakers. Figure 10 illustrates a sample visual output of FAF4 analysis, demonstrating the economic input of Florida's freight flows.
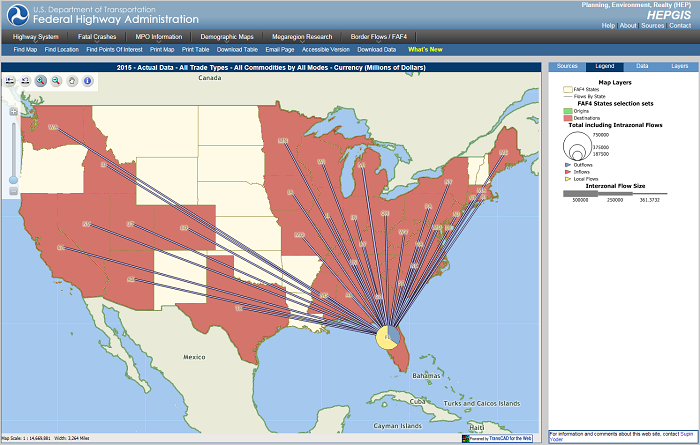
Figure 10: Example of FAF4 Data Visualization Describing Economic Impact
Source: FHWA