Peer Exchange Workshop on the "Perfect World of Measuring Congestion"
| |||||||||||||||||||||||||||||||||||||||||||||||||||||||||||||||||||||||||||||||||||||||||||||||
| All “ribbon levels” typically use travel time-based or delay performance measures, including total delay, delay per mile, travel time index, planning time index, etc. Measures are computed at the spatial and temporal scales of interest. | ||||
| Perf. Measures (Content): | → Limited, project-specific “after” study; snapshot of outcome measures (averages) (e.g., GA TRIP evaluation, CA Traffic Signal Program) | → Only required (“siloed”) reporting | → Family of output and outcome measures in some areas of organization | Full/seamless family of output/outcome measures across organization; real-time link (and decision-making) between project-level and system reporting; averages and reliability |
|---|---|---|---|---|
| Perf. Mgmt (Culture): | → Minimal perf mgmt interest; performed only as required | → Isolated champions of perf mgmt; nothing coordinated across any agency “silos” | → Evidence of entire portions of agency implementing and making decisions with perf measures; evidence of “data-informed” process to select projects (e.g., WA Gray Notebook) | Perf mgmt is ubiquitous in agency culture; entire agency speaks “perf mgmt language” – it feeds mgmt decision-making; “data-driven” decisions using real-time information |
| All “ribbon levels” typically use speed, volume and roadway inventory information at spatial and temporal scales of interest. As the industry matures to the “platinum level,” real-time performance management and decision-making are possible. | ||||
| Data: | → “Siloed” datasets; no connections | → Dataset connections possible – requires programming/processing (e.g., TTI UMR, FHWA’s UCR) |
→ Evidence of some coordination of datasets across traditional agency “silos” (e.g., I-95 Corridor Coalition Future Performance Activities) |
Connected with other agency datasets (volume, crashes, pavement, etc.); graphical user interface (GUI) to visualize/query data for decision-making |
| Modes: | → Mode areas are “siloed” in agency; limited communication | → Some ability to capture/estimate mode shifts within “silo” of interest | → Ability to capture mode shifts across entire agency | Ability to capture mode shifts over time and across the agency, including intermodal considerations (freight and person) |
| Facility and Trip Coverage: | → Limited temporal/ spatial coverage in “silos” | → Selected modes/facilities and temporal coverage (e.g., TX 100 Roadways, IN/MD Mobility Reports) | → All modes, all facilities, all days, all times covered | In addition to gold level, ability to capture diversion from traveler info or control strategies |
| Traveler Preferences/ Tradeoffs: | → Limited ability to capture trip preferences or revealed behavior (e.g., new Google Maps® preferences feature) | → Some ability in selected agency “silos” to capture some trip preferences | → Technological methods identified/used to capture trip preferences or revealed behavior | Agency ability to gauge or capture traveler preferences and revealed behavior (i.e., how you traveled and How/where you really wanted to travel) |
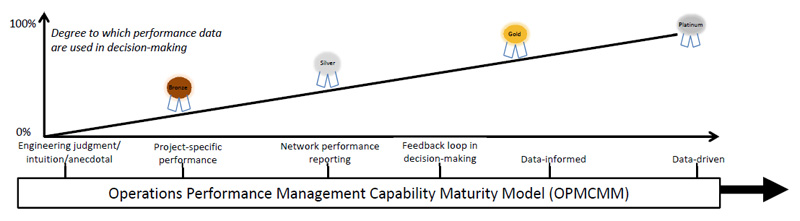
Figure 1. Illustration of Proposed Operations Performance Management Capability Maturity Model for Gauging Current Practice
The ultimate goal of measuring congestion is improved transportation investment decision-making. Initially, performance measures provide a baseline of conditions, and, over time, allow for trend analyses of what types of transportation investments are working and where. These performance insights inform future investment decisions for transportation projects, programs and strategies.
An evaluation of the current practice in measuring congestion provides evidence that there are varying degrees to which performance data are used in transportation investment decision-making. This varied nature of the profession is captured in Figure 1 (the OPMCMM). Current practice can be viewed on a scale of increasing performance management maturity, and from left to right in Figure 1, there is increased maturity in performance management. At the left end of the scale there is a minimal degree of performance data used in decision making, and this improves as the reader tracks their eyes to the right along the graphic at the top of Figure 1. For perspective, the graphic identifies four (4) “ribbon categories” (bronze, silver, gold, and platinum) from left to right as the degree of performance data are used in decision-making.
Just below the graphic at the top of Figure 1 are short characterizations to describe the OPMCMM continuum. While there are four (4) ribbon categories, there are six (6) general short-description observations related to data in decision-making along the maturity continuum. At the far left where there is zero performance data used in decision-making, decisions are made with engineering judgment, are highly intuitive and/or based on anecdotal evidence. Progressing to the right are specific projects, characterized by a “snapshot” of performance for a project evaluation that is not really connected to system-wide performance activities. As one progresses along the maturity scale, network performance reporting is encountered. Moving further along the maturation scale, the next step includes a feedback loop in decision-making (i.e., an evaluation process is in place after decisions are made to evaluate the decision and the process). The next steps include data-informed decisions – not entirely data-driven, but data play a key role – and are then followed by data-driven decisions from performance data (in near real-time or real-time).
This section of the paper describes the following characteristics of the performance management maturity scale highlighted in Figure 1:
Selected examples of different characteristics and ribbon levels are also provided in the following section.
All ribbon levels typically use travel time-based or delay performance measures (e.g., total delay, delay per mile, travel time index, planning time index, etc.). Measures are computed at the spatial and temporal scales of interest.
Equally important to the measures themselves is the culture of the transportation agency in adapting performance management into their decision-making processes; therefore, the OPMCMM includes this characteristic.
All ribbon categories along the maturity scale typically use speed, volume and roadway inventory data at spatial and temporal scales of interest. As the industry matures to the “platinum level,” real-time performance management and decision-making are possible.
This characteristic of the OPMCMM relates to an agency’s ability to understand multimodal and intermodal trip characteristics.
The geographic scope of travel is captured in this characteristic.
The final characteristic identified in Figure 1 relates to an agency’s ability to capture traveler preferences and tradeoffs.
The platinum level as defined here is admittedly far off; however, it is important to keep an eye on the fact that as transportation professionals better understand traveler trip preferences, this will help them develop the system for all users.
There are several examples provided in Figure 1 to help the reader identify where some selected current practice and activities might fall on the OPMCMM framework. These examples are only intended to start a discussion about how the OPMCMM can be used to grade different types of agency performance management activities.
There are numerous examples of performance activities at the bronze level, characterized by project-specific studies. Below are a few transportation operations examples recently highlighted in FHWA’s 2012 Urban Congestion Trends Report.2 These types of evaluations are project specific and provide a snapshot of performance. Table 1 includes examples of performance measures (content and form) at the bronze level.
| Towing and Recovery Incentive Program (TRIP) (Atlanta, Georgia) | |
|---|---|
| Description | TRIP provides monetary incentives for timely clearance of crashes involving commercial vehicles. A recent Georgia Department of Transportation (GDOT) study evaluated TRIP, and found that it allowed roadway opening at least 2 hours and 45 minutes faster than in 2007 (before TRIP). Other key findings were that TRIP decreased average incident cost by 70 percent, saved over $9 million in delay, wasted fuel and emissions from inception to 2009, and results in a benefit of nearly $11 for each $1 spent. |
| Data | Modeling of “pre-TRIP incidents” using clearance times to estimate benefits if TRIP were in place. |
| Measures | Costs of delay, wasted fuel, emissions, benefit-to-cost ratio. |
| Traffic Light Synchronization Program (California) | |
| Description | Caltrans recently funded the Traffic Light Synchronization Program (TLSP) at $250 million from successful passage in November 2006 of California’s Proposition 1B (Transportation). Several projects have been implemented and have either met or exceeded estimated benefits. Two examples of benefits are in San Ramon, CA where ASCTs were installed on Crow Canyon Road and Bollinger Canyon Road. Both locations resulted in reductions in travel time, fuel consumption, emissions and collisions. |
| Data | Data sources include travel time from travel time runs, traffic volume measurement, and database of crashes. |
| Measures | Travel time, total delay, stopped time, congested time, fuel consumption, and emissions. Fuel consumption and emissions were estimated from SYNCHRO software. |
Table 2 includes an example of performance management (agency culture) at the gold level of the Washington State DOT’s Gray Notebook.
| WSDOT’s Gray Notebook | |
|---|---|
| Description | The Washington DOT’s Gray Notebook (GNB) is the basis of WSDOT’s external performance reporting. It is recognized nationally for setting a high standard for accessible and accurate updates on programs and projects. The report is released quarterly with sections clearly related to the six statewide transportation policy goals of safety, preservation, mobility (congestion relief), environment, economic vitality and stewardship. |
| Data and Measures | The report uses a number of data sources and performance measures across the six policy goal areas. WSDOT’s Performance Dashboard (page vii of the GNB Edition 50) highlights key mobility measures as annual weekday vehicle-hours of delay, average clearance times for major incidents, percentage of ferries departing on time and percentage of Amtrak Cascades trips arriving on time. |
Table 3 includes examples of the “data” characteristic at the silver level of TTI’s Urban Mobility Report and FHWA’s Urban Congestion Reports.
| TTI’s Urban Mobility Report | |
|---|---|
| Description | The Urban Mobility Report reports congestion in all U.S. urban areas. In the 2012 Urban Mobility Report, trend data are available from 1982 to 2011. Detailed congestion statistics are provided for 101 urban areas, and summary statistics are provided for the 498 urban areas throughout the U.S. Statistics are presented in tables by urban areas population size. The report is widely quoted on congestion and associated costs. |
| Data | The Urban Mobility Report is powered by huge datasets, including: 1) FHWA Highway Performance Monitoring System (HPMS) volume data, 2) INRIX 15-minute annual average speed data (850,000 miles of road), 3) FHWA Freight Analysis Framework commodity value and tonnage for trucks. |
| Measures | Delay per auto commuter, total delay, travel time index, excess fuel per auto commuter (gallons), congestion cost per auto commuter (wasted time and fuel), truck congestion cost, truck delay, planning time index, carbon dioxide production, truck commodity value, commuter stress index, and total peak period travel time. |
| FHWA’s Urban Congestion Reports | |
| Description | The Urban Congestion Report is produced quarterly to characterize emerging traffic congestion and reliability trends at the national and city level. The reports currently include 19 urban areas in the U.S. |
| Data | State DOT archived traffic operations data. Data for those roadways that are instrumented with traffic sensors for the purposes for real-time traffic management are included in the dataset. |
| Measures | Congested hours, travel time index, planning time index. |
Table 4 includes an example of the “data” characteristic at the gold level of a future performance activity with the I-95 Corridor Coalition.
| I-95 Corridor Coalition Future Performance Activities | |
|---|---|
| Description | One example that incorporates some aspects of this level is the planned performance measurement activities of the I-95 Corridor Coalition. The Coalition’s website discusses the ongoing development of “a corridor-wide, web-based visual analytics monitoring system for identifying major bottlenecks, reporting travel time reliability and displaying other congestion measures using private-sector vehicle probe data fused with agency incident/event data where available. This system demonstrates how states can create a congestion monitoring program using a variety of data sources.” The system will allow the users to view both real-time and historical performance at various zoom levels |
| Data | Real-time INRIX speed data and agency incident/event data (where available) |
| Measures | Travel time index, travel time reliability, hours of congestion per mile and buffer index |
Table 5 includes an example of the facility and trip coverage characteristic at the silver level including TxDOT’s 100 Most Congested Roadways List.
| TxDOT’s 100 Most Congested Roadways List | |
|---|---|
| Description | Since 2009, Texas DOT has sponsored TTI to produce a list of the most congested roadway sections in the state on the TxDOT website. The two agencies have developed an approach that combines annual speed archive data from private companies with basic roadway geometry, and traffic counts published in the TxDOT statewide roadway inventory file (RHiNo) to calculate congestion-related performance measures. The list is used for Texas DOT to program dollars to address the worst traffic locations across the State. |
| Data | Annual average traffic speeds from private-sector company and basic geometry and traffic volume from TxDOT roadway inventory. |
| Measures | Annual hours of delay per mile, annual hours of truck delay per mile, Texas congestion index (form of travel time index), planning time index, commuter stress index, annual congestion cost, and truck congestion cost. |
The Indiana Mobility Report7 and the Maryland State Highway Mobility Report8 also represent examples of the facility and trip coverage characteristic at the silver level. Both reports use private-sector speed data to estimate mobility performance measures. Both reports include evaluations and mobility improvements due to specific projects in the state; therefore identifying the mobility benefits of specific transportation investments to further inform future decision-making.
The 2013 Maryland State Highway Mobility Report goes a step further by integrating the speed data with volume information to compute delay and associated wasted time and fuel costs due to congestion (using the same methodology as TTI’s Urban Mobility Report). Maryland’s Report also includes the planning time index reliability measure.
Google Maps® has a new preferences feature that allows you to make maps of places that matter to you, allows you to save places to find them quickly later, and allows you to rate places you know to discover new places you might like. This is just an example of the types of Internet tools that can provide information about the types of places people want to go and perhaps how they choose to get there. Market tools and technologies will continue to evolve that can help agencies better understand traveler preferences and where travelers really want to go.
1 http://onlinepubs.trb.org/onlinepubs/shrp2/SHRP2_S2-L06-RR-1.pdf ↑
2 https://ops.fhwa.dot.gov/publications/fhwahop13016/index.htm ↑
3 http://www.wsdot.wa.gov/Accountability/default.htm ↑
4 http://mobility.tamu.edu/ums, https://ops.fhwa.dot.gov/perf_measurement/ucr/index.htm ↑
5 http://www.i95coalition.org/i95/Default.aspx ↑
6 http://www.txdot.gov/inside-txdot/projects/100-congested-roadways.html ↑
7 http://docs.lib.purdue.edu/imr/4/ ↑
8 http://www.roads.maryland.gov/OPPEN/2013_Maryland__Mobility.pdf ↑
You may need the Adobe® Reader® to view the PDFs on this page.
|
United States Department of Transportation - Federal Highway Administration |
||