2012 Urban Congestion Trends
Operations: The Key to Reliable Travel
Contact Information: Operations Feedback at OperationsFeedback@dot.gov.
Printable version [PDF 2.9MB]
You may need the Adobe® Reader® to view the PDFs on this page.

Congestion levels remained relatively unchanged from 2011 to 2012 in the 19 urban areas in the United States monitored in this report.
Congestion levels across all of the congestion measures are still generally below the levels experienced in 2007, prior to the economic downturn. As the economy improves, increased congestion levels are expected.
While congestion levels remained relatively unchanged (or decreased slightly) from 2011 to 2012, the use of congestion-mitigating techniques will become important to manage future increases in traffic and congestion. The use of operational strategies, in particular, provides a toolbox of alternatives that can be implemented to mitigate growing congestion. Transportation agencies and professionals should use this time to implement operational strategies (and/or fine-tune existing operational strategies) prior to congestion levels likely increasing in an improving economy.
The benefits of successful operational strategies are multiple—faster, more reliable trips, improved safety, and reduced environmental impacts. This report highlights several case studies where operational strategies have been successfully implemented. The first two case studies identify how reporting and monitoring can improve stakeholder decision making. Proactive reporting and monitoring ensure that transportation improvements are designed to get the best return on the investment.
Congestion Facts
- All three congestion measures—daily hours of congestion, time penalty for each trip, and worst-trip time penalty—have decreased or remained the same.
- Congestion has decreased in all but six of the monitored regions to some degree.
- The time penalty for a trip on an average day decreased or remained unchanged for 12 of the 19 monitored regions.
- Travel time on the worst day per month decreased or remained unchanged for 12 of the 19 monitored regions.
- Congestion is generally lowest during the summer vacation season as evidenced by trip times.
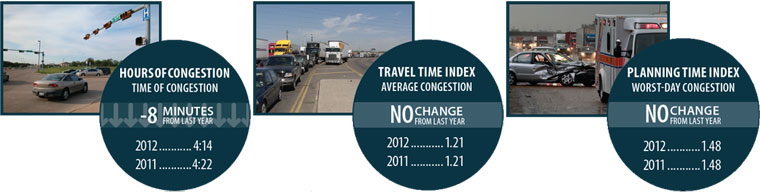
Congestion Measures
- Hours of congestion—amount of time when freeways operate below 50 mph.
- Travel Time Index (TTI)—time penalty for a trip on an average day. A TTI of 1.30 indicates a 20-minute free-flow trip takes 26 minutes (20 × 1.30) in the rush hours.
- Planning Time Index (PTI)—time penalty for a trip to be on time for 95 percent of trips (i.e., late for work on one day per month). A PTI of 1.60 indicates a 20-minute free-flow trip takes more than 32 minutes (20 × 1.60) only one day per month.
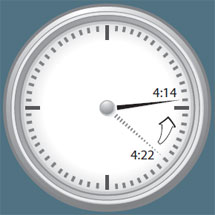
Hours of Congestion Each Day
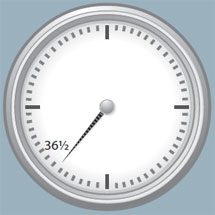
Time Penalty Each Trip
Worst-Trip Time Penalty
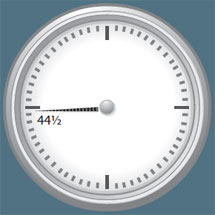
The clock hands show the time wasted in 2011 (dashed) and 2012 (solid).
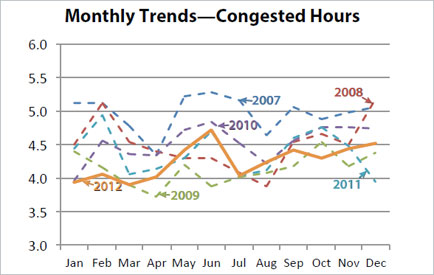
Congested time decreased 8 minutes from 2011 to 2012, from 4:22 to 4:14.
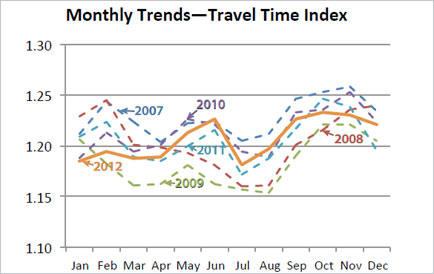
The time to make a trip that takes 30 minutes in free-flow conditions remained the same from 2011 to 2012 at 36.5 minutes.
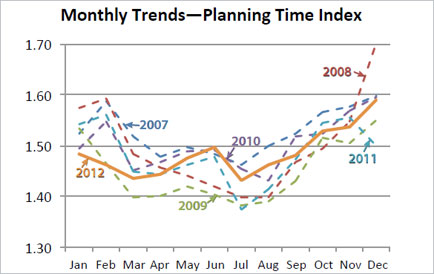
Travel time on the worst day of the month (for a 30-minute trip) remained the same from 2011 to 2012 at 44.5 minutes.
Data from traffic operations centers and private-public partnerships were provided to the Federal Highway Administration from the following regions: Boston, MA; Chicago, IL; Detroit, MI; Houston, TX; Los Angeles, CA; Minneapolis-St. Paul, MN; Oklahoma City, OK; Orange County, CA; Philadelphia, PA; Pittsburgh, PA; Portland, OR; Providence, RI; Riverside-San Bernardino, CA; Sacramento, CA; St. Louis, MO; Salt Lake City, UT; San Diego, CA; San Francisco, CA; and Tampa, FL.
Using Operations to Solve Congestion Issues
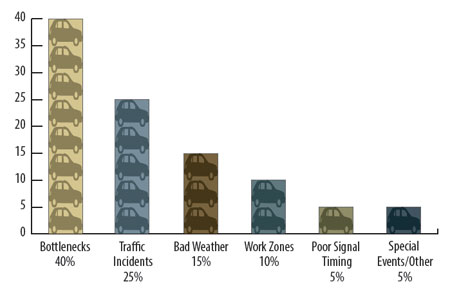
What Causes Congestion?
If you ask someone what causes traffic congestion, most people will probably respond "too many cars" or "a crash," but there is a lot more to it than just that. "Too many cars" (bottlenecks) and "crashes" (one type of incident) are estimated to cause about 65 percent of the congestion problem (see figure). Work zones, bad weather, poor signal timing on streets, and special events also contribute to the congestion problem. All of these causes impact mobility and reliability of the transportation system for travelers and goods movement.
Do You Want to Get There on Time?—Better Operations Can Help!
We have all had the experience of encountering a crash or bad weather on a trip that typically takes 20 minutes and turns it into an hour-long slog. Below are just a few ways that better operations can improve typical congestion causes:
- Bottlenecks—implementing strategies such as express or toll lanes and active traffic management techniques to get the most out of existing capacity.
- Traffic incidents—quickly identifying, responding to, and clearing incidents and providing traveler information to motorists during incidents.
- Bad weather—keeping roadways cleared during snowstorms.
- Work zones—performing road improvements in ways to minimize traffic impacts during peak periods.
- Signal timing—improving timing on streets to reduce travel time and delay.
- Special events—providing traveler information to motorists.
How Can Mobility Monitoring Improve System Reliability?
Mobility monitoring is the process of identifying transportation system performance and trends to inform policy and decision making. Mobility and reliability measures are identified that communicate well to both technical and nontechnical audiences. The process of mobility monitoring allows transportation agencies to answer critical questions over time, such as:
- Where and when is the transportation system congested and/or unreliable?
- What operational improvements are working and where?
- What transportation improvements are needed and where?
The case study on the next page describes some mobility reporting and monitoring efforts to answer questions such as these to inform policy and decision making.
For More Information:
www.fhwa.dot.gov/congestion/describing_problem.htm
Mobility and Performance Reports—Indiana and Maryland
A number of agencies are measuring highway characteristics and reporting mobility and/or reliability information to characterize the roadway system and show the public and decision makers the benefits of transportation investments. Two recent examples are highlighted.
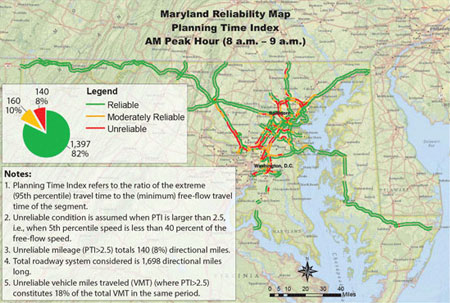
2012 Maryland State Highway Mobility Report
This report highlights the performance of the State highway system and details the Maryland State Highway Administration's (SHA's) mobility efforts in calendar year 2011 in four key areas: mobility and reliability, incident management and traveler information systems, multi-modalism and smart growth, and freight. The study authors used archived private company vehicle probe data and ranked the most congested and most unreliable corridor segments and bottlenecks for the freeway/expressway system. SHA intends to look at congestion trends and gear policies/programs and projects to address the State's mobility needs with a data-driven approach.
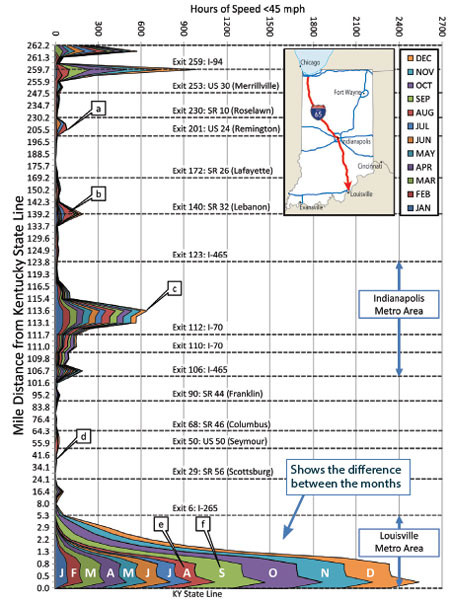
2011 Indiana Interstate Mobility Report
The Indiana Department of Transportation (INDOT) sponsored the inaugural 2011 Indiana Interstate Mobility Report to characterize the operational performance on 943 centerline miles of Indiana interstates (I-64, I-65, I-69, I-70, I-74, I-94, and I-465) using archived private company data. The report provides a "baseline" of mobility characteristics for freeways. The information is used for prioritization of future capital projects and quantification of the impact of completed projects.
Location of I-65 Southbound Congestion Hours Color Coded by Month
- Construction work zone associated with guardrail and under-drain maintenance.
- Construction work zone associated with reconstruction near Lebanon.
- Congestion in downtown area of Indianapolis. Notice the relatively uniform magnitude of delay for each month. This is an example of recurring congestion on I-65 inside the I-465 loop.
- Rural segment with minimal congestion.
- Congestion associated with travel to Louisville during the months of June, July, and August, which was relatively uniform.
- On September 9, a section of I-64 was closed, resulting in significant diversion of traffic from I-64 to I-65.
For More Information:
www.roads.maryland.gov/OOTS/2012_Maryland_State_HIghway_Mobility_Report.pdf (Maryland)
docs.lib.purdue.edu/imr/ (Indiana)
Success Stories in Operational Improvements
The following success stories highlight innovative ways States and communities throughout the United States have reduced congestion through effective operations. These case studies focus on project prioritization and the evaluation of operational strategies.
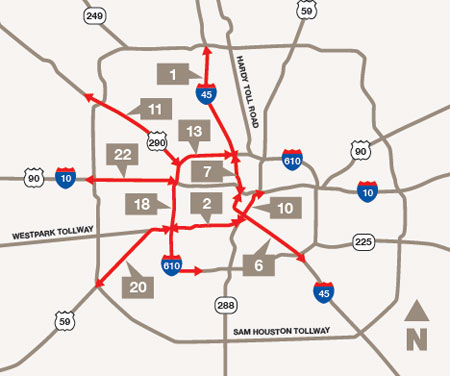
Mobility Investment Priorities Project—Texas
The population in Texas is growing, and transportation revenue sources are shrinking, creating a gap between mobility needs and solutions. The Mobility Investment Priorities project is designed to assist State leaders in their efforts to close that gap.
The Investment
Recognizing the growing urgency of the congestion problem, the 2011 Texas Legislature set aside $300 million to get the State's highest-priority roadway projects moving. As part of that effort, the Legislature directed the Texas Department of Transportation (TxDOT) and local agencies to do two things:
- Advance those projects that can do the most to improve mobility and strengthen local economies in the most congested regions—Houston, Dallas-Fort Worth, Austin, and San Antonio—using the best practices in traffic and demand management, as well as new construction projects.
- Identify the most publicly acceptable options to pay for the State's most urgent congestion-relief projects.
The Return
The Mobility Investment Priorities project is changing the way decisions are made at TxDOT and metropolitan planning organizations around the state. Money is being invested based on the largest needs—as identified in the 100 Most Congested Roadways list.
Graphic showing the congested segments (and rankings) in Houston.
For More Information:
www.txdot.gov/inside-txdot/projects/100-congested-roadways.html
mobility.tamu.edu/mip/
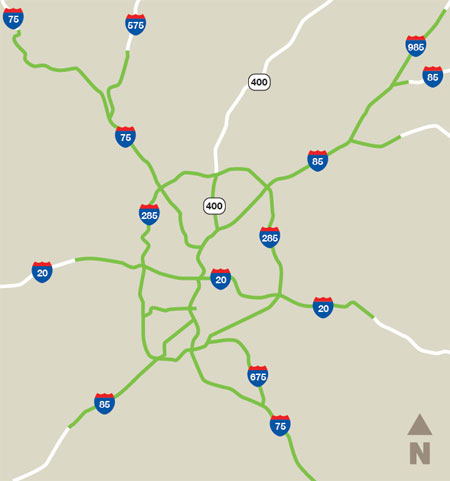
Towing and Recovery Incentive Program (TRIP)—Atlanta, Georgia
Traffic Incident Management
Collisions are rapidly removed by tow trucks and service vehicles. (Benefits: less unexpected delays, saved fuel, and reduced emissions)
The Investment
The Towing and Recovery Incentive Program provides monetary incentives for timely clearance of crashes involving commercial vehicles. The Georgia Department of Transportation (GDOT) began TRIP in 2008 as part of the metropolitan Atlanta traffic incident management program. Towing operators must be certified, and they are compensated if they arrive at the incident and open lanes within time limits set up in the program.
The Return
A recent GDOT-sponsored study evaluated TRIP. Twenty-four incidents from 2007 (before TRIP) were identified that would have likely used the program. It was found that TRIP:
- Allowed roadway opening at least 2 hours and 45 minutes faster than in 2007.
- Decreased average incident cost by 70 percent (conservatively), from $643,000 to $187,000. (To conservatively estimate this benefit, analysts assumed the trip would have taken 60 minutes longer although research shows an average of 2 hours and 45 minutes for average clearance.)
- Saved over $9 million in delay, wasted fuel, and emissions since inception through 2009.
- Results in a benefit of nearly $11 for each $1 spent.
Map showing the limits of the TRIP program in the Atlanta metro area.
For More Information:
www.timetaskforce.com/documents/TRIP/TRIP%20STUDY%20v%201%200%202011-02-04.pdf
Traffic Light Synchronization Program—California
Adaptive Signal Control Technologies
Traditional arterial signal systems operate with fixed timings based upon expected volumes during certain portions of the day. ASCTs can adjust to handle varying traffic conditions that may differ from fixed-time operations to improve traffic flow. (Benefits: reduced congestion and delay, fewer stops, reduced fuel consumption, and improved trip reliability)
The Investment
The successful passage in November 2006 of California's Proposition 1B (Transportation) authorized $19.9 billion of State general obligation bonds for a number of transportation projects and programs. One such program from Proposition 1B is the Traffic Light Synchronization Program (TLSP), funded at $250 million. The California Department of Transportation (Caltrans) is required to report quarterly to the California Transportation Commission (CTC) on local agency progress for the Proposition 1B funds. Several projects have been implemented and have either met or exceeded estimated benefits.
The Return
Two examples of the benefits of TLSP are in San Ramon, CA. Adaptive signal control technologies (ASCTs) were installed on Crow Canyon Road and Bollinger Canyon Road. The projects resulted in a number of benefits related to travel time, fuel consumption, emissions, and collisions as a result of the signal improvements (see graphic).
|
Crow Canyon Rd. |
Bollinger Canyon Rd. |
| ROADWAY CHARACTERISTICS |
|
| Length |
0.6 miles |
0.6 miles |
| No. of Signals |
5 |
5 |
| Signal Spacing |
700 to 900 feet |
350 to 1,000 feet |
| PERFORMANCE MEASURES |
|
| Travel Time Reduction |
43%
 |
35%
|
| Fuel Consumption and Emission Reduction |
44%
|
44%
|
| Collision Reduction |
No Change |
32%
|
For More Information:
www.bondaccountability.dot.ca.gov/bondacc/MainMenuAction.do?%3E&page=1000027
SR 167 HOT Lanes, between Renton and Auburn, WA
High-Occupancy Toll Lane
Using a designated lane to provide travel time savings to bus riders, carpoolers, or toll-paying customers. (Benefits: faster, more reliable trips)
The Investment
In 2008, the Washington State Department of Transportation opened the first high-occupancy toll (HOT) lanes in Washington State as a pilot project along SR 167 between Renton and Auburn. There are two general-purpose (GP) lanes and one limited-access HOT lane in each direction (11 miles northbound and 9 miles southbound). The HOT lanes provide a reliable trip to 2+ carpools, buses, emergency vehicles, and motorcycles for free, while charging solo drivers with a Good to Go! pass an electronic toll if space is available. Tolls vary from $0.50 to $9, depending on traffic conditions, and are updated every 5 minutes to maintain a reliable trip for high-occupancy vehicles.
The Return
The project has greatly improved mobility in the corridor. The following are average results for all four years of the pilot project operation for the peak hours from Tuesday to Thursday (northbound 7–8 a.m. and southbound 4–5 p.m.):
- Average peak-hour volume in the HOT lanes has more than doubled, and average general-purpose peak-hour volume has decreased 5 percent since the pilot project began.
- Average general-purpose peak-hour speeds have increased (northbound from 42 mph to 56 mph; southbound from 44 mph to 51 mph). Average peak-hour speeds in the HOT lane have remained at 60 mph.
- The HOT lanes on average save approximately 8 minutes northbound (average toll of $2) and 5 minutes southbound (average toll of $1.50) compared to the general-purpose lanes.
- The HOT lanes provide a much more reliable trip as the average 95th percentile travel times are the same or similar to average travel times (see graphic).
|
Northbound
Peak Hour, 7–8 a.m.
(Tuesday to Thursday) |
Southbound
Peak Hour, 4–5 p.m.
(Tuesday to Thursday) |
| GP |
HOT |
Difference |
GP |
HOT |
Difference |
Average Travel Time
(Minutes) |
19 |
11 |
8
 |
13 |
8 |
5
|
Average 95th Percentile Travel Time
(Minutes) |
26 |
12 |
14
|
21 |
8 |
13
|
Results are the average value of all four years of the pilot project operation.
For More Information:
www.wsdot.wa.gov/NR/rdonlyres/2DA072CA-7D4A-4876-A58B-64DBE152D48D/0/SR167_AnnualPerformanceSummary_080812_web.pdf
Performance Management and Operations
Moving Ahead for Progress in the 21st Century Act (MAP-21)
MAP-21 was signed into law in July 2012 providing over $105 billion for fiscal years 2013 and 2014 for surface transportation. Performance management is a key element of MAP-21, and national performance goals are set for the following areas: 1) safety, 2) infrastructure condition, 3) congestion reduction, 4) system reliability, 5) freight movement and economic vitality, 6) environmental sustainability, and 7) reduced project delivery delays.
The Federal Highway Administration (FHWA) has established a website (www.fhwa.dot.gov/map21/) that includes a MAP-21 Q&A, fact sheets, and guidance document sections to help transportation agencies better understand the contents of MAP-21 for successful implementation.
Performance Management—The Future of Measures
In the 21st century, public agencies frequently are being asked to do more with less, and performance management is seen as one tool to help accomplish this objective. To this end, FHWA has established a transportation performance management website (www.fhwa.dot.gov/tpm/). The MAP-21 legislation underscores the importance of performance measures in the transportation decision-making process. Additionally, transportation improvements are now more diverse than simply adding roadway capacity, and include high-tech approaches like active traffic management and dynamic pricing/tolling, as well as multimodal and demand management approaches such as smart growth, telecommuting, and on-demand car and ride sharing. Evaluating and comparing these different approaches "on a level playing field" will continue to be a challenge, and the performance measures and management process will evolve as agencies gain more experience.
Transportation mobility and efficiency are explicit goals for practically all transportation agencies—that is, moving people and goods quickly and efficiently. However, transportation agencies are being challenged to consider these mobility goals in a context-sensitive way, and in a way that levels the playing field for non-auto modes and multimodal solutions. For example, the primary function of fully access-controlled highways is mobility and speed of person movement. However, urban streets provide many other functions for a wider mix of users (e.g., transit users, bicyclists, and pedestrians), and performance management should consider more than just mobility and speed measures.
The increasing presence of smart phones, mobile computing devices, and eventually connected vehicles does offer the potential for dramatically more data to measure transportation system performance. Eventually, performance data could become widely available for all modes and all roads. In addition to average speeds and travel times, other possible data include day-to-day trip reliability, trip origin and destination, and traveler satisfaction. As agencies pursue these emerging data sources, they will need to address traveler privacy concerns through anonymization and opt-in incentive programs.
Contact Information
For more information on this report, contact Rich Taylor (Rich.Taylor@dot.gov).
Visit the Urban Congestion Report website for quarterly congestion trend updates: www.ops.fhwa.dot.gov/perf_measurement/ucr/index.htm.
April 2013
FHWA-HOP-13-016