Peer Exchange Workshop on the "Perfect World of Measuring Congestion"
Workshop Summary Report
APPENDIX C: WHITE PAPERS
Paper #2: Advancing Best Practices in Performance Monitoring: How and Where to Take the Next Steps?
Prepared for:
Peer Exchange Workshop on the “Perfect World of Measuring Congestion”
FHWA Office of Operations
Prepared by:
Texas A&M Transportation Institute and Battelle
FINAL
December 10, 2013
1. Introduction
This is one of four papers prepared for the Peer Workshop on Operations Performance Measures to be held on December 17-18, 2013 in Washington, D.C. The objective of this paper is to describe ways in which best practices in performance monitoring (in terms of data types, coverage, measures, etc.) could be further improved in the next 5 to 10 years. This paper is intended to stimulate discussion at the December Peer Workshop and is not intended as an exhaustive treatment of this topic area. In fact, workshop participants are encouraged to add their own ways to advance best practices in performance monitoring and management.
This paper will use the same six categories as Paper #1, which are:
- Performance measures;
- Performance management (agency culture);
- Data;
- Modes;
- Trip and facility coverage; and
- Traveler preferences and tradeoffs.
For each of these six categories, several speculative ideas are presented for discussion that could advance best practices within that particular category.
2. Category 1: Performance Measures
This category refers to the types of performance measures, as well as the measures themselves. Also included in this section are calculation procedures and input parameters.
User-centric (trip-based) view of performance/congestion: Trip-based measures have been proposed as a way to better connect with individual experiences. Many traveler information interfaces have the ability to build and customize common travel routes. So in addition to facility- and system-based measures, would a “personal congestion calculator” on public agency performance reporting sites aid in building credibility with the general commuting public? With the increasing coverage of network-wide travel times, this could be fairly easy to program. But does it help with public comprehension and understanding? Standardized or consensus definition of delay: Clearly defined user delay calculation procedures could help to ensure consistency among publicly reported performance statistics. For example, imagine the confusion that would result if each state climatology department defined a different temperature scale. Minnesotans might define 10° F as freezing cold, whereas Floridians might define freezing cold at 50° F. Should user delay be treated as a physical property like temperature, and then targets be used to capture the desired goal or user perception? Even in our example, the only way that “freezing cold” is comparable between the two states is because of the consensus temperature measurement scale of Fahrenheit. Standardizing measure calculation details: As with clearly defining delay, it would be helpful to clearly define data processing and calculation details to ensure consistency among reported performance measures. For example, it has been shown that time mean speed calculations provide different results than space mean speed calculations. It has also been shown that “snapshot” travel times provide different results than “simulated traversal” travel times. Similarly, the calculation of reliability measures uses percentiles from a travel time distribution—but what range of dates and times should be included in the distribution? Market segmentation/differentiation of value of user delay: All transportation system user delay does not have the same value. Given that delay has been proposed as one of the measures for MAP-21 performance reporting, it would be helpful to have a better, more current understanding of how transportation system users value delay. Commuter and freight/truck delay costs are the most common differentiation. However, these are very broad categories that contain a very wide variety of users with even wider value judgments of delay. For example, some motorists view their morning commute as “wake up” time or their evening commute as “wind-down” time. With high-speed Internet connectivity, some transit riders extend their work hours into their commuting time, or extend their personal time (e.g., pleasure reading) into their commuting time. Even within the freight category, it has been hypothesized that delay may not have nearly as much value as travel time reliability.
3. Category 2: Performance Management (Agency Culture)
This category refers to the agency implementation of performance measures, and how deeply integrated performance measures are in agency decision-making and other agency processes.
Professional capacity for data analytics: Big Data analytics is becoming more common in many different areas; transportation is no exception. Recent advances have got us squarely into the “big data” era in terms of the amount of data generated. However, some transportation departments lag behind in their ability to store, manipulate, process, and report on these Big Data sets for performance reporting. General “data analytics” training courses are available regardless of specific data application (e.g., through organizations like The Data Warehouse Institute). Ideally, however, a few training courses could be developed and delivered for transportation performance measure-specific data analytics. Recognition of performance goals and targets: Performance goals and targets are understood and embraced by all employees. The performance goals are not something that is only published in an annual report or website, but something that permeates the culture and day-to-day decisions of the agency. Individual or workgroup incentives for meeting targets: Meeting or exceeding performance targets could be incentivized (through bonuses, awards, etc.) at the employee, workgroup, or department level. Meeting performance targets could be prioritized more highly than adherence to a static, non-creative process. Culture of evaluation: Agencies should regularly conduct “before-after” evaluations that quantify the impacts of capital or operational improvements. These evaluation results should be incorporated into a feedback loop that better informs the policy, planning and programming process. This is the subject of Paper #3 in this series (titled “Connecting the Dots”).
4. Category 3: Data
This category refers to data that is required for calculating performance measures or putting performance measures in the correct context.
Better system-wide data on flows and throughput: Based on private sector advancements in recent years, system-wide travel times and speeds are now available. Similar advancements are needed in flow data (i.e., traffic counts by vehicle class). Many public agencies have fixed-point sensors that monitor the most congested freeways, but less commonly on rural or free-flowing highways and arterial streets. Additionally, where fixed-point sensors are installed, inadequate maintenance sometimes limits data availability. It may be that flow sensors for performance monitoring may only be needed between major interchanges or cross streets, a spacing that is wider than most current operations-based installations. Readily available data on management actions: Historic/analytic data should be available for all transportation infrastructure management and control strategies. For example, all displayed signal phasing, ramp meter sequences, dynamic lane assignments, managed lane prices, traveler information, highway condition and road closure information, ozone alerts, etc. This “strategy parameters” data could be used to evaluate and calibrate management strategies. Readily available data on external variables and influences: There are many influences on transportation demand outside of what many agencies currently consider (the subject of Paper #4 in this series). Ideally, these external variables and influences are identified and somehow incorporated into performance monitoring and target setting processes.
5. Categories 4 and 5: Mode, Trip, and Facility Coverage
This category refers to the mode, trip, and facility coverage characteristics of performance measures and the supporting data. Many of the advancements in this category relate to gathering better individualized but anonymous data about person trips. With individualized but anonymous data, one can see an individual trip trace or origin-destination, but has no idea who made that trip.
Trip patterns: Trip-based measures are sometimes seen as more customer-centric than facility-based measures. Both are needed, but being able to identify actual trips, trip patterns, and trip experience would provide a better understanding of system performance. Actual trips may only be known about a select subset of all travelers who choose to opt in. Habitual trip patterns: There is benefit to understanding habitual trip patterns for unique but anonymous travelers or goods. For example, for those travelers who choose to opt in, demographic and socioeconomic information could be known. For goods movement shippers who decide to opt in, basic commodity information could be known. However, “opt in” processes could create sample bias that must be addressed in experimental design or data analysis. Deviations from habitual trip patterns: Once habitual trip patterns are known for a selected subset of travelers and/or goods, then deviations from habitual patterns can be identified, as well as causes for these deviations. For example, did a phone call or text message from a family member trigger the deviation (e.g., run errand on way home from work)? Did a traveler information alert prompt a detour to a less congested route? Or was a managed/toll lane used on this commute because a mother was running late for the big soccer game on her calendar? Capturing mode shifts: To accurately capture the effects of various demand management strategies, better information is required about mode shifts. For example, did an employer-based demand management strategy actually reduce motor vehicle trips or create a shift to more other modes? To take this one step further, one could also measure the trips not taken (i.e., telecommuting, Internet shopping, etc.). This capability would require knowing habitual trip patterns, as well as planned trip patterns and preferences (i.e., does this individual usually prefer to shop brick-and-mortar or online?). Going beyond door-to-door trip measurement: In a perfect world, door-to-door trip information could be extended to an actual trip end inside a building, such as when a walking trip begins inside a large building or complex. This capability may be more prevalent in the future as mapping companies extend their reach (using WiFi signal recognition) inside buildings. Inferring trip purpose: Trip purpose is known or can be inferred with high confidence from trip ends. Associations or “friendships” between companion travelers can be determined from similar trip ends and trip traces, thereby allowing one to determine carpooling or ridesharing, as well as companion use of public transit. Capturing long-distance travel is another possibility.
6. Category 6: Traveler Preferences and Tradeoffs
This category refers to information about traveler preferences and tradeoffs that could be used to better understand trip-based information and characteristics.
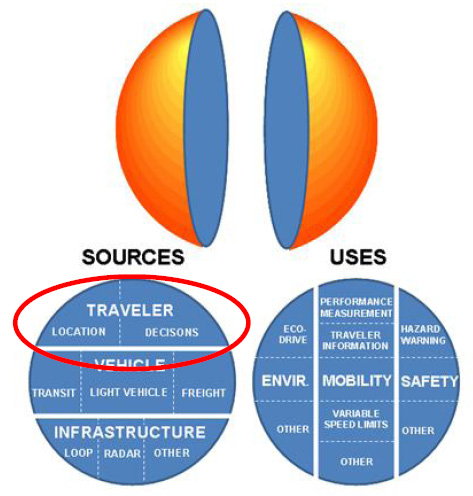
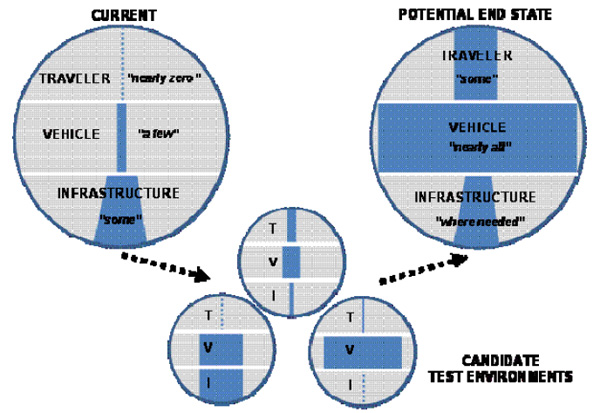
More individualized data on travelers and their preferences: Private sector advancements in recent years have resulted in greater availability of system-wide travel times and speeds. However, some of the “richness” of this data has been lost in its aggregation among multiple users. Knowing more detailed yet anonymous traveler preferences (and perhaps demographics) could help our understanding of trip making and how we measure its performance. Some of this information is more important for transportation demand management, but the benefits of more individualized, trip-centric data could also flow into performance monitoring. The benefits of this anonymous yet individualized information have already been recognized within USDOT’s Data Capture and Management program (see Figures 1 and 2).
It is not immediately clear how this measurement capability could be scaled to a national level to represent a significant sample of travelers. Most likely, though, it would require some type of incentive for travelers to voluntarily participate and provide their individual but anonymous information and preferences. It could be similar to smart phone apps that are currently being used in limited research tests and pilot deployments, whereby financial incentives (e.g., coupons, free traveler info or services). Another option could be implementation within the mileage-based user fee process, whereby travelers or shippers who decide to opt in and provide certain types of individualized information receive a credit towards their mileage-based user fee.
7. Conclusions
This paper identified several different ways in which practices could be further advanced within the areas of performance measurement and management. The possibilities offered in this paper are meant to stimulate discussion at the December Peer Workshop and are not considered to be an exhaustive list. In fact, as workshop participants are skimming this paper prior to the December Workshop, it is hoped that they will add any thoughts or ideas to the margins of this paper, and bring those ideas and possibilities for discussion at the Workshop.
|