Traffic Analysis Toolbox Volume V:
Traffic Analysis Toolbox Case Studies – Benefits and Applications
5.0 Operational Assessments
Traffic analysis tools that can answer detailed operational questions should be in the toolbox of any practitioner who needs to get the most capacity and performance out of the existing system. The answers these tools provide can guide the engineer and system owner toward effective solutions where expensive and significant changes to the system are just not possible. They do this by answering the detailed questions that usually control individual operational decisions: what signal phasing strategy will maximize capacity and minimize queuing? How is a tolling/inspection station best operated to maximize its throughput? Can an arterial signal system promote transit ridership and still meet the needs of other road users? What can be done to increase average travel speeds in an entire surface street network without building new roads or making any major physical improvements? A complete range of proven and fully-tested tools has been developed; which one to use in any particular situation depends on the characteristics of the problem. The table below presents four case studies that show how some of these tools were used in real-world situations to improve performance and quality of service without the need for significant new infrastructure investments.
| Type of Analysis | Real-World Case Study |
|---|---|
| 5.1 Sketch Planning | Interchange Analysis Eugene, Oregon |
| 5.2 HCM/Analytical Models | Queuing Analysis Ft. Hood, Texas |
| 5.3 Simulation Models | Transit Signal Priority Evaluation Portland, Oregon |
| 5.4 Traffic Optimization | Signal Timing Plan Ft. Myers, Florida |
5.1 Sketch Planning Case Study – Interchange Analysis
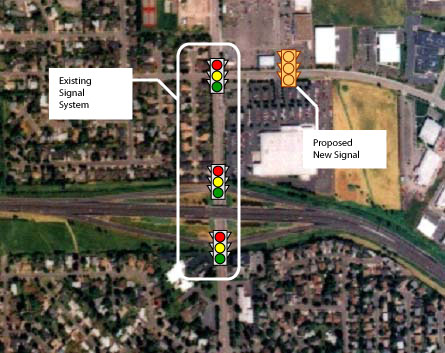
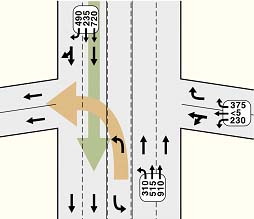
A sketch planning traffic analysis tool can be an effective way to resolve signal timing issues at interchanges. This type of tool does not need an extensive amount of input data, and can be used to quickly and effectively evaluate such things as phase sequencing, number of approach lanes, and lane configuration at the signalized intersections.
Coburg Interchange – Eugene, OR
Key Benefits
- Quickly identified the reason for long queues and the range of possible solutions
- Used data that is readily available and easy to collect
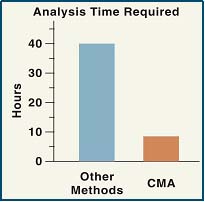
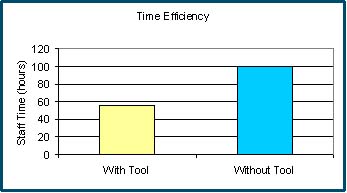
- Reduced analysis time by 50-70% compared to a standard operational analysis procedure
Other Considerations
- This type of traffic analysis tool provides an overall assessment of intersection operation (under-, near-, or over-capacity), but does not estimate the intersection level-of-service.
Sketch-planning traffic analysis tools only need data that are almost always readily available: hourly movement volumes, number of approach lanes, and lane control. Even though sketch-planning traffic analysis tools are not detailed enough to use in final design, their output serves as essential input to other traffic analysis tools that can be used for this purpose.
5.2 HCM/Analytical Model – Queuing Analysis
Analytical models can be used in combination with more detailed analysis procedures to provide a robust examination of complex situations. Deterministic tools such as the HCM or other analytical models are effective ways to get answers to some questions like lane control and queue space requirements. Their output is relatively easy to understand and they also provide an efficient way to compare and contrast alternatives.
Security Screening Analysis – Fort Hood, TX
Key Benefits
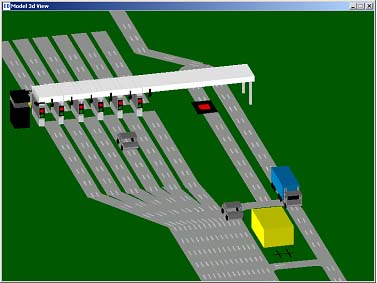
- Provided visual confirmation of vehicle ingress and egress characteristics under different lane configurations
- Confirmed infrastructure needs
- Demonstrated the need for optimizing checkpoint operations and resources
Other Considerations
- These models require moderate to detailed amounts of data that sometimes require significant collection effort.
- Calibration of the models is important to ensure they produce consistent results.
The output from the analytical tools can also be used as input to microscopic simulation models capable of a much more detailed analysis. For example, simulation allows visual confirmation of operating characteristics as well as examination of more detailed issues.
Base personnel used the traffic simulation model to support presentations to military officers and other key stakeholders. Ultimately, the simulation model was used to support full, detailed design of access control points.
5.3 Traffic Simulation Model Case Study – Transit Signal Priority Evaluation
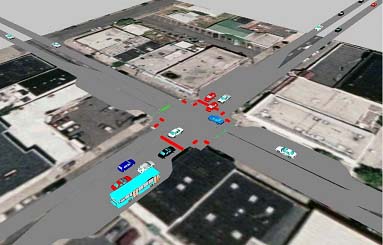
Microsimulation was the appropriate tool to evaluate the effects of transit signal priority strategies on traffic flow along major arterial corridors in Portland, Oregon. This is because it was able to predict important performance measures that other analysis tools could not – including, for example, vehicle delay and both on-time performance and travel time variability for various levels of bus service. Its ability to illustrate the effects of alternative control strategies through animation was a very effective way for engineers and decision-makers alike to assess the overall system performance characteristics.
Transit Signal Priority – Portland, OR
Key Benefits
- Demonstrated how bus travel speed can be increased without significant effects on traffic flow
- Documented and quantified important operational details (queues, delay, etc.)
Other Considerations
- Effective use of microsimulation requires investment in data collection and calibration.
Hardware-in-the-loop
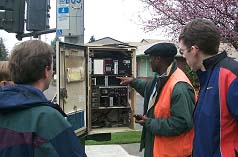
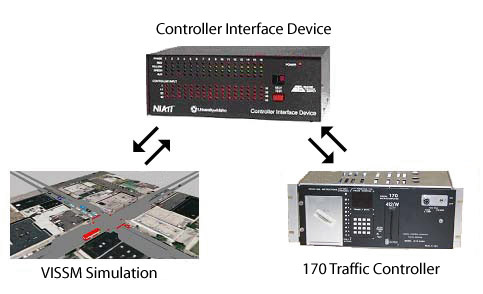
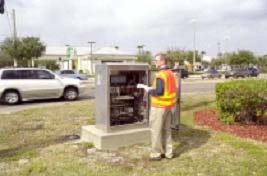
Hardware-in-the-loop uses a combination of simulation software and field signal controller equipment to evaluate traffic conditions in an office setting prior to field implementation. Using this technique reduces disruptions for traffic and transit during installation and allows analysis to quantify the effect of specific signal timing strategies or settings.
5.4 Traffic Optimization Case Study – Signal Timing Plan Development and Implementation
A traffic optimization tool was used when Lee County, Florida undertook the retiming of over 100 signals along 18 arterials, including 20 signals in downtown Fort Myers. The tool was used to develop initial signal timing plans to minimize stops and delays to arterial through traffic. The plans were implemented and then fine-tuned in the field.
Countywide Signal Retiming – Fort Myers, Florida
Key Benefits
- Efficient way to test multiple scenarios and strategies
- Improved quality of service to road users
Other Considerations
- Tool must first be calibrated to field conditions to ensure the development of realistic performance expectations
 |
Development of Optimization StrategiesThe model was used to assess existing traffic conditions as well as develop new signal timing plan options for each corridor (6-10 plans per corridor). |
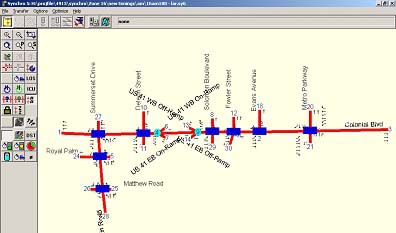 |
Testing of Multiple ScenariosDue to the seasonal fluctuation in travel demand, two sets of final timing plans (peak and off-peak season) had to be developed and implemented for each corridor. |
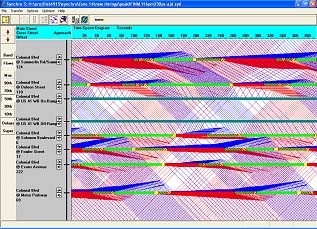
The traffic optimization tool allowed for the testing, evaluation, and refinement of multiple strategies for each scenario prior to field implementation. Visual outputs that are available from this type of tool can be useful to engineers in affirming the correctness of the input as well as in demonstrating the benefits of the new signal timing plans to others.
Benefits Achieved
- More effective use of engineers' time
- Average peak-hour delays were reduced by 16% and stops were reduced by 22%.
- Easier field implementation
 |
Assistance in Decision ProcessThe optimization tool helped in making key project decisions by testing and evaluating multiple strategies in an efficient and controlled manner. |
