Continuation Study to Evaluation the Impacts of the SR 91 Value-Priced Express Lanes
Final Report
Printable Version (PDF 2.38MB)
CONTENTS:
Executive Summary
This is the follow-up final report for a Caltrans and U.S. DOT-sponsored study to identify the impacts of the value-priced express lanes which opened on December 27, 1995 in the median of State Route 91 in Orange County, Ca. As the first practical application of value pricing in the United States, this project provides many important insights, both technical and institutional. Some of these insights pertain to implementing value-pricing projects in other locations.
This report documents more than five years of field observations, including about a year and a half of observations to establish baseline conditions before the facility opened. Data collection included traffic measurements, vehicle occupancy counts, transit ridership data, and comprehensive travel surveys with current and former commuters. Data analysis included calibration of models of the route (toll/non-toll), vehicle occupancy, transponder acquisition, and time-of-day choices of commuters; as well as estimation of air pollution emissions. The current report contains findings through mid-1999, supplementing a previous "final report" issued May 1998, which presents impacts through June 1997.1
The study also produced an extensive data set which is itself an important study product, since it provides opportunities for other researchers to explore aspects of the express lanes which are beyond the scope of the current study. Key elements of the data set are available on-line at http://ceenve.calpoly.edu/sullivan/sr91/sr91.htm.
The section of California State Route 91 (SR 91) containing the express lanes is located between the SR 91/SR 55 junction in Anaheim and the Orange/Riverside County Line. The project provides two extra lanes in each direction, separated from the adjacent freeway by a "soft" barrier consisting of a painted buffer with pylons. The SR 91 Express Lanes, which we refer to as the "91X lanes," incorporate a number of innovative features. These include tolls which vary throughout the day in relation to demand and to congestion on the parallel freeway, the requirement for users to be registered customers and carry transponders, the use of discounted tolls as an incentive to high occupancy (3+) groups, photo-enforcement of toll violations, and the development and operation of the facility as a for-profit private enterprise.
Summary of Principal Findings
Continuing experience shows that increasing numbers of commuters are willing to pay tolls to enjoy the benefits of reduced travel time, improved driving comfort, and the perception of improved safety. Although the majority of commuters do not find it worthwhile to pay the tolls every commute trip, with time and increasing congestion the percentage of toll lane users has increased. While the frequency of toll lane use varies significantly with income, gender, age, and other characteristics, people from all demographic backgrounds use the facility. Our analysis shows that being female is the factor most strongly associated with toll lane use, while high income, age, education, and traveling to work all influence travelers' likelihood of obtaining transponders.
The express lanes are located in what had been one of the most heavily congested freeway corridors of California, with typical peak period delays before the project of 30-45 minutes.
During the height of the peak, the 91X lanes now accommodate 1400-1600 vehicles per hour per lane, about the same as the adjacent freeway and more than the freeway had previously accommodated when severely congested before the 91X lanes opened. The presence of the value-priced by-pass lanes has resulted in an equilibrium under which the overall facility operates better than before. As a further benefit, commuters have the option to travel congestion-free on occasions when the value to them of doing so exceeds the toll.
Although the impacts of the 91X lanes on corridor traffic conditions have been largely favorable, freeway congestion has continued to increased, and the recent opening of the Eastern Toll Road (ETR)2 has worsened that congestion, especially in the eastbound direction where eight lanes of traffic must now merge into six lanes where the SR 91 crosses the county line. Increased congestion has been accompanied by increased toll facility use (91X and ETR combined) and a decline in the proportion of non-work trip purposes during peak periods.
The opening of the 91X lanes in 1995 and of the ETR in 1998 were both accompanied by significant jumps in peak period traffic, in which the single occupant vehicle (SOV) component was the largest part. This resulted in an initial decrease in corridor average vehicle occupancy (AVO), which has remained stable subsequently. In addition, the opening of the 91X lanes in 1995 was accompanied by a one-time 40% increase in the corridor of vehicles with three or more occupants (HOV3+), probably related to the policy, for the first two years of operation, of allowing HOV3+ traffic to use the 91X lanes for free. The beginning, in early 1998, of charging HOV3+ users 50% of the published toll, did not change the overall level of HOV traffic in the corridor, however HOVs do not use the 91X lanes as frequently as before. In all, concerns that the value-priced facility might cause erosion in ridesharing as well as in public transit use in the corridor have not materialized.
Value pricing is associated with highly selective travel behavior. Although the proportion of commuters who use the lanes has increased, among those who use the facility, the proportion who use it for half or more of their peak trips has decreased. The "91 Express Club," which provides toll savings for persons making more than 20 toll lane trips per month, attracts only a small portion (about 12%) of transponder-holders.
The traveler's decision to use the toll lanes is very closely related to hour-by-hour variations in traffic conditions. Our analysis shows that peak period commuters on SR 91 value time at approximately $13-16 per hour, and that demand is moderately price-sensitive, which demonstrates substantial scope for fine-tuning hourly demand through time-variable tolls.
New toll schedules first implemented in September 1997 introduce hour-by-hour toll differences in peak periods. As yet, the fairly small differences in the hour-by-hour tolls have not been accompanied by much flattening of the peak period traffic distributions.
Travelers who choose to pay tolls consistently overestimate their time savings. In addition, drivers cite easier driving and perceived safety as the two main reasons for using the toll lanes besides perceived time savings. The number of toll lane users who say the 91X lanes are safer than the freeway lanes outnumber those who say the express lanes are less safe by a 4:1 margin.
Accident rates for the Orange County section of SR 91 containing the toll lanes decreased significantly after the toll lanes opened, an effect which may be due to decreased congestion or the conclusion of construction activities. At the same time, accident rates increased in the Riverside County section of SR 91 just east of the toll lanes. There is visual evidence of rates increasing in both sections since 1996, but statistical tests are inconclusive. Overall, estimated accident rates in the Orange County section containing the 91X lanes compare favorably to the other road sections investigated.
An aggregate modeling analysis indicates that corridor emissions with the 91X project are about the same as would have occurred if dual HOV lanes or dual general use lanes had been constructed instead.
Although financial performance was not directly investigated in this study, corporate reports indicate that a value-priced facility can be financially successful in a carefully selected market. Even given the direct competition and congestion problems which followed the opening of the new Eastern Toll Road (ETR), the 91X project is reportedly maintaining acceptable financial performance, and the project appears poised to yield a favorable rate of return through its lifetime. On the other hand, it is rare for an urban highway project to enjoy the 91X's unusual combination of modest capital requirements (less than $3.5 million per lane-mile), large demand, and a favorable institutional environment for quick implementation.
Recent, highly public controversies have surrounded the use of the "non-compete" provision in the project franchise agreement to limit nearby corridor improvements by Caltrans, as well as CPTC's attempt to sell the project to a separate non-profit corporation. It appears likely that a recent significant decrease in commuters' approval of variable tolls reflects these controversies. Nevertheless, our survey respondents remain generally positive about using innovative pricing to expand travel opportunities through high occupancy toll (HOT) lanes. Because of the influence of the recent controversies, the jury is still out regarding the public's acceptance of public-private partnerships for accelerating development of needed highway capacity.
List of Specific Findings
The following is a full list of our principal study findings concerning impacts on traffic, changes in travel behavior, and public opinions. The data and analyses which support these findings appear in the body of the report. Cross references are provided showing where in the text can be found detailed information supporting each finding.
The list of findings are grouped by topics which generally follow the order in which the material appears in the body of the report.3
Overall Traffic Trends and Toll/Non-Toll Facility Shares
- The 91X lanes carry a substantial share of the weekday traffic in the SR 91 corridor. After opening day, weekday 91X lane traffic increased steadily until the opening of the Eastern Toll Road (ETR) in October 1998. By September 1998, the total weekday two-way average daily traffic (ADT) using the 91X lanes had reached its peak level at about 33,000 vehicles per day (over 14% of the total weekday SR 91 ADT). Weekday 91X traffic then decreased steadily during the first 6-8 months after the ETR opened. By summer of 1999, the 91X weekday traffic had reached about 24,000 vehicles per day, with no further decreasing trend evident. (Section 2.3, Figure 2-1.)
- 91X traffic in the morning peak direction has been consistently less than in the afternoon peak direction, when congestion in the free lanes is worse. After the ETR opened, that difference increased. 91X lane traffic as well as ETR traffic on Friday afternoons consistently and significantly exceeds all other periods. (Figure 2-3 and Figure 2-4.)
- The trends in 91X weekend traffic have been different from weekdays. The highest weekend ADT values were about 20,000 for a Saturday, reached in August 1998, and about 17,500 for a Sunday, in May 1997. The effect of opening the ETR on weekend 91X traffic was not as great as for weekdays. (Figure 2-2.)
- The weekday ADT on SR 91 (free and toll lanes combined) increased substantially during the months following the capacity increase from opening the toll lanes. The average midweek ADT increased by about 32,600 daily trips between the last quarters of 1995 and 1996, nearly a 17% jump in total daily traffic. Over the same period, midweek 91X lane traffic grew to 24,500 vehicles per day. Between the last quarter of 1996 and the third quarter of 1998, just before the ETR opened, the SR 91 total midweek ADT (free plus toll) increased another 3,650 trips (1.6%), while the 91X ADT increased by 6,900 trips to about 31,400. By September 1998, the 91X lanes carried over 85% of the cumulative growth in corridor traffic (31,400 of 36,300) since the toll lanes opened in December 1995. (Section 2.6, Figure 2-22 and Figure 2-23.)
- During its first three months of operation (October-December, 1998), the average midweek ADT on the new ETR toll highway reached 21,200 vehicles per day. This occurred at the same time as the 91X toll lane traffic decreased 3,900 vehicles per day, and the SR 91 free lane traffic decreased 7,400 vehicles per day. The remaining 9,900 vehicles per day is the estimated increase in overall corridor traffic (ETR plus SR 91 -- free and toll, measured at the 91X midpoint). Because the ETR serves some trips between locations entirely within Orange County, only part of this increased traffic crosses the county line. Also, a small portion of the increase may be double-counted. (Figure 2-24.)
- Rough estimates available from ramp counts suggest that just over 20% of the total SR 91 traffic increase (free plus toll) in the first year after the 91X lanes opened (about 7,000 of 32,600 vehicles per day) may be traffic returning to the state highway from parallel city streets. Although traffic congestion on SR 91 increased between 1996 and 1999, the shift of traffic back to the freeway from parallel arterials which accompanied the opening of the 91X toll lanes has mostly continued. (Section 2.7, Figure 2-26.)
- During its second and third quarters of operation, the midweek ADT on the new ETR increased steadily, reaching an average of 33,100 vehicles per day in May-July, 1999. The growth in ETR traffic during this seven month period (+11,900 vehicles per day) was accompanied by a further 5,900 vehicles per day decrease in traffic on the 91X toll lanes. In all, the total decline in 91X traffic by summer 1999 corresponds to about 30% of the total ETR traffic growth during the same period. (Section 2.6, Figure 2-1 and Figure 2-7.)
- Throughout the study period, traffic volumes remained stable in the SR 57/60 freeway corridor located roughly parallel to SR 91, about 16 km. (10 mi.) to the north. In addition, field observations showed no association between opening the 91X toll lanes and changes in HOV traffic using the SR 57/60 corridor. This indicates that the influence of the toll lanes, while locally important, did not induce detectable traveler route shifts at the regional scale. (Section 2.7, Figure 2-25.)
- CPTC reported it had issued about 124,000 transponders by the end of 1999, joining approximately 240,000 transponders issued by the public toll road authority (the TCA) in Orange County. (Section 2.3.)
Adjustments Accompanying Changes in Tolls and Traffic Conditions - The first general toll increases which occurred in January 1997 was followed by a significant and permanent reduction in the rate of 91X traffic growth. Subsequent general toll increases, which were less substantial and focused on fine tuning of the hour-by-hour toll schedule, were not followed by visible changes in the overall 91X ADT trend. (Section 2.3, Figure 2-1.)
- There exists a strong correlation between express lane patronage and time of day dependent travel time savings. Over the entire period of observation, the percentage of SR 91 travelers who used the express lanes ranges from about 7% in the midday off-peak, when time savings are minimal, to around 35% in the heaviest PM peak hour when delays to freeway users are worst. The implied values of time for persons who use the toll lanes during the peak hour range from $6 to nearly $14.4 Since our surveys with peak period travelers show that 91X commuters consistently overestimate their actual time savings when paying tolls, the actual values of time are lower than these estimates. (Section 2.9, Figure 2-35 through Figure 2-37.)
- The increased capacity from adding two new toll lanes in each direction in December 1995 substantially reduced peak period congestion in the entire Orange County SR 91 corridor, giving short-term travel time benefits to all commuters. In the six months after the express lanes opened, the typical PM peak trip delay on the freeway fell from 30-45 minutes to 510 minutes per trip. Subsequently, delays increased gradually to October 1998 when they jumped to the 30-40 minute range following the opening of the ETR. During the first half of 1999, delays decreased somewhat, to about 30 minutes in the PM peak and less in the AM peak. (Figure 2-31.)
- Time of day distributions of SR 91 traffic show that, in 1996, soon after the express lanes opened and the increased highway capacity no longer constrained demand, the PM peak traffic distribution changed to become much sharper than prior to and shortly after the opening. The reemergence of a sharp afternoon peak at approximately 5:00 PM occurred in the presence of a toll schedule which charged the same amount, $2.75, for the entire period from 3:00 to 7:00 PM. The introduction of a more differentiated toll structure in September 1997, with tolls varying by the hour, had little effect on the sharpness of the overall afternoon time of day distribution for the corridor, or of the 91X traffic specifically. However, in the morning peak, there did occur a small amount of peak flattening accompanying the more substantial hourly toll differences which were implemented during that time. (Section 2.8, Figure 2-27 and Figure 2-28.)
Observations about Ridesharing and Transit - 14. Within three months after the SR 91 toll lanes opened, PM peak traffic observations on all lanes of the highway showed a greater than 40% jump in high occupancy vehicles carrying three or more people (HOV3+). At that time, HOV3+ vehicles paid no toll, although they were required to have transponders. (Section 2.10, Figure 2-38.)
- When HOV3+ users were charged a 50% toll in January 1998, about a third of the HOV3+ traffic (about 2,000 vehicles per day) left the 91X lanes, and HOV3+ traffic in the free lanes increased by the same amount. These changes occurred mostly during the shoulder hours and throughout the week, although much less on Friday afternoon. Following these changes, the total PM peak HOV3+ traffic in the corridor remained the same. (Figure 2-17 and Figure 2-38.)
- Through the entire period of observation, from 1994 through 1999, the counts of PM peak dual occupant (HOV2) vehicles remained essentially unchanged. HOV2 users of the express lanes pay the same tolls as SOV users, or half the toll on a per person basis. (Section 2.10, Figure 2-39.)
- The increase in HOV traffic which occurred after the toll lanes opened is measured relative to a small initial base. For example, throughout 1995, before the express lanes opened, HOV3+ vehicles averaged about 4% of the total SR 91 PM peak traffic. After the express lanes opened, the comparatively much larger growth in single occupant vehicle (SOV) traffic produced a small but statistically significant decrease in average vehicle occupancy (AVO). The AVO trend leveled off during the past few years. Notwithstanding the initial reduction in AVO, the counts of HOV2 and HOV3+ commuters increased significantly compared to the conditions which existed previously. (Section 2.10, Figure 2-44.)
- There is no evidence that the opening of the 91X lanes or the ETR impacted the development of public transportation patronage in the corridor, particularly the IEOC commuter rail line. The rail service has competed successfully throughout the observation period for a small share (<1%) of the commute market. (Sections 2.11 and 2.12, Figure 2-45 and Figure 2-46.)
Findings Concerning the Amount of Trip Making and Trip Purpose
- SR 91 commuters are now using the 91X lanes more than reported after the first year of operation. The proportion of commuters who use the 91X lanes at least some of the time increased from 28.2% in 1996 to 42.0% in 1999. (Section 3.4, Table 3-I.)
- Worsening congestion has motivated some persons to reduce their peak period travel in the corridor. Of 1057 survey subjects, 224 (21%) no longer regularly travel in the SR 91 corridor in peak periods, but did so within the past two years, and have not changed jobs or home location. Of these, 47% said that changing travel conditions influenced their decisions to stop using the corridor. When asked to explain, 86% cited worse traffic, 18% cited driving stress, and 9% cited higher tolls. Females and commuters in the lowest income group were significantly more likely than other groups to have discontinued commuting in the corridor. (Section 3.13.)
- Changes in the peak period trip purpose breakdown indicate that increasing congestion has pushed some discretionary trips out of the peak periods. In 1996, we observed an increase in peak period non-work travel apparently induced by improved travel conditions shortly following the increase in capacity from opening the 91X lanes. In 1999, these non-work trips had decreased, especially in the PM peak. (Section 3.7, Figure 3-28.)
Findings Related to Ridesharing and Employer Trip Reduction Programs
- Our previous 1995 and 1996 surveys found that more SR 91 commuters shifted from single occupant vehicles (SOV) to high occupancy vehicles (HOV) than vice versa in the first year after the express lanes opened. Our 1999 surveys indicate that there has been no significant mode shifts since that time. (Section 3.3.)
- HOV commuters are more likely than SOV commuters to choose the 91X lanes. This suggests that the opportunity to split the toll among multiple occupants is a factor in route choice. (Section 3.3, Figure 3-2.)
- 6% of HOV3+ and 26% of HOV2 commuters indicate that they share commuting costs. 34% of HOV3+ groups cite cost-sharing as their principal motivation for ridesharing. Only 19% of the HOV3+ sample rideshare with members of the same household. (Section 3.10, Figure 3-47.)
- Despite the 50% toll discount for HOV3+ commuters on the 91X lanes, the difference in the proportions of HOV2 and HOV3+ groups using the 91 toll lanes is not statistically significant. (Figure 3-2.)
- Work schedule flexibility was found to be unrelated to the level of 91X lane use. This is surprising, since it was expected that schedule flexibility would result in time-of-day shifts to avoid congestion and high tolls. (Section 3.11.)
- The presence of employer rideshare and transit incentive programs was found to be associated with more frequent toll lane use, probably due to those companies having more HOV commuters, who use the toll lanes more than SOV commuters. The ability to telecommute was found to be related to decreased use of toll facilities. (Section 3.11, Figure 3-48 and Figure 3-49.)
Findings Concerning Travel Times and Perceived Travel Conditions
- Among toll lane users, the magnitudes of perceived time savings increased between 1996 and 1999. As expected, the perceived PM peak savings exceed the AM peak savings. Although travelers appear to accurately perceive the relative magnitude of their time savings, they typically overestimate their actual absolute time savings, by amounts between 5 and 30 minutes. Not surprisingly, both the likelihood of using the 91X lanes and the frequency of use are related to the perceived travel time savings. (Section 3.9, Figure 3-35 through Figure 3-42.)
- Despite the correlation between travel time savings and the percentage of SR 91 traffic using the toll lanes, some toll lane users choose to use the toll lanes under traffic conditions where the expected value of their time savings is clearly less than the tolls paid. In both 1996 and 1999, driving comfort and the perception of greater safety were identified by travelers as the principal motivations for this behavior. Reliability of travel time was cited a distant third. Also noteworthy is that over 15% of transponder holders do not personally pay for their use. The number of toll lane users who say the 91X lanes are safer than the regular freeway lanes outnumber by 4:1 those who say the express lanes are less safe. (Section 3.10, Figure 3-43 and Figure 3-44.)
Findings about Transponder Acquisition and Use
- About 10% of transponders in our sample are funded by the travelers' employers. Another 5% are funded by a friend, family member, or someone else, and 3% are paid for by a combination of sources. (Section 3.12.)
- Just 12% of the 618 survey respondents who have CPTC transponders report that they belong to the Express Club, which provides a toll savings for those who use the 91X lanes more than 20 times per month. So while commuters are using the 91X lanes more frequently, few commuters are everyday users. (Section 3.12.)
Findings Related to Income and Other Demographics
- Little has changed since 1996 in the association between income and use of toll facilities. In both 1996 and 1999, the proportions of commuters who chose the 91X lanes increased with income for all modes. The differences are statistically significant among income groups in whether toll or free routes are chosen. One notable change from 1996 to 1999 is the significant decrease in the percentage of trips on toll facilities for the $40-60K income category, from 40% in 1996 to 25% in 1999. This suggests that middle income commuters have been particularly sensitive to the toll increases, and are less willing to pay tolls despite worsening congestion. (Section 3.4, Figure 3-6, Figure 3-8 through Figure 3-13.)
- In general, the proportion of commuters who chose the 91X lanes over the free lanes is higher for females than for males. Only in the HOV3+ category is the proportion higher for males than females. The same trends are apparent when analyzing how frequently commuters report using the 91X lanes (e.g., more females than males are frequent users, except among HOV3+ commuters) and this has been stable over time. However, the only statistically significant differences between the genders are among SOV commuters. (Section 3.5, Figure 3-14 through Figure 3-17.)
- Age is associated with frequency of toll lane use. The youngest and oldest travelers are less likely to be frequent toll lane users than travelers in intermediate age categories. Education level is also directly related to the level of use of the toll facilities. Household type, that is, whether there are children in the home, was found not to be related to the level of toll facility use. (Section 3.6, Figure 3-24 and Figure 3-27.)
Findings about Public Opinion
- Commuters in the SR 91 corridor draw a sharp distinction in their opinions about toll facilities generally and about the special characteristics of the 91X lanes. Approval for providing toll facilities in general remains high for most commute groups, in the 50-75% range, similar to three years ago. However, approval of variable tolls, which has consistently lagged approval of toll financing in general, decreased significantly from its high point of 55-75% in 1996 to the 30-50% range in 1999. (Section 4.3, Figure 4-1 and Figure 4-3.)
- Current approval of variable tolls varies significantly among groups depending on their method of travel. Among SOV commuters, a very large difference in approval (53% v. 28%) was observed between recent toll lane users and non-users, however no similar difference was observed for HOV commuters. (Figure 4-1 and Figure 4-3.)
- Levels of approval of variable tolls are not very sensitive to commuters' income. Commuters with household incomes above $100,000 were found to show higher approval of variable tolls, as well as of toll financing in general, compared to all other groups. However, no significant differences were found among the different groups with incomes below $100,000. (Figure 4-4.)
- Approval of private companies operating toll roads for profit decreased significantly among all commuter groups between 1996 and 1999, currently showing approval levels in the 3045% range, compared to 50-75% approval in 1996. As noted below, it is evident that public opinions about variable tolls and for-profit operations have been negatively affected by the highly public controversies which recently have occurred in connection with the 91X project. (Section 4.4, Figure 4-5.)
- Corridor commuters express generally high levels of approval (in the 45-75% range) for the idea of selling excess HOV lane capacity to SOV users, provided that this doesn't cause the HOV lanes to become congested. Apparently, the recent public relations difficulties of the 91X project do not extend to other related innovations. (Section 4.4, Figure 4-7 and Figure 4-8.)
- Recent media coverage of the 91X project and CPTC has contributed to negative public perceptions of the project. Well documented problems include worsening congestion and traffic spill-over to residential areas, collisions experience, and charges of irregularity in CPTC's efforts to sell the business to a non-profit organization. Litigation and threatened litigation as well as government investigations have further affected the atmosphere. (Section 4.5.)
Findings about Choice Modeling and Elasticity
- This part of the work culminated in the development of three final choice model specifications: one joint logit model which only considers choice among the three alternative routes through the corridor (toll and non-toll); and two nested logit models, one which considers choice of mode, transponder acquisition, and route, and another which considers choice of time of day, transponder acquisition, and route. The models relate choices to the travel time and per capita toll for each option, along with numerous trip and traveler characteristics such as gender, age, income, education level, and employer policies on commuting. The models are powerful predictors of toll lane use with good statistical properties and consistency with other study findings. (Table 5-IV, Table 5-VI, and Table 5-VII.)
- The calibrated choice models are robust with plausible parameter values. Model parameters are stable across different specifications, providing predictions, elasticities, and value of time estimates which do not vary much among the various models. (Section 5.9.)
- Certain traveler or trip characteristics increase the willingness of commuters to use a toll road. One of the strongest is being female. Other factors -- high income, middle age, higher education, and being a commuter to work -- appear to affect toll road use more indirectly, by favoring a willingness to acquire an electronic transponder. The combined effect is that women aged 30-50 are more likely to choose a toll road than any other age/gender classification, and this effect seems to hold across different amounts of time savings and toll levels. (Section 5.9.)
- Estimates of travelers' implied average values of time are similar among the preferred models, approximately $13-16 per hour. (Table 5-IV, Table 5-VI, and Table 5-VII.)
- The price elasticity for use of the 91X lanes during the 6-hour period of heaviest use (morning westbound or afternoon eastbound) is consistently about 0.7 to 0.8, based on response to uniform percentage toll changes. This means that a 10% across-the-board toll increase would result in about a 7-8% decrease in toll facility use. More targeted toll increases -- during just the one-hour "peak of the peak" -- yield price elasticities between 0.9 and 1.0. These results demonstrate that there is scope for adjusting toll schedules, even in as small as one-hour increments, in order to regulate traffic levels. (Sections 5.5 and 5.8.)
Findings about Collision Experience
- For the Orange County section of SR 91 containing the 91X lanes, data show a reduction in fatal and injury (F&I) and total accident rates immediately after opening of the toll lanes. However, it should be noted that the observation period prior to the opening includes the time when the 91X lanes were being constructed. This condition is not usually considered in traffic safety analysis due to the typically unrepresentative traffic behavior patterns during construction. (Section 6.3, Figure 6-1 and Figure 6-2.)
- By late 1997, visual evidence suggests that accident rates on the Orange County SR 91 section had returned to near their 1995 levels, although only an increase in the weekday average F&I rate tests significant. These changes are consistent with past studies which have shown that higher accident rates usually follow increased levels of congestion. (Figure 6-1 and Figure 6-2.)
- For a two-mile section of the SR 91 freeway in Riverside County, between the terminus of the 91X lanes and SR 71, the total accident rate increased for weekdays and for peak periods in the peak direction following the opening of the 91X lanes. The F&I rate for the peak period in the peak direction also increased, but the overall weekday F&I rate did not. These changes are probably due to increased congestion in this section. Recent (1998) increases in the concentration of collisions just west of Green River Road warrant additional detailed consideration. (Figure 6-3 through Figure 6-6.)
- A longer 7.5-mile section of SR 91 in Riverside County, between the Orange County line and Interstate 15, shows a significant upward trend in total peak period, peak direction collisions throughout our entire period of observation. However, no corresponding trend exists for F&I collisions in this section. (Figure 6-8.)
- The overall pattern of accident rate changes on SR 57 for the peak period, peak direction shows no clear changes. This suggests that the peak period differences observed on SR 91 do not reflect a region wide trend. (Figure 6-9.)
- During our observation period, there were generally no systematic changes in peak period collision types in the Orange County section of SR 91 containing the 91X lanes. (Section 6.4, Figure 6-11.)
- After the 91X lanes opened, the percentages of peak period rear end collisions and vehicles reporting slowing/stopping movements increased significantly in the 2-mile section in Riverside County between the county line and SR 71. This suggests the influence of increased congestion in this section. (Figure 6-12 and Figure 6-15.)
- Overall, the available evidence suggests that the 91X facility is operating at an acceptable level of safety.
Findings about Vehicle Emissions
- If dual HOV lanes had been constructed instead of the 91X toll lanes, and assuming no change in vehicle-miles of travel (VMT), the overall modeled emissions for March 1998 conditions would be approximately the same as with the existing 91X facility. (Section 7.4, Table 7-V.
- If general use lanes had been constructed instead of the 91X toll lanes, the modeled emissions for March 1998 would be approximately the same, assuming that induced traffic produced a 7% traffic (VMT) increase. For other assumptions on increased VMT, ranging from 0% to 10%, overall modeled emissions would vary from 6% less to 3.7% more than the values estimated for the existing 91X facility. (Section 7.5, Table 7-X through Table 7-XIII.)
- If no additional capacity had been built, our best estimate is that VMT would be about 8% less and overall modeled emissions in March 1998 would be 18% less than the values for the existing 91X facility. This analysis is based on very limited data. (Section 7.6, Table 7-XV.)
Closure
The State Route 91 Express Lanes project remains unique in its particular combination of operational and institutional characteristics. The project is poised to undergo additional changes in years to come, in terms of project ownership and organization, in the nature of the competitive relationship with public highways, and in the project's interfaces with new transportation investments in the vicinity. How these changes play out will continue to provide useful lessons for innovative transportation projects in other settings.
1. Introduction
1.1 Overview
This is the follow-up final report for a Caltrans and U.S. DOT-sponsored study to identify the impacts of the State Route 91 Express Lanes, the nation's first value-priced roadway, which opened on December 27, 1995 in Orange County, California. The express lanes extend about ten miles in the former median of the Riverside Freeway, connecting the major employment centers of Orange County and southern L.A. County with the predominantly residential communities of Riverside and San Bernardino Counties. Tolls in the express lanes vary hour by hour to control demand and maintain free flow traffic, in contrast to often congested traffic conditions in the adjacent free lanes.
The State Route 91 (SR 91) Impact Study began in 1994 under an original contract which provided for studying the corridor's operations through June 1997. At the end of this period, a final report was published in May 1998.5 At approximately the same time, several major developments occurred in the operation of the 91 Express (91X) Lanes, which the sponsoring agencies viewed as having potentially important consequences for the use and impacts of the facility.6 These include:
- A change to the toll schedule in September, 1997, which for the first time charged different tolls hour-by-hour within the peak period. Previously, the same toll was charged throughout each four-hour peak (and the six-hour PM peak on Friday).
- The beginning in January, 1998, of charging tolls to high occupancy vehicles with three or more occupants (HOV3+), at 50% the published toll. Previously, HOV3+ travelers could use the 91X for free.
- The opening in October 1998 of the Eastern Toll Road (ETR), a fixed-toll highway operated by the Orange County Transportation Corridor Agencies (TCA), which directly competes with the 91X lanes for commute travel to Irvine and vicinity.
- The announced intent of the California Private Transportation Company (CPTC), the private developer and operator of the 91X lanes, to sell the business to a non-profit entity.
Our follow-up study began in March, 1999. Its purpose is to measure and document the impacts of these new developments and to address certain other issues not included in the original study. It extends the period of observation from June, 1997, to late 1999, and extends the scope of the original study to model corridor travel demand and model corridor air quality.
This report presents the complete results of this follow-up work. It supplements but does not replace the May, 1998, report of the original study.
As the first practical application of value pricing in the United States, the 91X project provides a number of important insights, both technical and institutional in nature. Some of these insights are applicable to implementing projects of this nature in other locations.
Most findings in this report and in the previous May, 1998, report are based on the extensive data set developed during the study. These data are an important study product, since they provide an opportunity for others to conduct further investigations of the 91X lanes which are beyond the scope of the current study. The principal data developed by the study are available on-line at: http://ceenve.calpoly.edu/sullivan/sr91/sr91.htm.
The following sections provide a detailed description of the 91X lanes and their operation, a synopsis of the major conclusions from the May, 1998, report, an overview of the follow-up study scope and methodology, and a guide to the organization of the rest of this report. Each technical chapter begins with a list of the principal findings contained in that chapter. The concluding chapter is a review of the most important findings and issues raised by the study.
1.2 Description of the SR 91 Express Lanes
The California SR 91 Express Lanes are located in the freeway median between the SR 91/55 junction in Anaheim and the Orange/Riverside County Line. (See Exhibit 1-A and Exhibit 1-B.) The 91X facility provides two extra lanes in each direction, separated from the adjacent freeway lanes by a "soft" barrier consisting of a painted buffer with pylons. (See Exhibit 1-C.7) The lanes operate as an express facility; that is, there are no intermediate exits or entrances along the 10-mile length. Heavy vehicles are prohibited from the toll lanes.
The 91X lanes incorporate a number of innovative features which make it one of the most interesting experiments in highway transportation in quite some time.
The toll lanes are located in what had been one of the most heavily congested freeway corridors of California. Before the 91X lanes opened, peak period delays of 20-40 minutes were typical. The capacity increase from adding two new lanes in each direction initially reduced delays in the free lanes to less than 10 minutes. More severe congestion has since returned, although delays are not yet at the level experienced before the 91X lanes opened.
The four-lane, 10-mile long toll facility was constructed for approximately $134 million as a private for-profit investment, one of four such private-public partnership experiments authorized by the California Legislature under the AB 680 legislation enacted in 1989. To date, it is the only AB 680 project operating. One other such project, SR 125 in San Diego County, is under construction and scheduled to open in 2003.
The SR 91 project became a candidate for implementation under AB 680 because of the region's inability to fund necessary improvements in the corridor within a short time frame. Had public funds been used for improvements, the added capacity would have included new HOV lanes, or a combination of HOV and general purpose lanes. However, implementation would have been five or more years later than the improvements constructed through the public-private partnership.
Exhibit 1-A8

Exhibit 1-B

Under Caltrans supervision, the express lanes were designed, built, and are operated by the California Private Transportation Company (CPTC) on land leased from the State. The franchise agreement gives CPTC thirty-five years to operate the toll lanes, after which the facility reverts to full control of the State.
In the meantime, CPTC can set the tolls as the company sees fit, subject to a maximum rate-of-return constraint specified in the franchise agreement. The agreement between the company and the State also requires CPTC to offer an incentive to high occupancy vehicles with three or more persons (HOV3+). Initially, HOV3+ users were toll-free, although they were required to carry transponders like all other users. Starting in January 1998, the HOV3+ toll was set at 50% of the published toll.
Exhibit 1-C

Tolls on the 91X lanes vary hour by hour, to control demand and keep traffic in the 91X lanes operating at free flow. The tolls also reflect the travel time savings of toll lane users compared to travelers on the adjacent non-tolled freeway. The variable toll system is called value pricing. From opening day through summer, 2000, there have been five general toll increases, in addition to the January 1998 change affecting only HOV3+ users.
As seen in Exhibit 1-J, tolls now vary from a low of $0.75, during periods of lowest demand, to $3.75 during the height of the Friday afternoon peak period. All permitted vehicle types pay the same amount, except discounted tolls are paid by HOV3+ users and a few other discounted toll categories.
A "91 Express Club," created in January 1997, permits frequent users to pay a flat $15 monthly fee and receive a $0.75 discount (originally $0.50) on each trip made, regardless of time of day. Belonging to the Express Club provides an overall savings in tolls for persons who use the express lanes more than 20 times per month. Also, it has the effect of eliminating the marginal toll for an off-peak trip. As yet, the Express Club has not attracted many members, about 12% of transponder holders by our estimate.
Partly due to width constraints along the existing freeway median where the toll lanes were constructed, all tolls are collected by Automatic Vehicle Identification (AVI). Only registered customers equipped with suitable transponders are permitted in the toll lanes. The AVI requirement has applied to HOV3+ users from opening day, even though they traveled toll-free.
Through 1999, CPTC had issued about 124,000 of the calculator-sized FasTrak transponders. By that time, an additional 240,000 Fastrak transponders had been issued by the Transportation Corridor Agencies (TCA), which operate the 67-mile network of public toll roads being constructed in Orange County.9The transponders, which use a read-write RF tag technology,10 are manufactured by SIRIT11 (formerly Texas Instruments). They are compatible with California's "Title 21" open standard and may be used on toll facilities throughout California, including San Diego's I-15 HOT lanes, the Golden Gate Bridge, and the State-owned toll bridges in the San Francisco Area. Customer service and electronic toll collection systems for the 91X project were provided by MFS Network Technologies12.
CPTC does not explicitly require deposits on its AVI transponders; however, a positive cash balance is required on each account. Normally, a credit card user pays $30 to replenish an account whenever the balance falls below $10. Cash customers normally pay $50 to replenish an account whenever the balance falls below $25. In 1997, CPTC began to assess service charges on customers with low activity accounts. Current "Standard Plan" customers pay a $6 per month minimum charge. "Convenience Plan" customers can avoid the monthly minimum by paying a one-time non-refundable $50 fee. 13
Exhibit 1-E through Exhibit 1-J show the sequence of toll increases and adjustments made since the 91X lanes opened in December 1995, through the year 2000.14 CPTC elected to operate the SR 91 facility with a published toll schedule rather than with dynamic tolling, like on San Diego I-15 where tolls are fine-tuned to traffic conditions in real time. While dynamic tolling is within the technical capability of the 91X electronic toll system, CPTC's marketing showed that some potential customers were uncomfortable with the unpredictability of dynamic tolls.
CPTC issues its annual report in the spring of each year. Table 1-I shows the reported financial operating results for each year since opening. Besides the operating expenses shown, CPTC must meet accumulated debt service and provide a rate of return on capital investment.
Table 1-I. CPTC Reported Annual Revenues and Expenses1515
| Year | Total Revenue | Total Operating Expenses |
|---|---|---|
| 1996 | $7.1 million | $6.3 million |
| 1997 | $13.9 million | $9.1 million |
| 1998 | $20.1 million | $8.7 million |
| 1999 | $19.5 million | $9.1 million |
CPTC's first annual report stated that, after three months, revenues had reached a level sufficient to cover operating expenses, but excluding debt service and return on investment. In August 1998, the company reported that revenues had reached overall "breakeven," sufficient to cover both operating expenses and debt service.
While financial performance was not directly investigated in this study, the corporate reports indicate that the 91X project has acceptable financial performance, and the project appears poised to yield a favorable rate of return through the life of the project. However, it should be recognized that it is rare for a new urban highway project to have the 91X's unusual combination of relatively low capital costs (less than $3.5 million per lane-mile), large demand, and a favorable institutional environment for quick implementation.
Exhibit 1-D

The long-term financial prospects of the 91X lanes are influenced by the nature and location of competing highway capacity. The nearest major freeway providing independent parallel capacity is State Route 60, running east-west approximately ten miles north of SR 91 (see Exhibit 1-B). Within the SR 91 corridor, the Eastern Toll Road (ETR) competes with the 91X for trips to Irvine and vicinity. (See Exhibit 1-D.) Opening the Eastern Toll Road in October 1998 clearly caused a temporary setback in 91X revenue growth. However, ETR users must use the highly congested SR 91 free lanes in order to cross the Orange/Riverside County Line, while 91X users largely bypass this congestion.


The franchise agreement between CPTC and Caltrans contains a "non-compete" provision through which Caltrans agreed not to make freeway improvements that undermine CPTC's business, unless required for highway safety. During the past few years, this non-compete provision has become a major source of conflict between CPTC, the State, and others, and a solution to the problem has not yet been found. This issue is discussed in detail in Chapter 4.
In addition to the controversy over the non-compete provision of the franchise agreement, problems also arose in connection with CPTC's recent efforts to sell its business. CPTC contacts cite two principal reasons for trying to sell its business: (1) one of the original general partners in CPTC decided that continued participation is not compatible with their core corporate strategy, and (2) tax laws make running the 91X lanes by a non-profit organization more attractive than continued operation as a for-profit business. CPTC's efforts to work with a prospective non-profit buyer were publicly characterized as tainted with conflict of interest, and the potential deal fell through under a cloud of investigation. This issue is also discussed further in Chapter 4.
1.3 Synopsis of Major Conclusions from the May, 1998, Report
The 91X project has developed a growing market for commuters willing to pay premium tolls in order to bypass recurrent congestion on an urban freeway. The fact that the use of the toll lanes is optional and the facility is managed to preserve good levels of service for those choosing to pay the tolls are two key features that clearly have contributed to public acceptance of this project. Travel time savings, improved driving comfort, and perceptions of improved safety are immediate tangible benefits which motivate increasing numbers of travelers to pay the tolls. Traffic diverted to the toll lanes from both the freeway and parallel city streets has improved travel conditions on these non-toll facilities in the short term, further adding to the public acceptance which the project has enjoyed so far.
Although toll revenues do not yet cover total annualized facility costs, the facility's operator predicts financial breakeven by the end of the third year of service (late 1998). Eventual profitability for this project is greatly assisted by its modest capital cost of about $3 million per lane-mile and the lack of competing highway capacity within the corridor.
Impacts on corridor traffic have been generally favorable. Greatly improved travel conditions resulted in a jump in corridor vehicular traffic during the first few months of operation. The greatest amount of this traffic growth was in single occupant vehicles. However, high occupancy vehicle use also grew significantly during the same period, with HOV-2 traffic increasing a little, and HOV-3+ traffic increasing dramatically.
The jump in SOV traffic over the observation period was mostly the result of three distinct effects: (1) traffic returning from parallel city streets, (2) new induced travel for non-work purposes which had previously avoided this severely congested corridor, and (3) continuation of the background SOV growth trend which was present before the express lanes opened. The overall effect of these changes, despite significantly increased volumes of HOV traffic, was a small downward trend in average vehicle occupancy through the first eighteen months of express lanes operation.
Optional congestion-based variable pricing results in highly selective use by travelers. On SR 91, about half the toll lane users choose to use the lanes once per week or less. Data show that the traveler's choice to use the toll lanes is closely related to hour-by-hour variations in travel conditions.
We found that providing the option of nearly congestion-free peak period travel resulted over time in the emergence of a sharp peak period traffic distribution. New toll schedules, first implemented in September, 1997, introduced hour-by-hour toll variations within the peak periods. An unresolved question is whether fine tuning the toll schedules in this manner will result in re-flattening the peak period traffic distribution.
The study produced diverse findings concerning the equitable distribution of project benefits across different traveler groups. While a clear correlation exists between frequency of toll lane use and income level, users from all income groups regularly make use of the facility. The data show that female commuters are about a third more likely than men to make frequent use of the express lane option. It should be noted that commuters in the SR 91 corridor are on average more affluent than the overall urban population of Southern California. Thus, conclusions about impacts across income and gender groups based on this corridor cannot be assumed to apply everywhere.
The express lanes constructed on California State Route 91 have demonstrated that providing new highway travel options, in this case, premium service for a premium price, can win public acceptance and produce significant travel changes.
1.4 Description of the Study Methodology
The overall objective of this study has been to develop information and insights towards improved understanding of travelers' reactions to congestion-based road pricing and to the other innovative features of the 91X toll lanes. To meet this objective, we conducted an extensive program of direct observations, surveys of corridor users, and impact modeling. In all, data collection spanned a time period in excess of five years, from early 1994, approximately a year and a half before opening day, through late 1999. The data collection prior to opening day provided a baseline against which post-opening data were compared.
The specific data collection, analysis, and modeling activities of the study included:
- Observations of traffic conditions at selected sites along the study area freeway network and at some control sites distant from the 91X lanes. These observations include traffic counts, speeds, vehicle types, and vehicle occupancies.
- Observations of traffic volumes on selected ramps and speeds on parallel arterials, in order to estimate the amounts of freeway traffic diversion during congested periods. (Arterial speeds are discussed in the May 1998 report.)
- Observations of ridership on public transportation services and in organized rideshare programs serving the SR 91 corridor. (Rideshare programs are discussed in the May 1998 report.)
- Travel surveys conducted to understand the characteristics of SR 91 peak period commuters and their revealed travel behavior. Some survey participants comprise a longitudinal panel whose behavior was tracked over time, the remainder are cross-sectional observations, mostly current commuters but including a small subset of persons who no longer use the SR 91 corridor. (Travel surveys with public transit riders are documented in the May 1998 report.)
- Use of the travel survey data to calibrate choice models of commuters' decisions about using the toll facilities, on the basis of which we determined price elasticities and travelers' values of time.16
- Opinion surveys conducted to understand commuters' views about the innovative features of the toll lanes and related public policies, with emphasis on how these opinions changed over time. (Opinion surveys with area businesses and public transit riders are discussed in the May 1998 report.)
- An investigation of trends in accident rates and characteristics and an investigation of traffic operational characteristics, in particular weaving at the entrances and exits of the express lanes. (The weaving observations are documented in the May, 1998, report.)
- An investigation of estimated vehicle emissions in the 91X corridor, compared with modeled emissions for hypothesized alternative lane configurations.
Details on data collection procedures, including scheduling and sample size considerations, and descriptions of our data analysis and modeling techniques are contained in several methodology appendices which appear at the ends of the pertinent chapters.
1.5 Overview of the Rest of the Report
The study addressed a wide variety of issues related to the 91X toll lanes. Our May 1998 report focused on comparisons between periods twelve to eighteen months before and after the toll lanes opened in December 1995. The current report, while documenting most trends all the way back to the start of observations in 1994 or 1995, emphasizes the changes that occurred during the extension period, from June 1997 to 1999.
The rest of this report contains six chapters which cover the major technical areas addressed by the study. They are followed by a concluding chapter which reviews the main findings and issues.
The contents of the remaining chapters are described below.
Chapters 2 and 3 deal with observed impacts on traffic and travel behavior. Chapter 2 documents trends and comparisons related to traffic counts, speeds, observed vehicle occupancies on the corridor highways, and patronage on corridor transit services. Chapter 3 addresses the characteristics of travelers and individual travel behavior, based on the travel surveys conducted from 1995 through 1999.
Chapters 4 and 5 also deal with the data from our survey analysis work. Chapter 4 contains survey findings about trends in public opinions concerning the 91X facility and its principal operational and institutional characteristics. Chapter 4 also contains a section summarizing recent media coverage of the 91X project. Chapter 5 presents results from estimating models of travelers' choices regarding whether or not to use the toll facilities (91X and ETR), as well as choices regarding mode, time of day, and transponder acquisition. Associated price elasticities and values of time are reported.
Chapter 6 presents an analysis of recent collision experience on selected sections of SR 91. A comparison is also made of accident rates on SR 57. A small number of major incidents in or adjacent to the 91X lanes are studied in detail to see if they might be related to the unique operating characteristics of the express lanes.
Chapter 7 provides an analysis of vehicle emissions in the SR 91 corridor for a selected week in March 1998. Emissions for the facility as it exists are compared to modeled emissions for three hypothetical alternative scenarios: the substitution of HOV lanes for the 91X lanes, the substitution of general use lanes, and the "no build" alternative. A critique of the analysis methodology is given.
Finally, Chapter 8 presents our principal conclusions.
2. Traffic Trends, Driving Conditions, and Transit
2.1 Chapter Introduction
A major part of this study involved monitoring traffic trends on the 91 Express (91X) lanes and on the other transportation facilities serving the corridor. This work took a variety of forms:
- Collection and analysis of 5 minute traffic counts and estimated vehicle speed data from loop counters deployed on freeways and ramps throughout Orange and Los Angeles Counties.
- Coding and analysis of hourly traffic counts for the 91X toll lanes using printouts obtained from Caltrans District 12 in Orange County.
- Compilation and analysis of roadside observations of vehicle occupancies and vehicle types taken usually one day per month at ten observation sites on freeway mainlines and at seven observation sites on ramps.
- Coding and analysis of floating car speed runs on SR 91 and, initially, on two principal arterial routes located parallel to the 91X toll lanes.
- Acquisition and analysis of passenger counts on public transportation services which parallel the 91X, consisting of a single express bus route and a commuter rail line.
Traffic monitoring occurred for over a year prior to the December 1995 opening of the 91X toll lanes, in order to establish baseline conditions, and for more than three years after the opening.
The next section provides a summary of the major findings based on more than four years of observations. Succeeding sections present the related details. The chapter concludes with three methodology appendices which describe the data collection and statistical analysis techniques which were used.
2.2 What We Learned from Traffic Counts and Related Observations
The following are the principal findings from monitoring traffic and travel conditions on the study area freeways and arterials. The location in the text containing the supporting data for each finding is identified.
Overall Traffic Trends and Facility Shares
- The 91X lanes carry a substantial share of the weekday traffic in the SR 91 corridor. After opening day, weekday 91X lane traffic increased steadily until the opening of the Eastern Toll Road (ETR) in October 1998. By September 1998, the total weekday two-way average daily traffic (ADT) using the 91X lanes had reached its peak level at about 33,000 vehicles per day (over 14% of the total weekday SR 91 ADT). Weekday 91X traffic then decreased steadily during the first 6-8 months after the ETR opened. By summer of 1999, the 91X weekday traffic had reached about 24,000 vehicles per day, with no further decreasing trend evident. (Section 2.3, Figure 2-1.)
- 91X traffic in the morning peak direction has been consistently less than in the afternoon peak direction, when congestion in the free lanes is worse. After the ETR opened, that difference increased. 91X lane traffic as well as ETR traffic on Friday afternoons consistently and significantly exceeds all other periods. (Figure 2-3 and Figure 2-4.)
- The trends in 91X weekend traffic have been different from weekdays. The highest weekend ADT values were about 20,000 for a Saturday, reached in August 1998, and about 17,500 for a Sunday, in May 1997. The effect of opening the ETR on weekend 91X traffic was not as great as for weekdays. (Figure 2-2.)
- The weekday ADT on SR 91 (free and toll lanes combined) increased substantially during the months following the capacity increase from opening the toll lanes. The average midweek ADT increased by about 32,600 daily trips between the last quarters of 1995 and 1996, nearly a 17% jump in total daily traffic. Over the same period, midweek 91X lane traffic grew to 24,500 vehicles per day. Between the last quarter of 1996 and the third quarter of 1998, before the ETR opened, the SR 91 total midweek ADT (free plus toll) increased another 3,650 trips (1.6%), while the 91X ADT increased by 6,900 trips to about 31,400. By September 1998, the 91X lanes carried over 85% of the cumulative growth in corridor traffic (31,400 of 36,300) since the toll lanes opened in December 1995. (Section 2.6, Figure 2-22 and Figure 2-23.)
- During its first three months of operation (October-December, 1998), the average midweek ADT on the new ETR toll highway reached 21,200 vehicles per day. This occurred at the same time as the 91X toll lane traffic decreased 3,900 vehicles per day, and the SR 91 free lane traffic decreased 7,400 vehicles per day. The remaining 9,900 vehicles per day is the estimated increase in overall corridor traffic (ETR plus SR 91 -- free and toll, measured at the 91X midpoint). Because the ETR serves some trips between locations entirely within Orange County, only part of this increased traffic crosses the county line. Also, a small portion of the increase may be double-counted. (Figure 2-24.)
- Rough estimates available from ramp counts suggest that just over 20% of the total SR 91 traffic increase (free plus toll) in the first year after the 91X lanes opened (about 7,000 of 32,600 vehicles per day) may be traffic returning to the state highway from parallel city streets. Although traffic congestion on SR 91 increased between 1996 and 1999, the shift of traffic back to the freeway from parallel arterials which accompanied the opening of the 91X toll lanes has mostly continued. (Section 2.7, Figure 2-26.)
- During its second and third quarters of operation, the midweek ADT on the new ETR increased steadily, reaching an average of 33,100 vehicles per day in May-July, 1999. The growth in ETR traffic during this seven month period (+11,900 vehicles per day) was accompanied by a further 5,900 vehicles per day decrease in traffic on the 91X toll lanes. In all, the total decline in 91X traffic by summer 1999 corresponds to about 30% of the total ETR traffic growth during the same period. (Section 2.6, Figure 2-1 and Figure 2-7.)
- Throughout the study period, traffic volumes remained stable in the SR 57/60 freeway corridor located roughly parallel to SR 91, about 16 km. (10 mi.) to the north. In addition, field observations showed no association between opening the 91X toll lanes and changes in HOV traffic using the SR 57/60 corridor. This indicates that the influence of the toll lanes, while locally important, did not induce detectable traveler route shifts at the regional scale. (Section 2.7, Figure 2-25.)
- CPTC reported it had issued about 124,000 transponders by the end of 1999, joining approximately 240,000 transponders issued by the public toll road authorities in Orange County. (Section 2.3.)
- The ETR accepts tolls paid using Fastrak transponders or cash. A consistent 60% of weekday users and 50% of weekend users have used Fastrak since the road opened. (Figure 2-13.)
Adjustments Accompanying Changes in Tolls and Traffic Conditions
- The first general toll increases which occurred in January 1997 was followed by a significant and permanent reduction in the rate of 91X traffic growth. Subsequent general toll increases, which were less substantial and focused on fine tuning of the hour-by-hour toll schedule, were not followed by visible changes in the overall 91X ADT trend. (Section 2.3, Figure 2-1.)
- There exists a strong correlation between express lane patronage and time of day dependent travel time savings. Over the entire period of observation, the percentage of SR 91 travelers who used the express lanes ranges from about 7% in the midday off-peak, when time savings are minimal, to around 35% in the heaviest PM peak hour when delays to freeway users are worst. The implied values of time for persons who use the toll lanes during the peak hour range from $6 to nearly $14.17 Since our surveys with peak period travelers show that 91X commuters consistently overestimate their actual time savings when paying tolls, the actual values of time are lower than these estimates. (Section 2.9, Figure 2-35 through Figure 2-37.)
- The increased capacity from adding two new toll lanes in each direction in December 1995 substantially reduced peak period congestion in the entire Orange County SR 91 corridor, giving short-term travel time benefits to all commuters. In the six months after the express lanes opened, the typical PM peak trip delay on the freeway fell from 30-45 minutes to 510 minutes per trip. Subsequently, delays increased gradually to October 1998 when they jumped to the 30-40 minute range following the opening of the ETR. During the first half of 1999, delays decreased somewhat, to about 30 minutes in the PM peak and less in the AM peak. (Figure 2-31.)>
- Time of day distributions of SR 91 traffic show that, in 1996, soon after the express lanes opened and the increased highway capacity no longer constrained demand, the PM peak traffic distribution changed to become much sharper than prior to and shortly after the opening. The reemergence of a sharp afternoon peak at approximately 5:00 PM occurred in the presence of a toll schedule which charged the same amount, $2.75, for the entire period from 3:00 to 7:00 PM. The introduction of a more differentiated toll structure in September 1997, with tolls varying by the hour, had little effect on the sharpness of the overall afternoon time of day distribution for the corridor, or of the 91X traffic specifically. However, in the morning peak, there did occur a small amount of peak flattening accompanying the more substantial hourly toll differences which were implemented during that time. (Section 2.8, Figure 2-27 and Figure 2-28.)
Observations about Ridesharing and Transit
- Within three months after the SR 91 toll lanes opened, PM peak traffic observations on all lanes of the highway showed a greater than 40% jump in high occupancy vehicles carrying were required to have transponders. (Section 2.10, Figure 2-38.)
- When HOV3+ users were charged a 50% toll in January 1998, about a third of the HOV3+ traffic (about 2,000 vehicles per day) left the 91X lanes, and HOV3+ traffic in the free lanes increased by the same amount. These changes occurred mostly during the shoulder hours and throughout the week, although much less on Friday afternoon. Following these changes, the total PM peak HOV3+ traffic in the corridor remained the same. (Figure 2-17 and Figure 2-38.)
- Through the entire period of observation, from 1994 through 1999, the counts of PM peak dual occupant (HOV2) vehicles remained essentially unchanged. HOV2 users of the express lanes pay the same tolls as SOV users, or half the toll on a per person basis. (Section 2.10, Figure 2-39.)
- The increase in HOV traffic which occurred after the toll lanes opened is measured relative to a small initial base. For example, throughout 1995, before the express lanes opened, HOV3+ vehicles averaged about 4% of the total SR 91 PM peak traffic. After the express lanes opened, the comparatively much larger growth in single occupant vehicle (SOV) traffic produced a small but statistically significant decrease in average vehicle occupancy (AVO). The AVO trend leveled off during the past few years. Notwithstanding the initial reduction in AVO, the counts of HOV2 and HOV3+ commuters increased significantly compared to the conditions which existed previously. (Section 2.10, Figure 2-44.)
- There is no evidence that the opening of the 91X lanes or the ETR impacted the development of public transportation patronage in the corridor, particularly the IEOC commuter rail line. The rail service has competed successfully throughout the observation period for a very small share (<1%) of the commute market. (Sections 2.11 and 2.12, Figure 2-45 and Figure 2-46.)
2.3 91X Toll Lane Traffic - Overall Trends
The SR 91 express lanes attract a substantial share of daily corridor traffic, especially during weekday peak periods. Trends in average weekday and weekend daily traffic on the 91X toll lanes appear, respectively, in Figure 2-1 and Figure 2-2. Toll lane ADTs after July 1997 are all averages of Monday through Friday for two weeks in each month, selected to avoid holidays and be consistent from year to year. Prior to June 1997, in some months two full weeks of data were not available. In these cases, the available data were averaged for each weekday, and then combined with other weekdays to create the necessary ADT estimates.
Since its opening, weekday traffic increased steadily on the 91X lanes until October 1998, when the new Eastern Toll Road (ETR) began competing for some corridor traffic. The weekday average daily traffic (ADT) on 91X toll lanes reached its peak value in Sept. 1998 at about 33,000 vehicles per day (over 14% of the entire SR 91 ADT).Temporary dips in ADT and a decreased growth rate coincide with some of the toll increases implemented between Jan. 1997 and Jan. 1999. These growth rate changes will be examined in greater detail later.
In contrast, after the initial growth period, weekend traffic achieved a plateau by summer 1997, staying generally level until the ETR opened in October 1998. Historical peak values were about 20,000 and 17,500 for Saturday and Sunday, reached in August 1998 and May 1997, respectively. Considering the more erratic trends on weekends, the influence of any ETR competition is not clearly visible. However, for both weekdays and weekends, any 91X traffic losses from ETR competition had apparently bottomed out by June/July 1999.
Figure 2-1
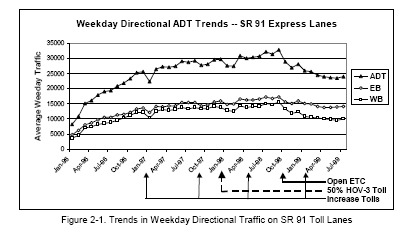
Figure 2-2
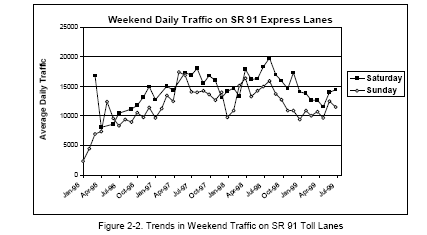
Figure 2-1 shows that weekday 91X lane traffic in the AM peak direction (westbound) is consistently less than the PM peak direction, where congestion is worse. After the ETR opened in October 1998, this directional imbalance increased. The increase probably reflects the fact that users of the new ETR impact and are impacted by the bottleneck at the county line much more severely in the eastbound direction than the westbound.
Figure 2-3
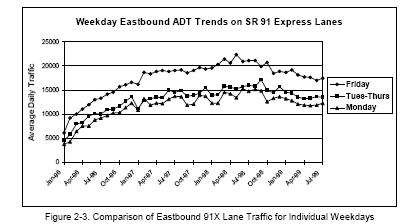
Figure 2-4
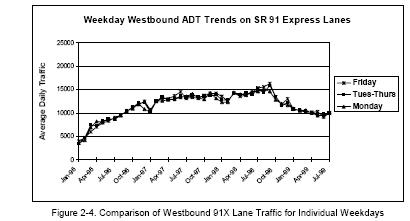
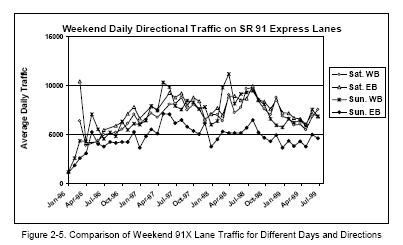
Another view of the difference in congestion effect appears in Figure 2-3 and Figure 2-4, showing that 91X traffic during the most severe Friday PM (eastbound) peak period consistently and substantially exceeds all other weekday commute periods, while Monday eastbound is consistently a bit less. The corresponding weekend directional ADTs in Figure 2-5 show that the Sunday eastbound traffic in the 91X lanes is consistently less than other days and directions.
Figure 2-5
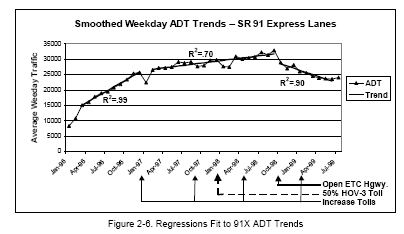
If we ignore the two-month startup period, the weekday ADT trend shown in Figure 2-1 appears to be composed of three distinct trend lines. Figure 2-6 shows in graphic form the result of fitting linear regressions to those three trends. The R2 values indicate that the three regressions fit the data well, and the three slopes all differ from zero and from each other at the 1% significance level. A Durbin-Watson test showed that serial auto-correlation was not present.18
The increase of Jan. 1, 1997 raised 91X tolls about 10% in peak periods and 100% off-peak. This first major toll increase was followed by a significant and permanent reduction in the rate of ADT growth. Although the apparent discontinuity in the ADT trend could reflect influences other than the toll change, the possibility that the toll increase is at least partly responsible is consistent with the results of choice modeling, presented in Chapter 5, which show commuters to be moderately price sensitive, such that a 10% toll increase should be followed by about a 7% drop in use of the 91X lanes.
Subsequent toll increases in Sept. 1997 and April 1998 refined the hour-by-hour toll schedule, while increasing the peak tolls about 5% each time. No visible effect in the overall ADT growth trend accompanied these later toll changes.
Figure 2-6
By the end of 1999, CPTC reported that it had issued about 124,000 transponders, supplementing approximately 240,000 additional transponders issued by the public toll road authorities in Orange County through the same period.
The opening of the ETR highway in October 1998 began a 6-8 month period of steady decline in 91X ADT, as many travelers appeared to switch to the ETR route for destinations in Irvine and points south. About midway during this period, on Jan. 31, 1999, 91X peak tolls increased again, although from the ADT trend alone it is impossible to distinguish any separate effect on the rate of ADT decline. It is interesting to note that before the Jan. 1999 increase, 91X peak tolls were in the range $2.85-$3.20, compared to the flat ETR toll of $3.25 between SR 91 and Irvine. After January 1999, eastbound 91X peak tolls became $3.20-$3.35 ($3.50 on Friday), for most hours exceeding the ETR toll, while westbound tolls increased only slightly to $2.90-$3.25, for most hours a little less than the ETR competition.
2.4 ETR and 91X Toll Traffic Comparisons
State Route 241, known as the Eastern Toll Road (ETR), opened in October 1998. This created an unusual opportunity to observe travelers' response to a fixed toll facility operating in partial competition with both a variable toll facility and a congested non-tolled freeway. Due to their different alignments, both the SR 91 and the ETR serve certain origin-destination combinations for which the other highway is not a reasonable choice. However, there are also many trips which are well served by both. For trips between Riverside County and some of the major employment centers of Irvine, the ETR provides a more direct congestion-free route. However, especially for eastbound PM peak traffic, the 91X provides congestion-free travel farther east, bypassing the severe congestion just west of the county line. The network layout is shown in Exhibit 2-A.
Exhibit 2-A19

The new ETR increased the complexity of the corridor travel patterns in two noteworthy ways. First, the northern terminus of the ETR connects only with the SR 91 free lanes, not the 91X toll lanes, which substantially impacts the bottleneck located between the ETR/91 interchange and the county line (especially eastbound). Second, unlike the 91X lanes, the ETR serves some traffic between locations solely within Orange County, for example, between Yorba Linda and Irvine. Some of these trips would simultaneously appear as reverse commute trips on SR 91 and as peak direction commute trips on the ETR. The locations of our principal count sites (at Imperial Highway on SR 91 and at Windy Ridge on the ETR -- see Exhibit 2-A) would cause such trips to be double-counted in estimates of total corridor ADT. However, examination of the reverse commute traffic on SR 91, before and after the ETR opened (e.g., Figure 2-28), shows no sudden jump in volume, which indicates that the amount of double-counting in the overall corridor ADT estimates is negligible.
This section describes the overall traffic experience for the first ten months of ETR operation, to establish basic comparisons with the 91X and the SR 91 free lanes. All ADT estimates for the ETR are based on data for one week per month, selected to avoid holidays and to match the dates of the SR 91 data used. All ETR counts in this section are from the Windy Ridge Toll Plaza, located on the northern leg of SR 241 just south of its connection to SR 91. These data represent only the portion of ETR traffic connecting to the SR 91 and exclude other ETR traffic connecting to the Foothill/Eastern Toll Corridor and other local interchanges.
Figure 2-7 shows the total and directional ADT trends for the ETR at the Windy Ridge Plaza location during its first ten months of operation. The data are the average weekday ADT, for Monday through Friday. Note that the southbound direction on the ETR corresponds to the westbound direction on SR 91, accommodating the AM peak period commute direction. The figure shows that in its first six months, ETR daily traffic grew to match the 91X (about 30,000 trips per day) and by July 1999, the ETR was carrying more traffic than the 91X had ever carried, on an apparent steady growth trend. Like on the 91X, PM peak (northbound) traffic consistently exceeds AM (southbound) traffic.
Figure 2-7
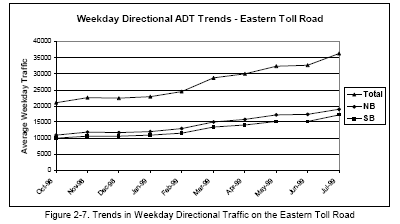
Figure 2-8 and Figure 2-9 show the time of day distributions of traffic, average for all weekdays. As expected, heaviest use occurs during peak periods. The ETR also has a small but distinct "reverse" commute to jobs in the vicinity of the SR 91 corridor, which the 91X does not serve. Otherwise, patterns are similar to those of the 91X, discussed in Section 2.8.
Figure 2-8
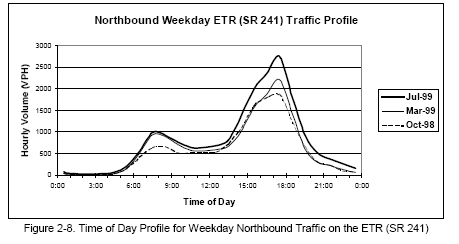
Figure 2-9
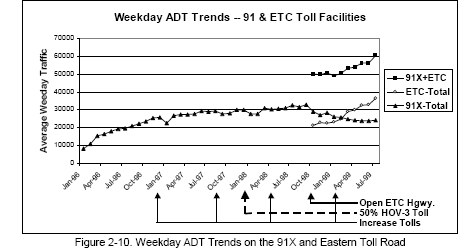
Figure 2-10
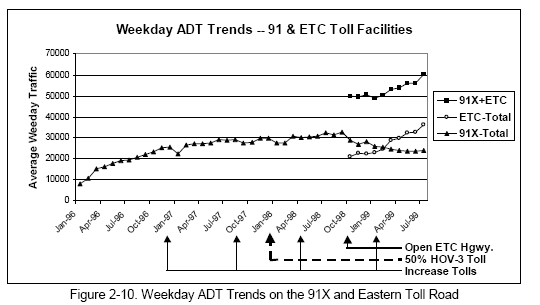
Figure 2-10 shows the results of superimposing the weekday average daily traffic trends for the ETR and 91X, over the duration of the 91X lanes' existence. The figure shows that the majority of initial weekday ETR trips were not previously paying tolls on the 91X lanes. A jump in daily toll-paying trips of about 19,000 occurred in October 1998 and, subsequently, the positive growth rate of the ETR ADT was about twice the shrinkage rate of the 91X traffic. As seen in Section 2.7, the increase in toll-paying trips after the ETR opened appears to be a combination of new trips in the corridor and previous freeway trips now paying tolls. Some of the new trips on the ETR are probably intra-Orange County, such as between Yorba Linda and Irvine, which cannot easily access the 91X lanes.
Figure 2-11 shows the corresponding directional ADT trends for weekend traffic on the ETR. The lightest day and direction, Sunday northbound, corresponds to the lightest traffic observed on the 91X. However, unlike the 91X, the weekend trend lines are still increasing. Figure 2-12 shows the weekend northbound time of day profile; the southbound profile is similar.
Figure 2-11
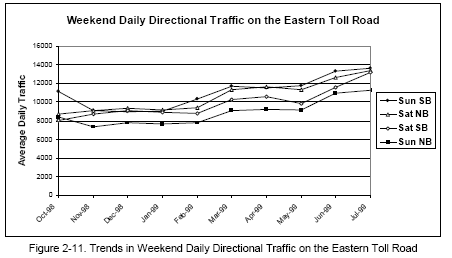
Figure 2-12
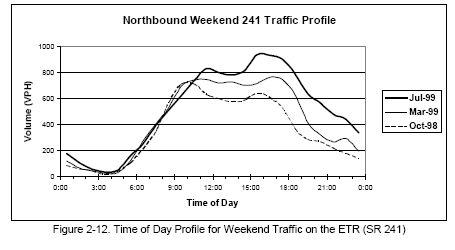
In addition to fixed tolls, a key characteristic of the ETR is that tolls may be paid with transponders or cash. Figure 2-13 shows the trends in the average percentage of tolls paid by transponder for midweek (Tuesday through Thursday) and weekends (Saturday and Sunday), by direction. Midweek commuters understandably have higher utilization of Fastrak transponders, but not dramatically so. It is interesting to note that these trends are flat through the observation period. Also of interest is that Fastrak use in midweek is consistently a little less for the northbound direction, suggesting greater spontaneity in the commuter's choice to take the toll road for the PM commute.
Figure 2-13
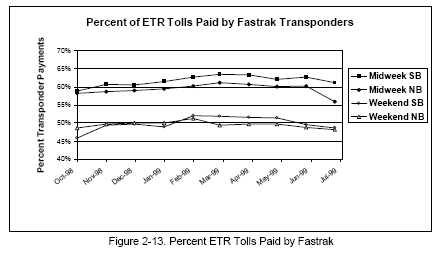
Figure 2-14
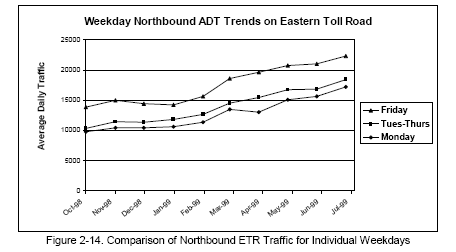
Figure 2-15
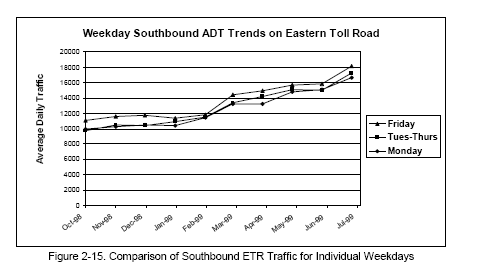
The final comparisons for the ETR appear in Figure 2-14 and Figure 2-15. Here the directional daily ADT differences and trends are shown. The pattern is similar to the 91X lanes (Figure 2-3 and Figure 2-4), in that the northbound ADT trend for Fridays, corresponding to the most congested PM peak, exceeds all other periods. Of interest is that the Friday afternoon effect appears to be the same magnitude for the ETR and 91X lanes even though, since April 1998, the Friday PM toll on the 91X has been more than at any other time during the week.
2.5 91X Toll Lane Traffic - Full v. Discounted Tolls
An important characteristic of the 91X toll structure is the mandated discount for rideshare vehicles carrying three or more people (HOV3+). During the first two years of operation, HOV3+ travelers on the 91X lanes paid no toll although each vehicle was required to carry a transponder. Starting January 1, 1998 HOV3+ users have been required to pay 50% of the regular toll.
Figure 2-16 shows the trends in 91X lane traffic distinguishing travel direction and toll type. A significant drop in the total daily use of the HOV3+ lanes occurred immediately after 50% tolls were imposed in January 1998. Although the full-toll ADT declined some at the same time, the full-toll traffic returned quickly to its previous trend, while HOV3+ toll traffic remained at the new lower level.
Figure 2-17 shows a larger view of the same HOV3+ trends with three separate regression lines fit to the portions before and after January 1998, and after the ETR opened in October 1998.
Figure 2-16
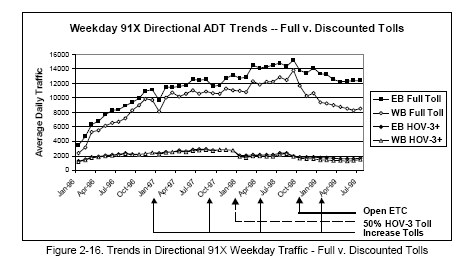
Figure 2-17
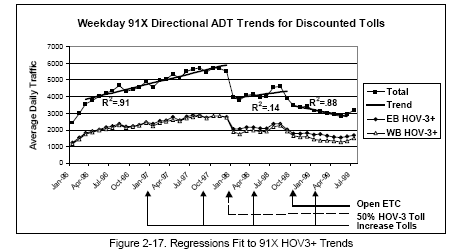
The regressions prior to January 1998 and after October 1998 both fit the data well, while the fit for Jan.-Sept. 1998, although visually close has poor statistical properties probably due to the combination of little data and an apparent up-curving data pattern. Based on the standard error of the regression prediction for January 1998, the drop in HOV3+ lane patronage after imposing the 50% tolls is 2111 vehicles per day, with an estimated standard deviation of 247, a highly significant change.
In addition, the negative HOV3+ trend through the eight months following the opening of the ETR in October 1998 is statistically significant at the 1% level. The negative slope closely tracks the decrease in total 91X traffic (Figure 2-6). From October to November 1998, based on the regression trends, 91X HOV3+ lane traffic fell 2.3%, compared to a 2.4% decrease in 91X traffic in all lanes.
The day-to-day differences in the weekday trends for 91X discounted tolls reveals an interesting difference. These data appear in Figure 2-18 through Figure 2-20. The Monday through Thursday trends mirror the average weekday patterns discussed above. However, the Friday PM (eastbound) direction clearly did not experience as sharp a drop in 91X HOV3+ traffic as other days, even though the Friday AM (westbound) direction did. A t-test applied to the average eastbound HOV3+ traffic comparing the nine months before and after January 1998 shows that Friday's decrease of 484 daily HOV3+ lane trips is statistically significant at the 1% level. The Friday decrease compares to the average decrease of about 700 daily trips for the corresponding Monday and Tuesday-Thursday eastbound traffic. Also, the difference between the decrease on Fridays compared to the decrease on Monday-Thursday, 484 compared to 700, is statistically significant at the 5% level, but not the 1% level.
An important question is what happened to these HOV3+ commuters after January 1998. Did they switch to the SR 91 free lanes? Did they abandon their high occupancy rideshare groups? It turns out that these former 91X HOV3+ lane users mostly remained in 3+ rideshare groups but switched to the free lanes. Also, the majority of the switching from toll to free lanes occurred in the shoulders of the peaks, when free lane congestion is less. This issue is explored in the next section and in Section 2.10.
Figure 2-18
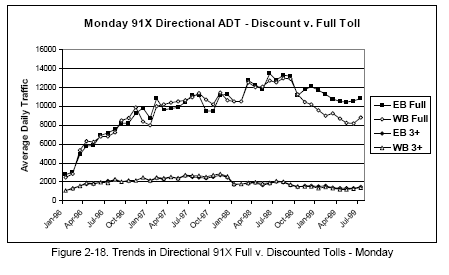
Figure 2-19
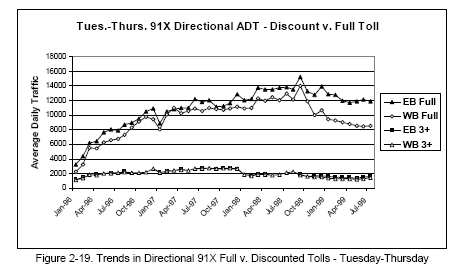
Figure 2-20
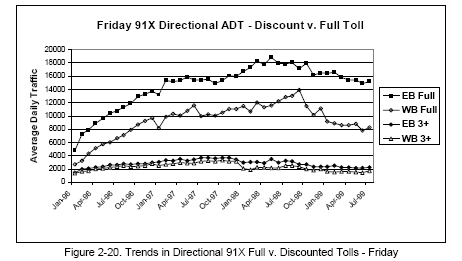
2.6 Combined Traffic Trends -Free and Express Lanes
This section examines combined traffic trends for the toll facilities and the SR 91 free lanes. The purpose is to quantify and compare changes in traffic over time which are related to the magnitude of traffic diversion among the different facilities. In particular, the section examines the extent to which the rapid growth in 91X and ETR traffic during their respective first few months of operation consisted of new trips or previous trips diverted from parallel facilities.
Figure 2-21 shows the SR 91 midweek ADT (free plus toll) for the period from a year before the 91X lanes opened through January 1999. Unfortunately, due to technical problems, the Caltrans loop data on which the SR 91 free lane counts are based were unavailable after Jan. 1999. The SR 91 free lane counts are from loops located in the vicinity of the Imperial Highway (SR 90) interchange, about two miles west of the mid-point of the toll lanes.
Figure 2-21
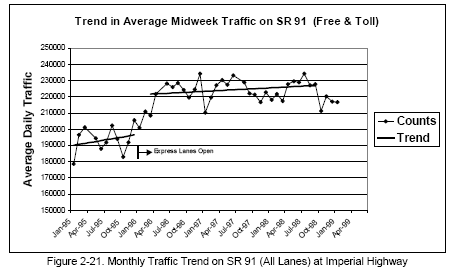
The freeway loop counts used for July 1997 through January 1999 are averages of a selected Tuesday and Wednesday each month, chosen to avoid holidays and to match, as much as possible, the dates of loop counts before July 1997. About half the monthly counts for January 1995 through June 1997 are averages for a selected Tuesday, Wednesday and Thursday; the rest are averages of two days (usually Tuesday and Wednesday) and, in a few cases, just one. Usually the counts for the east and west directions are added, however for most of 1995 the westbound loop data were not available, so the eastbound counts were doubled. Unfortunately, despite averaging and the effort to present consistent data from month to month, the loop data tend to be erratic. The monthly averages for 91X are mostly averages of Tuesday through Thursday for two selected weeks; the averages for the ETR represent Tuesday through Thursday for one selected week.
The monthly traffic trend for SR 91 (free plus toll) in Figure 2-21 shows two distinct segments. Before the 91X lanes opened in December 1995, ADTs were mostly in the range 190,000-200,000. Six months after the 91X opened, ADTs had climbed to the 220,000230,000 range, where they remained until the ETR opened in October, 1998. Two regression lines were fit to the data through December 1995 and from March 1996 through September 1998, after the toll lanes opened. These regression lines are also shown in Figure 2-21. Although they visually fit the trends, the regressions have poor statistical properties, with R2 values less than 0.1. The slopes of both regressions are also not statistically different from zero.
Figure 2-22 displays the same ADT data in the form of a quarterly bar chart, in which the annual average midweek traffic (AAMT) also appear as horizontal lines. T-tests show that the jump in AAMT from 1995 to 1996, estimated at 27,144, is significant at the 1% level (the standard deviation of the difference is 9127). Corresponding two-tailed t-tests comparing 1996 AAMT with 1997 and 1997 with 1998 (first three quarters, pre-ETR) show that the AAMTs are not significantly different.
Figure 2-22
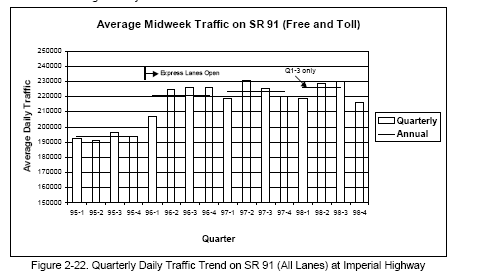
Figure 2-21 and Figure 2-22 lead us to conclude that in the past few years the traffic trend on SR 91 has been essentially flat. However, opening the 91X lanes in Dec. 1995 was accompanied by a one-time jump in the SR 91 AAMT of over 32,600 vehicles per day between the last quarter of 1995 and the last quarter of 1996 (a 17% increase). As discussed in connection with Figure 2-26 (Section 2.7), over 20% of the increase in SR 91 traffic during 1996 (7,000 of 32,600) is explained by traffic returning to the state highway from parallel city streets.
Figure 2-23 shows the corresponding midweek AAMT growth for the 91X toll lanes, showing in more detail the nature of the traffic changes after the new toll lanes opened. The quarterly data show that the growth in toll lane traffic lagged the overall corridor traffic growth. By the last quarter of 1996, about 24,500 vehicles per day were using the toll lanes, and 8,100 new trips per day (32,600-24,500) were using the SR 91 free lanes. From late 1996 to the third quarter of 1998, the overall corridor AAMT increased by another 3,650 trips per day (1.6%), while the 91X AAMT increased by 6,900 trips, to about 31,400. By September, 1998, the 91X carried over 85% of the cumulative growth in the overall corridor traffic (31,400 of 36,300).
Figure 2-22 and Figure 2-23 also illustrate that in the initial months after the ETR opened in October 1998, both 91X and overall SR 91 traffic decreased substantially. During the last quarter of 1998, the midweek ADT on the new ETR averaged 21,200 vehicles per day (summed from Figure 2-14 and Figure 2-15). During the same period, the decrease in overall SR 91 traffic is projected to be over 11,300 vehicles per day -- 3,900 from the 91X lanes and 7,400 from the free lanes. The difference of 9,900 vehicles per day (21,200-11,300) is our best estimate of the increase in overall corridor traffic (ETR plus SR 91 -- free and toll -measured at the 91X midpoint near Imperial Highway) which followed the opening of the ETR. These changes in overall corridor traffic are summarized in Figure 2-24.
Note that since the ETR serves some trips between locations entirely within Orange County, not all of the increased corridor traffic crosses the county line. Also, as discussed with Exhibit 2-A in Section 2.4, due to the locations of our count sites it is possible that a small portion of the growth in corridor traffic is counted twice.
During the subsequent seven months of ETR operation, the midweek ADT increased steadily, reaching an average of 33,100 vehicles per day by the period May-July, 1999. This increase of 11,900 vehicles per day (33,100-21,200) occurred at the same time that the midweek ADT on the 91X lanes decreased by 5,900 vehicles per day. By summer of 1999, the cumulative traffic decrease on the 91X lanes was equal to about 30% of the corresponding traffic growth on the new ETR. Unfortunately, the unavailability of mainline loop data prevents direct comparisons for the overall SR 91 facility after January 1999.
Figure 2-23
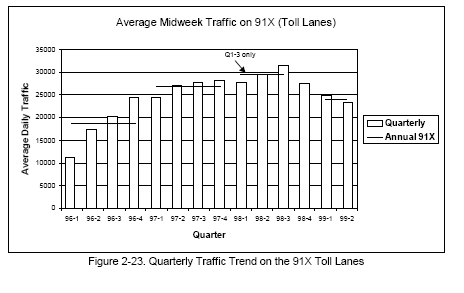
Figure 2-24
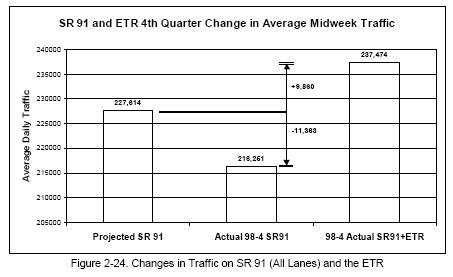
2.7 Diversion from Parallel Routes
Two different issues exist. First, do conditions in the SR 91 corridor cause shifts of traffic to or from other major highways which might be considered competitive with SR 91 for certain trip patterns? Second, do conditions on the SR 91 freeway (and express lanes) cause shifts of traffic to or from parallel arterials in the same corridor?
With regard to the first question, the most reasonable place to look for possible diversion to or from other major highways is on SR 60 and SR 57, which, like SR 91, connects the Riverside/San Bernardino bedroom communities to employment centers in Orange and Los Angeles Counties. To explore this possibility, average midweek daily traffic for SR 57 (Tuesday through Thursday) was calculated for a selected week each month for as much of the observation period as possible. These data appear along with the corresponding SR 91 ADTS in Figure 2-25. Note that the values for SR 57 include an HOV lane and the values for SR 91 include the express lane. Unfortunately, no loop data for SR 57 were available past September 1998.
Despite the erratic loop count data, the SR 57 ADT trend reveals no variations which might be attributed to changing conditions on SR 91. In particular, the trend has no discontinuities around December 1995 when the express lanes opened and when congestion on SR 91 suddenly improved. We therefore conclude that these data do not show the presence of route diversion on a regional scale.
Figure 2-25
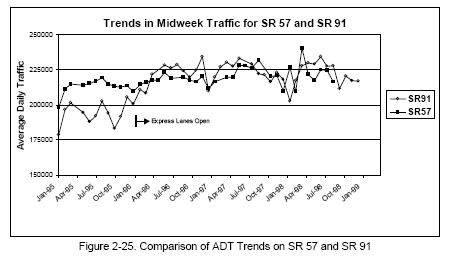
Regarding the issue of diversion to local streets, the available data support the case that, shortly after the express lanes opened in late 1995, some commuters who had previously used parallel arterials returned to the SR 91, probably due to its substantially improved travel conditions. The question exists whether that reduced diversion has persisted despite recently worsening freeway congestion. A schematic of the situation appears below:

The principal nearby parallel arterials are La Palma, north of SR 91, and Santa Ana Canyon Road along the south side. Both arterials extend east only to Gypsum Canyon Road, a short distance before the 91X terminus at the Riverside County line. No nearby parallel arterials cross the county line.
Figure 2-26 shows the midweek afternoon peak period traffic trends (averages of Tuesday through Thursday) for available weeks at one of the eastbound on-ramps at Gypsum Canyon and at both eastbound on-ramps at Weir Canyon. These ramps, especially the one at Gypsum Canyon, would be used by drivers seeking to travel on local arterials to bypass SR 91 congestion and then enter the freeway as close as possible to the county line. Although these loop data are erratic and contain gaps, it appears there are three distinct traffic levels for both ramps: prior to December 1995 when the express lanes opened, from January 1996 to March 1998, and from April 1998 to the end of the available data. The premise is that high counts correspond to periods when many drivers avoid the congested state highway to use parallel city streets, and low counts correspond to less such diversion. Figure 2-26 suggests that the use of parallel streets decreased substantially shortly after the 91X lanes opened, and increased again but by a smaller amount during 1998, when freeway congestion increased.
Figure 2-26
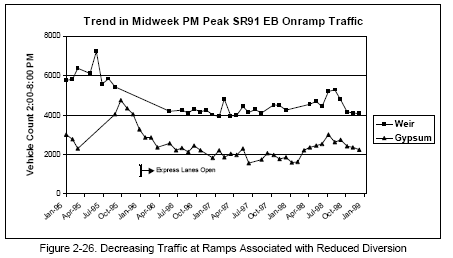
To explore the differences in more detail, t-tests were run to compare the average counts for the three time periods. The tests show that the decreased average peak period traffic at both ramp locations from before December 1995 to after December 1995 are statistically significant at the 1% level. The average traffic decreases for the six-hour peak period are 1785 vehicles at Weir Canyon (two ramps) and 1453 at Gypsum Canyon (one ramp). The corresponding increases in April 1998 are 351 and 343 vehicles for Weir and Gypsum Canyon respectively. The Weir Canyon increase is significant at the 5% level but not the 1%, while the Gypsum Canyon increase is significant at the 1% level for a two-tailed test. There is no apparent effect shown in the trend lines associated with opening the ETR in October 1998. (Note that the ETR is not accessible from the Gypsum ramps, but is accessible from the Weir Canyon interchange.)
If we assume that the traffic changes at the second Gypsum Canyon ramp (for which data are unavailable) are the same as at the ramp observed, and that the entire effect at both Weir and Gypsum in December 1995 is due to traffic no longer diverting to local arterials, then the total reduced diversion for the PM peak period is 4690 vehicles (=1785 + 2x1453). If we further assume that reduced diversion in the AM peak is half of the PM (since morning congestion is less severe), this gives a rough estimate for total reduced daily diversion of just over 7,000 vehicles per day, or about 20% of the 32,600 jump in average weekday traffic in the corridor which occurred in the year after the 91X toll lanes opened. Thus, about 80% of the increased overall SR 91 ADT (toll plus free) appears to be new traffic, probably related to the dramatically improved travel conditions. (Section 2.9 discusses the changes in travel conditions in detail.)
The small increase in ramp traffic observed for the period following April 1998 does not appear related directly to the ETR opening in October 1998. The change at Weir Canyon does not appear to be significant, while the change at Gypsum may be related to gradually deteriorating travel conditions on the freeway. In any case, the data provide some evidence that the original shift of traffic back to the freeway from parallel arterials, which accompanied the opening of the 91X toll lanes, has mostly continued.
2.8 Changes in the Time of Day of Travel on SR 91
Besides changing routes, some travelers adapt to congestion by changing the times of day they choose to travel. Although many commuters have little flexibility to change their trip arrival and departure times, other travelers are able to make such changes. Time of day shifts by a fairly small number of travelers can greatly affect travel conditions on a particular highway facility.
Figure 2-27 and Figure 2-28 show a progression of hour-by-hour traffic distributions for SR 91 in the eastbound travel direction. Counts include the free lanes and toll lanes for five typical weeks in successive Februaries concluding in January 1999 (since February data were unavailable). Each curve shows 15 minute loop counts averaged for a typical Tuesday, Wednesday, and Thursday.
The time of day distributions show some interesting effects. Since February 1995, the afternoon peak period on SR 91 has had a constant duration, about five hours long, developing about 2-3 PM and dissipating about 7-8 PM. Prior to the toll lanes opening (Feb. 1995), severe congestion reduced mainline flows, with flow rates during most of the afternoon noticeably less than at the beginning and end of the time period (roughly a bowl-shaped distribution). In February 1996, shortly after the toll lanes opened, congestion had almost disappeared because of the capacity increase, and the bowl shape disappeared, being replaced by a plateau-shaped distribution reflecting the temporal demand pattern which had previously been established.
By February 1997, a sharp peak period temporal demand pattern had emerged, roughly symmetric around 5:00 PM. To enable the emergence of the sharp peak, a substantial amount of the peak period traffic gradually shifted from the free lanes to the 91X toll lanes, as shown in Figure 2-1 and Figure 2-3. This gradual shift established the three-way equilibrium between time savings and tolls and persons' preferred commute time, which appears in February 1997. Approximately the same pattern appears in February 1998. However, by January 1999, the shape hints at the re-emergence of 1995's bowl-shaped distribution, reflecting restricted flow rates from the return of severe congestion.
Sharp peak period demand also appears in the February 1997 and January 1999 distributions for eastbound 91X traffic, shown in Figure 2-29.20 The figure shows basically the same distribution continuing, even though by July 1999 the amount of eastbound traffic on the 91X had decreased due to competition from the new ETR. It should be noted, however, that, despite the lower SR 91 traffic volumes, the additional traffic delivered by the ETR to the bottleneck at the county line caused eastbound PM congestion to become more severe.
Figure 2-27
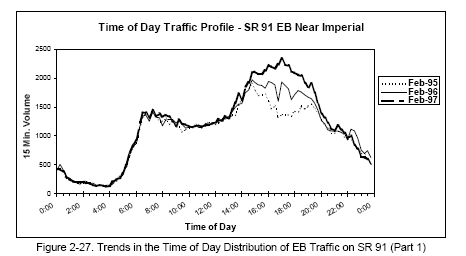
Figure 2-28
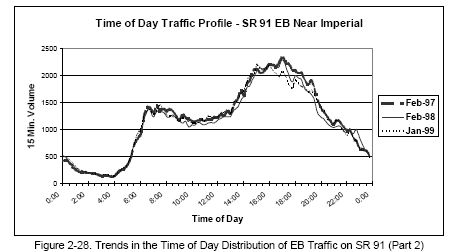
There is no evidence that the more time-sensitive toll schedules which began in September 1997 had any effect on flattening the eastbound PM traffic distribution. In February 1997, a single eastbound toll of $2.75 applied for the entire 3-7 PM period. In January 1999, the more time-sensitive eastbound toll was as follows:21
| 2-3PM | $2.25 |
| 3-4PM | $2.95 |
| 4-6PM (Tue) | $2.95 |
| 4-6PM (Wed) | $3.05 |
| 6-7PM | $2.95 |
| 7-8PM | $1.60 |
Figure 2-29
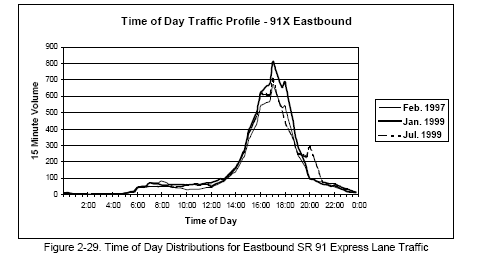
The time of day distribution for westbound traffic on the 91X toll lanes appears in Figure 2-30. A sharply peaked distribution appears in July 1997 and 1998, however the distribution for July 1999 lost its sharp peak following competition from the ETR. Note that after the ETR opened, westbound traffic decreased much more than eastbound. Traffic diverting to the ETR significantly reduced the westbound AM traffic congestion along most of SR 91 adjacent to the 91X lanes. This effect was opposite to the eastbound direction, where ETR traffic merging with the SR 91 freeway led to worse congestion along most of Orange County SR 91 adjacent to the 91X lanes.
Of interest is the possible role of the toll structure for the 91X AM peak westbound direction, which has consistently been more time-sensitive than the PM peak eastbound toll structure discussed previously. In July 1999, AM westbound tolls for Tuesday through Thursday were:
| 5-6AM | $2.90 |
| 6-7AM | $3.00 |
| 7-8AM | $3.25 |
| 8-9AM | $2.90 |
| 9-10AM | $1.95 |
| 10AM-12PM | $1.25 |
Figure 2-30
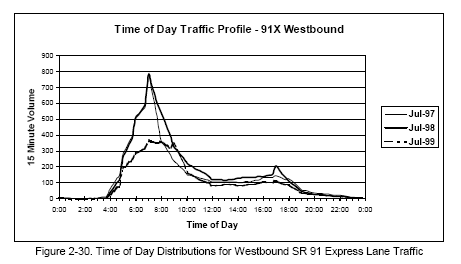
The AM westbound toll schedule in July 1998 was structured very similarly, all tolls being $0.05 less except for 9-10 and 10-11 and 11-12 AM which were $1.60, $1.10, and $1.00, respectively. In July 1997, a single westbound toll of $2.75 applied for the entire 5-9 AM period, falling to $1.50 for 9-10 AM and $1.00 subsequently. Considering these relatively low toll levels, it seems reasonable to conclude that the large change in the traffic distribution between July 1998 and 1999 probably reflected the influence of opening the ETR, not the changes in tolls.
We conclude that changes made to fine tune the toll structure hour by hour, which began in September 1997, have had a mixed effect on the shape of midweek hourly 91X demand. No visible effect is evident in the afternoon peak, which is not surprising since the midweek toll differences during 3-7 PM, where they exist at all, are minimal (±$0.10). However, differences in the AM peak (5-9 AM) are more substantial (±$0.25-$0.35). Indeed, between July 1997 and 1998, the amount and proportion of AM traffic using the 91X during 8-9 AM clearly increased more than in other AM peak hours. This may reflect the $0.35 toll decrease occurring at 8:00 AM. A chi-square test indicates that the 1997 and 1998 traffic distributions for the 4:00-10:00 AM period are significantly different at the 1% level.
2.9 Travel Speeds and Their Relationship to Express Lane Use
Travel conditions in the SR 91 corridor have varied a great deal during our four and a half years of observation. Before the express lanes opened in December 1995, the commute on SR 91 between Orange and Riverside Counties was one of the state's most congested. In 1996, with the new 91X lanes operating, congestion was greatly reduced as travelers shifted to take advantage of the newly increased capacity. Over time, with increased development and shifts in travel behavior, traffic and congestion in the corridor again increased, and the opening of the ETR in October 1998 suddenly delivered more peak traffic to the county line bottleneck, with worsened congestion, especially eastbound.
Figure 2-31 illustrates this overall historical trend in the form of comparative travel times estimated for the eastbound commute along the 11.3-mile section of the SR 91 freeway between the La Palma over-crossing, just east of SR 57, about 1.5 miles before the 91X entrance, and Coal Canyon Road, close to the county line. These travel times estimates are crude, made by interpolating data from loops located about every two miles along the highway, as described in Appendix 2-B (Section 2.14). Loop speeds are mostly averages over three mid-week days (Tuesday through Thursday) at the mid-points of the indicated time intervals. Despite the crude estimation method, the graph illustrates the long term pattern of congestion along the highway.
In mid-1995, congestion delays at 4-5 PM (travel time minus 11 min. free flow time) were about 30-45 min. In 1996, peak delay had dropped to 5-10 min., increasing gradually until October 1998, when peak delay returned to the 30-40 minute range. By January 1999, delays had reduced some, but remained higher than before the ETR. Although travel conditions worsened with the opening of the ETR, the data suggest that current PM peak delays remain less than in 1995, in both magnitude and duration. A corresponding eastbound graph could not be developed due to inadequate loop data.
Figure 2-31
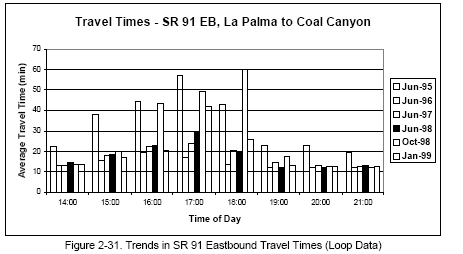
The location of the congestion shown in Figure 2-31 can be seen in Figure 2-32. These are time-space diagrams developed using the same data. Here, the reciprocal of the slope of each line provides a rough estimate of how speed changes along the route; the steeper the slope, the slower the speed. It is evident that, when congestion occurs, it builds backwards from the county line, near Coal Canyon Road. In June 1995, severe congestion reached as far back as Imperial Hwy.; in 1999, the congestion extended about to Weir.
Figure 2-32
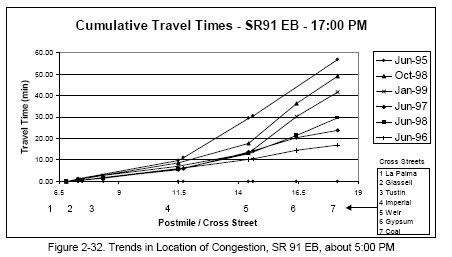
Figure 2-33
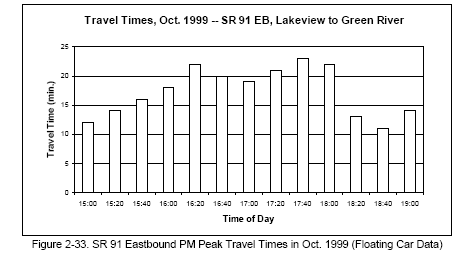
As a basis for comparison, data from floating-car runs were obtained from recent work for Caltrans' statewide congestion monitoring program. Figure 2-33 shows the travel time for a series of afternoon peak period runs for SR 91 eastbound, made on Thursday, October 28, 1999. Figure 2-34 shows corresponding westbound runs made the same morning. These data were taken from a 9.5-mile section between Lakeview Ave., located 1.3 miles west of Imperial Hwy. upstream of the location of recurrent afternoon congestion, and Green River Road, located 1.7 miles farther than Coal Canyon Road, a little beyond the Riverside County line.
Figure 2-34
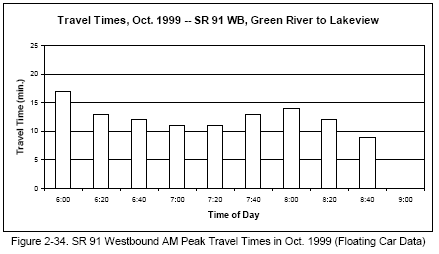
Figure 2-33 and Figure 2-34 show that, on the day examined, the largest observed afternoon peak delay was 14 minutes (subtracting 9 min. free flow time from the values shown) and the maximum observed morning delay was 8 min. The delays indicated in Figure 2-33 are about the same given by the January 1999 data in Figure 2-31, with the exception of the peak readings around 5:00 which, in January 1999, indicate a 30 min. peak delay (when 11 min. free flow time is subtracted from the values shown). The reason for this difference is not known. Figure 2-34 supports the contention that morning delays along SR 91 are much less than in the afternoon, although it should be noted that the heavy congestion which has developed in recent years along SR 91 between Green River Road and I-15 in Riverside Co. is not shown in these displays.
The available data show a strong relationship between patronage in the express lanes and the corresponding savings in travel time. Figure 2-35 through Figure 2-37 show for three different points in time how the percentage of total eastbound afternoon SR 91 midweek traffic using the express lanes varied with time of day and with the estimated trip time saved. As before, the trip times are crude estimates from loop data. Each time saving is calculated as the difference between the estimated trip time and the fastest observed time observed in these data through the section. (This compensates for any systematic biases in the speed values reported by the loops.)
The three figures show quite a consistent pattern. The percent of total SR 91 traffic in the 91X lane tracks the estimated time savings very closely. The three top values for the percent of traffic using the express lanes (35%, 37%, and 38% in 1997, 1998, and 1999, respectively) are similar across a wide range of maximum estimated travel time savings, from 12 min. in 1996 to 29 min. in 1999. It should be noted that the peak PM toll was $2.75 in 1997 and $2.95/3.05 (Tues.-Wed./Thurs.) in both 1998 and 1999.
Figure 2-35
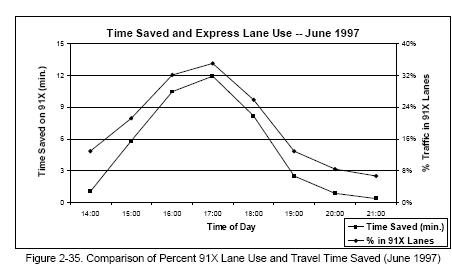
Figure 2-36
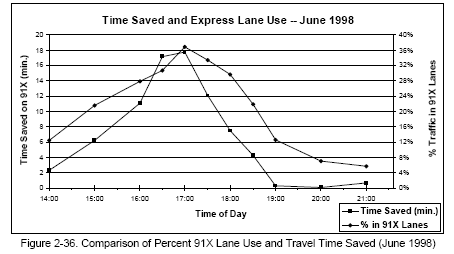
Figure 2-37
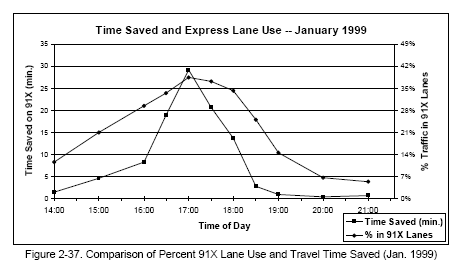
The implied value of time across these observations varies substantially. In 1997, peak hour travelers paid $2.75 to save a maximum of 12 minutes, implying a time value of at least $13.75 per hour per vehicle. In 1999, travelers paid about $3.00 to save a maximum of 29 minutes, implying a time value of just over $6.00 per hour per vehicle. Of course, these time values assume that loop time estimates are accurate and that travelers accurately estimate their time savings.22
Surveys with peak period travelers in the SR 91 corridor provide evidence that commuters consistently overestimate their actual time savings when using the 91X toll lanes. See Chapter 3 for details. This implies that actual values of time are less than estimated here. This overestimation of benefits also raises interesting questions with regard to how travelers' behavior might change if they had access to completely accurate real-time information about their true time savings.
2.10 Changes in Ridesharing
The 91X toll lanes were constructed on the site of a previously planned HOV facility. Therefore, it is important to examine the consequences of the 91X with regard to ridesharing. An extensive program of vehicle type and occupancy observations was carried out to obtain data pertinent to this issue. The procedures of this data collection program are described in Appendix 2-A (Section 2.13).
Most findings presented in this section were developed using observations for the PM peak period. The reason for this, as further discussed in Section 2.13, is that afternoon peak observations are more representative of peak flow conditions than morning observations. As it turned out, the scheduling of the afternoon observations coincided more consistently with the actual peak period flows. The AM observations were also made difficult by the very early start of the peak period, which resulted in substantial traffic volumes, especially rideshare groups, passing through the corridor in pre-dawn darkness.
After the SR 91 toll lanes opened, roadside counts showed a greater than 40% increase in the number of peak period HOV3+ vehicles and vanpools in the corridor. This may have reflected the fact that, for the first two years of operation, HOV3+ express lane users paid no toll. Beginning in January 1998, HOV3+ users were required to pay 50% of the regular toll, which was followed by a significant reduction in the total number of daily HOV3+ trips in the toll lanes. (See Figure 2-17 and accompanying discussion.) The question here is whether starting to charge discounted tolls for HOV3+ users adversely affected ridesharing in the corridor overall.
Figure 2-38 shows the year-by-year trend in HOV3+ observations eastbound in all lanes (free and toll) during the 3:30-5:30 PM period, obtained at the Lakeview over-crossing, which is about a mile after the toll lane entrance. These data are from manual counts and therefore subject to a variety of errors; nevertheless, the observations were done carefully and consistently over the years and provide a good relative measure of the trends, even though early and late portions of the peak period were not observed.
Figure 2-38
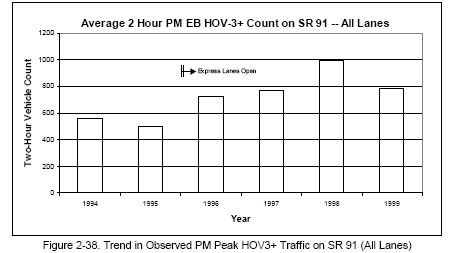
The jump in HOV3+ traffic after the 91X lanes opened in December 1995 is seen clearly in Figure 2-38. A t-test shows that the increase from the 1994-95 average HOV3+ count of 533 to the 1996-97 average count of 733 is significant at the 5% level, although not at the 1% level. It is evident that imposing 50% tolls on HOV3+ users did not produce a decline in overall HOV3+ use on SR 91. In fact, between 1996-97 and 1998-99, the average HOV3+ count increased from 733 to 905. However, this difference is not significant at the 5% level, probably because there are only seven observation days in 1998-99.
Figure 2-39 shows the corresponding year-to-year trend in observations of two person rideshare groups (HOV2). It is clear in the graph that the total annual average HOV2 counts on SR 91 did not vary from 1994 through 1998. Although the 1999 average HOV2 count appeared to jump dramatically, there were only three observation days in 1999 and the increase from 1996-98 to 1999 is not statistically significant at the 5% level.
Figure 2-39
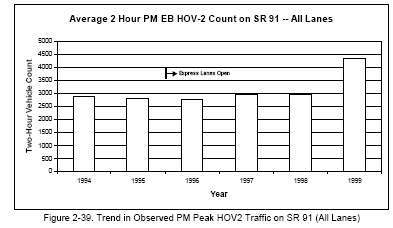
The data in Figure 2-38 and Figure 2-17 show that starting to charge 50% tolls for HOV3+ groups coincided with a significant decrease in HOV3+ trips in the 91X toll lanes and an equal increase in HOV3+ trips in the adjacent free lanes, with no net decrease in corridor ridesharing. The temporal characteristics of these changes are shown in Figure 2-40 and Figure 2-41. These distributions use three-day midweek average loop counts and are inherently more accurate than the manual occupancy observations presented above. The graphs show that most of the immediate decrease in daily HOV3+ traffic on the 91X occurred not at the peak of the peak periods but rather during shoulder times, before 3:00 and after 6:00 in the afternoons and before 6:30 in the morning. In addition, a large share of the nighttime eastbound HOV3+ traffic was lost. Surprisingly, counts of midday 91X traffic, especially westbound, though modest to begin with, appear largely unaffected by the imposition of tolls. Of course, midday tolls are comparatively low.
Figure 2-40 and Figure 2-41 also show the effect on the 91X HOV3+ lane counts following the decrease in 91X use after the opening of the ETR in October 1998. (See Figure 2-6.) Between July 1998 and July 1999, the 91X ADT fell about 7000 vehicles per day (23% of the July 1998 value). Over the same period, HOV3+ lane counts on the 91X decreased about 1100 vehicles (27% of the July 1998 total). These decreases may be attributed to competition from the ETR in the height of the peak periods, especially in the morning, when the 91X has less advantage for bypassing traffic backed up from the county line. Recall that at the height of the peak periods, the 91X tolls are equal to or slightly more than ETR tolls, but at off-peak, 91X tolls are much less.
Figure 2-40
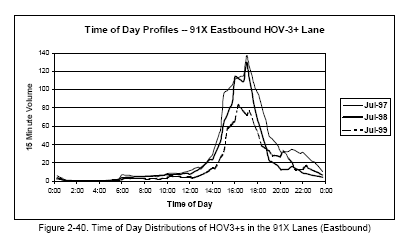
Figure 2-41
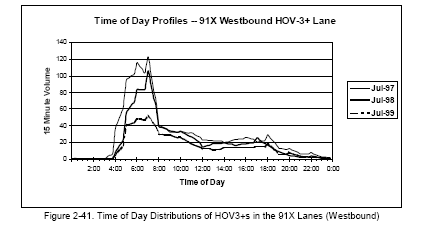
Figure 2-42 shows the overall comparison of afternoon observations made at Lakeview. Note that different Y-axes are used for the SOV and the two HOV data series. The steep SOV growth trend, in apparent contradiction to the earlier conclusion that overall ADT has been flat since 1996, probably reflects the gradual sharpening of the peak time of day distribution, as discussed in Section 2.8.
Figure 2-42
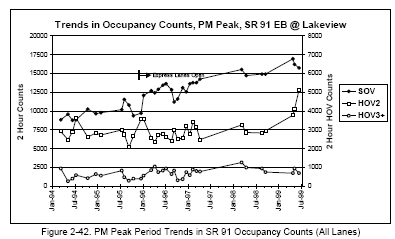
The steeper growth trend in SOV counts during the observation period is compared to slower growth in the HOV trends (as noted, the HOV2 trend is mostly flat). This creates a change in observed mode shares from year to year. As seen in Figure 2-43, the SOV share of traffic generally increases with time. The overall mode shares for the two years before and the three and a half years after the 91X lanes opening are compared in Table 2-I. The differences in the SOV and HOV2 shares are statistically significant at the 1% level, however the HOV3+ difference is not statistically significant. Note that the HOV2 share declined even though the HOV2 count remained stable, since both the SOV and HOV3+ counts increased significantly.
Table 2-I. Changes in Observed Commuter Mode Shares over Time
| Mode | 1994-95 | 1996-99 | Difference Significan t at a = |
|---|---|---|---|
| SOV | 74.3% | 78.3% | 1% |
| HOV2 | 21.7% | 17.3% | 1% |
| HOV3+ | 4.0% | 4.5% | 25% |
Figure 2-43
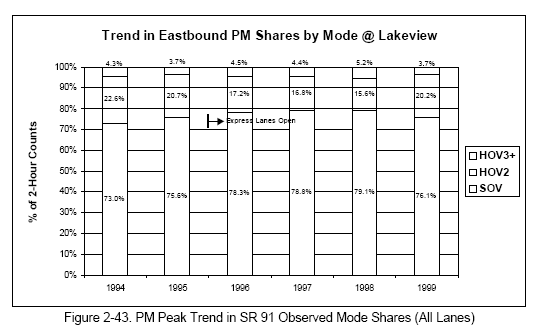
The mode share data for SR 91 can be used to estimate average vehicle occupancy (AVO) for the observation period. Note that in estimating AVO, van occupancy is omitted due to the impossibility of establishing average van occupancy. Buses are also ignored. For HOV3+ carpools, an average occupancy of 3.23 is used, based on the occupancies for this vehicle type reported in the travel survey.
Figure 2-44 shows the time trend in AVO, with two sets of regression lines fit to the data. One regression, fit to the entire data series, has a negative slope. The other regression, fit separately to the data series before and after the 91X lanes opened, has a negative slope for 1994-95 and a flat slope (a constant AVO of 1.27) for 1996 on. Although visually good fits, R2 values for all three regressions are very poor (less than 0.15). The two-sided t-statistic for the one-regression line fit indicates that the negative slope is significantly different from zero at the 5% level, but not the 1% level. For the two-regression line fit, neither slope is statistically significant at the 5% level.
For the sake of comparison, two compatible vehicle occupancy observations were made for the 3:00-5:30 PM period on the Eastern Toll Road (SR 241) in spring 1999. The data from these observations are presented below:
Table 2-II. Commute Mode Shares Observed on the Eastern Toll Road
| Date | April 1999 | May 1999 | Average |
|---|---|---|---|
| SOV | 81.4% | 74.7% | 77.9% |
| HOV2 | 14.9% | 21.6% | 18.5% |
| HOV3+ | 3.6% | 3.7% | 3.7% |
| AVO | 1.23 | 1.30 | 1.27 |
Figure 2-44
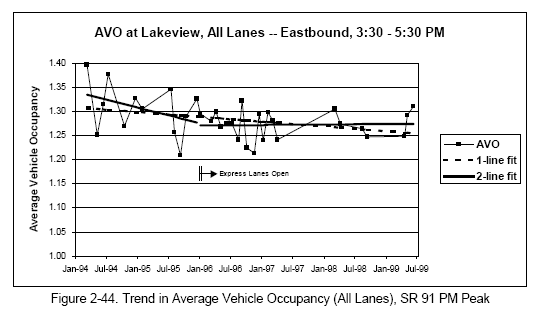
The average observed mode share breakdown and AVO observed on the ETR are similar to the recent observations on SR 91. The AVO and average percent HOV3+ are equal. Differences in the SOV and HOV2 shares are within the range of sampling variability. With the limited data available, there is no evidence of any systematic difference in travel modes between users of the SR 91 and the ETR. Overall, we conclude that opening the 91X lanes had a generally positive or neutral effect on ridesharing. PM peak HOV3+ use increased and was not adversely affected by the 50% toll imposed in January 1998. Although HOV3+ use of the 91X toll lanes significantly decreased, overall HOV3+ ridership in the corridor did not decrease. HOV2 counts remained stable throughout the period. The measured reduction in AVO presents a mixed picture, and probably as much reflects time of day shifts in response to increased peak capacity (from adding two more lanes) as actual shifts in mode. As explained in Appendix 2A
(Section 2.13), it should be emphasized that the data for most of these estimates are subject to errors in observation. Also, they pertain to just two hours of the approximately four-hour afternoon peak period.
2.11 Trends in Bus Ridership
These sections document trends in public transportation patronage in the SR 91 corridor. The question is whether operation of the 91X lane has influenced the ridership of either the express bus or the Metrolink commuter rail line which parallel the facility. The section addresses the concern that opening the 91X lanes could adversely affect transit ridership by providing an attractive new option for commuters seeking to avoid traffic congestion.
This section considers the Route 149 express bus, dubbed the "super-bus," which operates between the City of Orange, near the SR 55/91 junction, and downtown Riverside. Much of the route runs on the SR 91 freeway. The bus serves points near the freeway in Corona and Riverside. Route 149 is operated by the Riverside Transit Agency under a cooperative agreement with Orange County Transit. The service patterns in effect during this study are shown in Exhibit 2-B through Exhibit 2-D.
The express bus line has been in continuous operation since well before the 91X lanes opened, however financial constraints led to a significant service cutback in July 1995. Prior to the cutback, nine round trip runs per day were provided; subsequently service dropped to five round trips per day. In February 1996, service increased to six round trips per day with the addition of one more PM round trip (the AM peak schedule was unaffected by the 1996 change). In June 1997, frequency was again increased to seven round trips per day with the addition of another PM run; however, at that time the route in Orange County was cut back to the Mall of Orange, whereas it previously had extended to Disneyland. Service did not change from June 1997 through summer 2000.
It has been suggested that the 91X lanes could complement the express bus service if Route 149 could be re-routed to use the lanes and avoid congestion delay. However, to do this, Route 149 would have to enter the freeway upstream of the Mall of Orange and eliminate local service along Santa Ana Canyon Road in Anaheim Hills. The weaving movements between the freeway on-ramps near Lincoln Ave. serving the Mall of Orange and the 91X entrance are problematic.
Although Route 149 does not use the 91X lanes, its operating speed probably improved a bit due to better travel conditions on Santa Ana Canyon Road after the toll lanes opened. It is noteworthy that the schedule has not changed since 1997, indicating that bus speed has probably not been greatly impacted by recently increased congestion. (However, we did not examine whether schedule-keeping has become more of a problem.)
Figure 2-45 shows the trend in average daily express bus ridership month by month through the duration of the study. The figure also shows the number of daily one-way bus runs on weekdays. The chart shows mostly stable ridership since early 1996, after patronage recovered from a mid-1995 drop in service frequency. A possible exception to the stable trend is in the last ten months of observations (Sept. 1998 - July 1999) where a possible downward trend is evident. We do not think that this recent downward trend is related to opening the ETR in October 1998, since Route 149 serves an entirely different origin-destination pattern than the ETR. However, it is possible that the decrease is influenced by schedule-keeping problems due to increased congestion. Unfortunately, we could not explore this possibility since neither on-board passenger surveys nor schedule-keeping analysis were part of our work plan.
Our report of May 1998 documents survey findings that few changes affecting the bus mode occurred in conjunction with opening the 91X lanes. Past surveys of highway users found no one reporting they had switched from the bus to driving or ridesharing. However, over a third of 34 1996 bus survey respondents who also commuted in the corridor in 1995 reported that they had previously used the highway mode, split about equally between drive alone and ridesharing.23
Exhibit 2-B
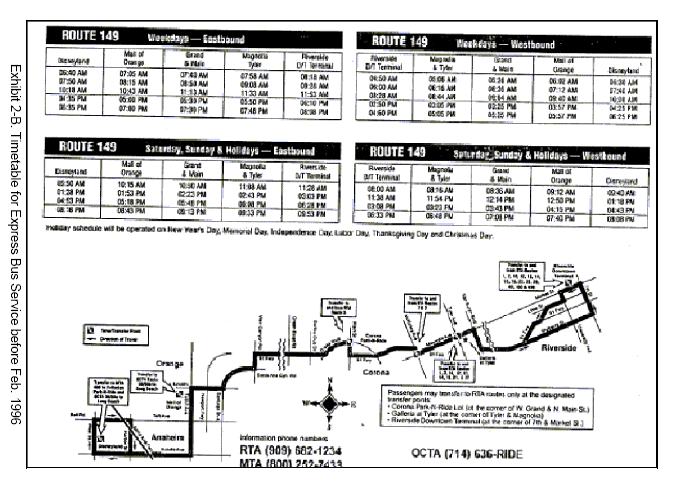
Exhibit 2-C
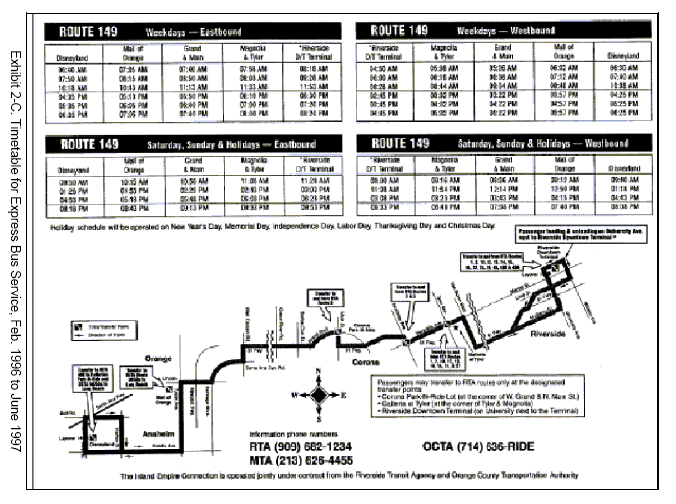
Exhibit 2-D
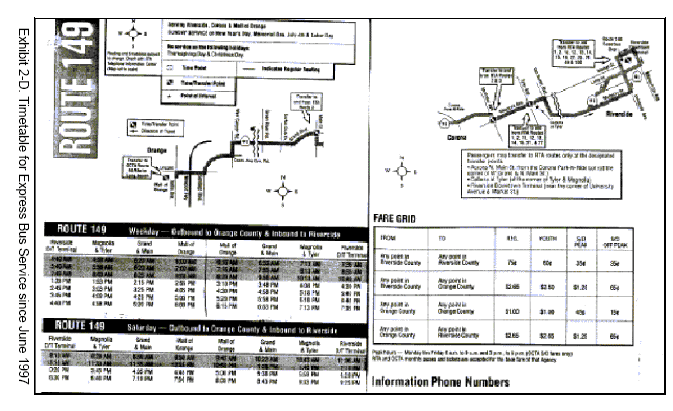
Figure 2-45
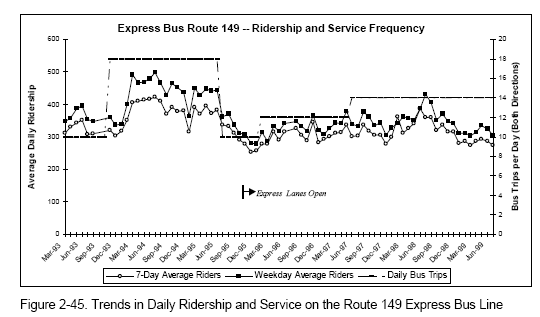
2.12 Trends in Commuter Rail Ridership
This section examines the trends in patronage on the Inland Empire - Orange County Metrolink line which began service parallel to SR 91 and SR 55 in October 1995. The IEOC line is one of the newest in the Metrolink network which spans the Los Angeles metropolitan area. It is operated by the Southern California Regional Rail Authority, a joint powers authority formed by the L.A. Metropolitan Transportation Authority, and the Orange, Riverside, San Bernardino, and Ventura County Transportation Authorities. The IEOC service as it existed in summer 1997 appears in Exhibit 2-E.
Between summer of 1997 and the present, service expanded three times. In September 1997, IOEC added an additional PM peak run. An additional AM peak run was added in October 1998. Two midday runs were added in November 1999, increasing the present weekday service between Orange County and Riverside/San Bernardino Counties to twelve runs, six each way. The current IEOC schedule is shown in Exhibit 2-F.
The fact that the IEOC Metrolink line opened just two months prior to the 91X lanes makes it impossible to measure the independent effects of either new service. The evolution of average daily IEOC riders since service inception is shown in Figure 2-46. The trend probably reflects about twice the number of persons using the train because most commuters make round trips. The daily rail patronage of 1,000-2,000 boardings (both ways) is less than 1% of the SR 91 ADT, and also less than the usual day to day variation in highway traffic volumes.
Exhibit 2-E
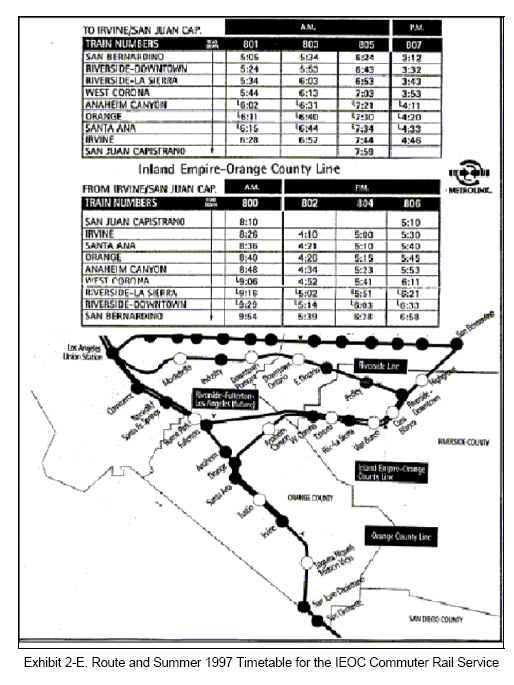
Exhibit 2-F
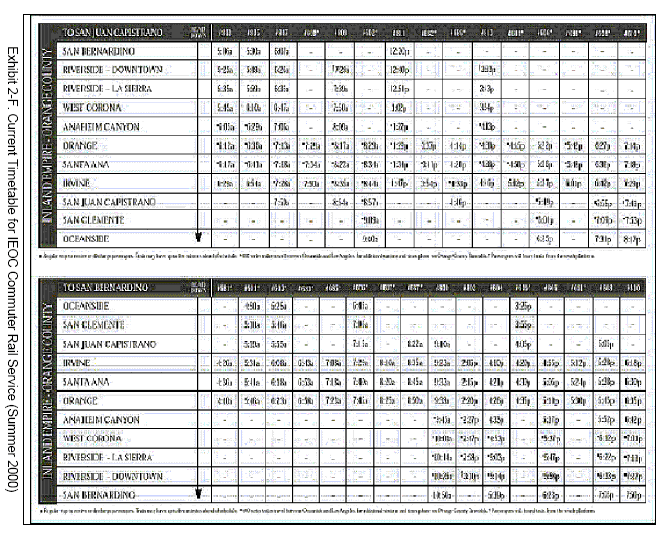
Figure 2-46
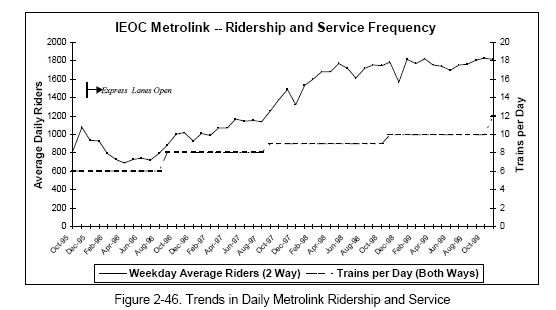
The trend in Figure 2-46 suggests that shortly after the introduction of IEOC service and after the initial promotions concluded, patronage slipped and remained rather flat for nearly a year, until service frequency was increased from the initial six trips per day to eight trips as shown in the schedule of Exhibit 2-E. After fall 1996, rail patronage experienced a long period of sustained steady growth, which changed in mid-1998 to very gradual growth, with patronage reaching about 1,800 passengers per day. The trend line provides no visual evidence that IEOC patronage was affected by the opening of the ETR in October 1998.
Our previous report of May 1998 shows that, among Metrolink riders in 1996 who commuted in the SR 91 corridor in 1995, only 4% previously used transit and 65% previously drove alone (the remainder used ridesharing). No respondents in our fall 1996 survey of highway users reported using transit before the express lanes opened, however the absence of the rail line prior to October 1995 would obviously influence that finding.
Our fall 1996 survey of about 350 commuters revealed that 76% of IEOC Metrolink riders used the 91X lanes for some of their trips. 73% drive alone when they do not use Metrolink and 14% carpool.
Overall, based on the limited bus and commuter rail ridership data examined, it appears that the 91X lanes did not take patrons from corridor transit services, while there exists evidence that some former highway users switched to transit.
2.13 Methodology Appendix 2-A: Collection of Vehicle Occupancy Data
Supplementing the ongoing HOV monitoring activities of Caltrans District 12, this study helped to support a long term program to observe vehicle occupancies and vehicle types at a number of locations throughout the study area network. The locations of these sites are illustrated in Exhibit 2-G and Exhibit 2-H, and listed in Table 2-III. Monthly observations began at most sites in March 1994. As the study continued, the list was adjusted in light of changing conditions. After July 1997, most sites were dropped since data analysis to that time revealed that, at most locations, changes which could be tied to the 91X toll lanes were not evident. During the initial part of the study, before July 1997, each site was visited once a month on a designated weekday, and once every three months on a designated weekend day. The schedule for site visits prior to July 1997 appears in Table 2-IV.
At each observation site, field personnel usually counted weekday traffic for three two-hour time blocks in the AM peak, midday, and PM peak periods, and for two two-hour time blocks in the morning and afternoon for selected Saturdays and Sundays.24 The counts for toll lanes and HOV lanes were taken almost continuously through the two-hour time blocks. Counts for mixed flow lanes were sampled on a lane-rotation basis. The counts estimated the number of persons in each personal vehicle and the number of vehicles of other types, as indicated in the example data summary sheet shown as Exhibit 2-I.
Exhibit 2-I shows a typical count summary, in this case a Thursday afternoon count for the SR 91 freeway section. These are five lanes at the observations site (four through lanes and an auxiliary lane) in addition to the two 91X toll lanes in the median. As can be seen, the five freeway lanes are sampled, and expanded to the equivalent 30 min. counts, while the special 91X lane is continuously and fully counted.
On weekdays, counts were usually made during the periods 6:30 - 8:30 AM, 11 AM - 1 PM, and 3:30 - 5:30 PM. On some days, the hours of observation were shifted to accommodate personnel scheduling (specifically, some morning counts were taken during the period 7:00 - 9:00.) The weekend observations were made consistently 9:00 to 11:00 AM and 1:00 to 3:00 PM.
The variations in the timing of AM peak period observations created a problem for using the AM data for long-term trend analysis. On SR 91, a substantial portion of the commute traffic, especially rideshare traffic, passes through the corridor quite a bit earlier than the 6:30 AM start time. This would distort AM AVO and occupancy group measurements. Consequently, the PM peak observation period was used to develop most of the results presented in this chapter.
Roadside observations of vehicle occupancies are technically challenging and yield data which, although useful for tracking comparative trends, are questionable with regard to absolute accuracy. Specifically, because of the observation angle, high speeds, tinted windows, difficult lighting, and other factors, it may be very difficult to observe correctly whether there are two, three or more persons riding in a vehicle. It is usually possible to distinguish between one and more than one person, but the distinction between two and three occupants is often elusive. Recognizing these problems, observation locations were selected carefully and field crews were trained to make judgments as accurately as possible, and especially to be consistent.
Exhibit 2-G
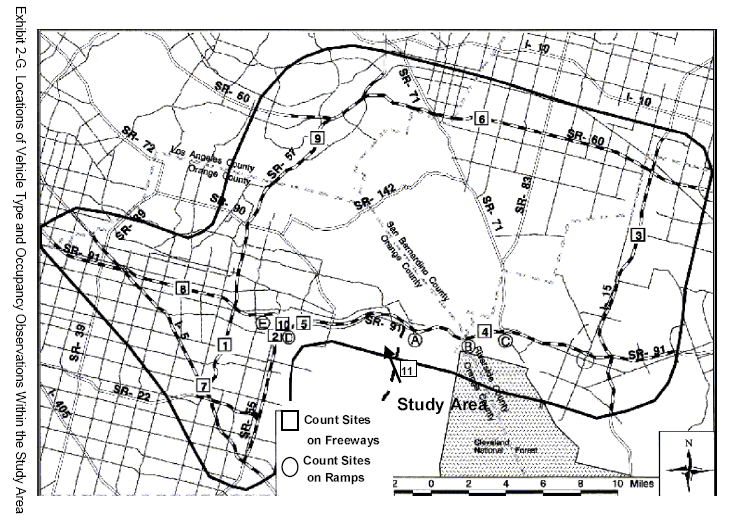
Exhibit 2-H
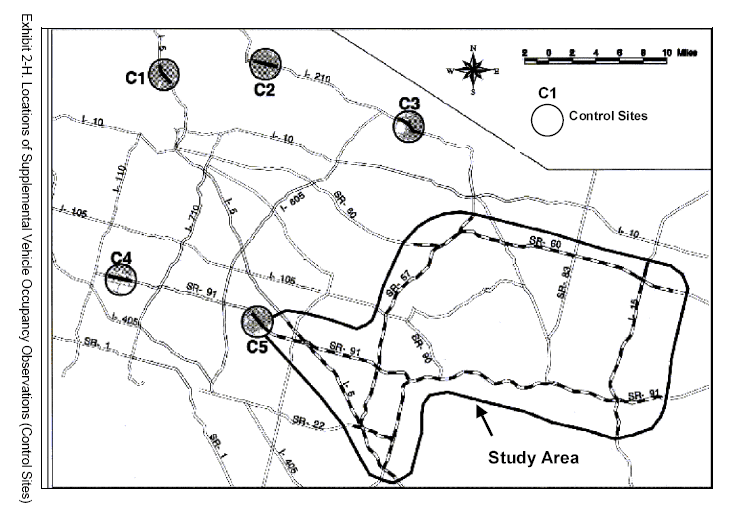
Exhibit 2-I
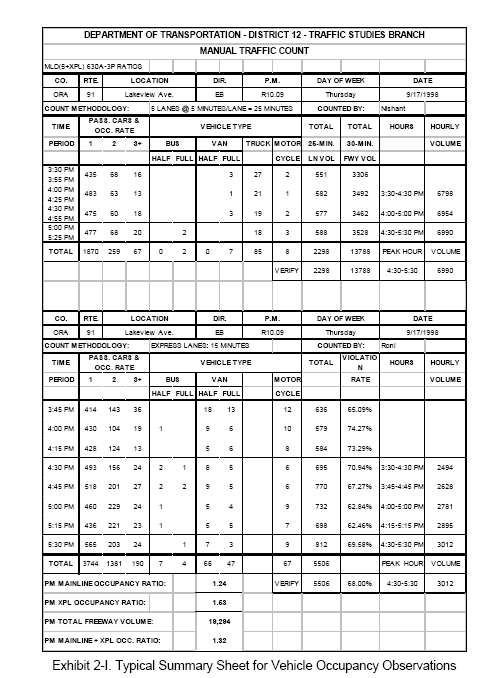
Table 2-III. Original Locations for Monitoring Mainline Vehicle Occupancies and Types
| Site Number25 | Site Description26 | Postmile (Zone #)27 |
|---|---|---|
| 1 | SR 57 near Ball** | 13.5 (858N, 724S) |
| 2 | SR55 near Meats/Collins** | 16.8 (603N, 610S) |
| 4 | SR 91 near Green River** (12/95) | 16.5 (837E, 838W) |
| 5 | SR 91 near Lakeview ** (12/95) | 10.0 (825E, 827W) |
| 6 | SR 60 near Ramona | 30.4 (328E, 346W) |
| 7 | I-5 near Broadway | 33.1 (10N, 682S) |
| 8 | SR 91 near Harbor | 3.2 (416E, 426W) |
| 9 | SR 57 near Pathfinder | 3.2 (2833N, 2834S) |
| 10 | SR 91 near Riverdale** (12/95) | 8.36 (506E, 502W) |
| 11 | SR 241 (ETR) at Windy Ridge** (10/98) | 33.7 |
| C1 | I-5 near Griffith Park** | 24.0 (4349N, 4841S) |
| C2 | I-210 near Second** | 39.1 (2341E, 2772W) |
| C3 | I-210 near Wilson** | 26.9 (579E, 580W) |
| C4 | SR 91 near Wilmington** | 9.15 (294E, 299W) |
| C5 | SR 91 near Carmenita** | 0.5 (310E, 312W) |
Table 2-IV. Schedule for Data Collection at Freeway Sites
| Day | Sites Observed | |||||
|---|---|---|---|---|---|---|
| Monday | 8:SR 91 @ Harbor | 1:SR 57 @ Ball* | ||||
| Tuesday | 9:SR 57 @ Pathfinder | 5:SR 91 @ Lakeview** | ||||
| Wednesday | 3:I-15 @ Limonite | 6:SR 60 @ Ramona | ||||
| Thursday | 4:SR 91 @ Green River** | 7:I-5 @ Broadway | ||||
| Friday | 2:SR 55 @ Meats/Collins* | 10:SR 91 @ Riverdale** | ||||
| Saturday | 1 | 2 | 9 | 5 | 8 | 10 |
| Sunday | 3 | 7 | 4 | 6 | – | – |
| * Indicates sites with HOV lanes during the entire data collection period. ** Indicates sites with toll or HOV lanes after December 1995. Notes Id. numbers correspond to locations in Exhibit 2-G. Weekend observations were made quarterly. |
||||||
In addition to the eleven observation sites in Orange, some vehicle occupancy counts were obtained for five control sites identified in Table 2-III. These locations are part of an ongoing data collection program of Caltrans District 7, which generally follows the same methodology used in Orange County. During the early part of the study, control site observations were obtained two to four times per year, depending on the scheduling and staffing constraints of the district. The District 7 control sites were intended to provide a rough comparison to the more frequent observations taken within the District 12 study area. They were included to assess the magnitude of any possible region wide changes in travel behavior that might occur during the study period. It turned out that no noteworthy region wide changes occurred. Consequently, the District 7 control site data was not used in developing the findings in this report.
During the first few months of the study, an arterial traffic counting program was implemented along Santa Ana Canyon Road and La Palma, parallel to SR 91, in order to monitor possible changes in traffic diversion between SR 91 and local arterials. When the special arterial counts were eliminated for economy, it was decided to monitor selected ramp traffic as an indirect means of assessing diversion. Ramp monitoring was done at the locations listed in Table 2-V. Data for these ramps were obtained from loop counts as well as from a limited schedule of field observations of vehicle occupancies which were conducted prior to July 1997.
Table 2-V. Field Data Collection Schedule for Ramps
| Site* | Sites Observed | Day | Time |
|---|---|---|---|
| A | Weir Canyon, Westbound Off-Ramp | Tuesday | AM |
| A | Weir Canyon, Eastbound On-Rampr | Tuesday | PM |
| B | Gypsum Canyon, Westbound Off-Ramp | Wednesday | AM |
| B | Gypsum Canyon, Eastbound On-Ramp | Wednesday | PM |
| C | Green River Road, Westbound On-Ramp | Wednesday | AM |
| D | Tustin, Eastbound On-Ramp | Tuesday | PM |
| E | Kraemer, Westbound Off-Ramp | Tuesday | AM |
| *Site locations are shown in Exhibit 2-G. | |||
Another source of information about vehicle occupancies is the study's origin-destination (O-D) surveys discussed in Chapter 3. Survey questions concerning vehicle occupancies provide valuable additional information on ridesharing of peak period travelers in the SR 91 corridor. These data are presented in the next chapter.
2.14 Methodology Appendix 2-B: Collection and Manipulation of Data on Freeway Counts and Speeds
This chapter makes much use of freeway traffic volume data for mainlines and ramps, as well as counts observed in HOV lanes along some study area freeways. Most of these count data were obtained from loop detectors installed at approximately half-mile spacing throughout the freeway systems of Orange and L.A. Counties.
Most of the freeway loop data used in the analysis were collected roadside and transmitted through phone lines to Modcomp computers located in Caltrans District 7 headquarters. There, the data were downloaded to archive tapes which were sent to Cal Poly and analyzed. Since freeways in Riverside and San Bernardino Counties (Caltrans District 8) did not have real-time loop surveillance at the time of the study, count data were not available in those parts of the study area.
During 1998 and 1999, freeway loops in Orange County (Caltrans District 12) were gradually unplugged from the Modcomp computers in District 7 and data were re-routed directly to the new ATMS Traffic Management Computers located in the District 12 office. During that time, the District 12 office moved to new quarters, and communication lines were interrupted for a few months in spring 1999. Efforts to recover some of the missing data from Oracle archive tapes generously provided by researchers at UC Berkeley proved unsuccessful.
In late 1999, the Freeway Performance Measurement Project (FPMP), a Caltranssponsored web site developed to provide access to archived loop data, became available at: http://transacct.eecs.berkeley.edu/. A large amount of recent speed data were downloaded from this facility; however, during the time of this study, FPMP coverage remained very limited and generally fell outside the scope of our analyses.
Despite all the time and effort spent investigating and trying to utilize the new loop data sources which were coming on-line as this study progressed, the old Modcomp archive tapes proved to be the most generally useful, in addition to special counts of the 91X lanes and the ETR made available by the responsible authorities. Fortunately, the SR 91 loops were among the last in District 12 to be unplugged from the Modcomp computers, therefore useful and consistent data were obtained from this single source through January 1999.
All of the sites listed in Table 2-III, where vehicle type observations were made, were also targeted for monitoring traffic volumes. For two of the sites located in District 8, nearby loops in Districts 7 and 12 were used. One location in Riverside County was too far from available loops to conduct traffic monitoring.
All Modcomp archived loop data employed by the study had a data averaging time of 5 minutes. 30 second average data is available, however using the 30 second data would have increased the data base size by a factor of ten, which was considered impractical.
Modcomp archive tapes sent from District 7 to Cal Poly were scrutinized for both coverage and recording errors. We found that many loops experienced considerable down times, ranging from a few hours (most likely due to transient electrical and communication line problems) to weeks or even months at a time (most likely due to construction activities). Loops being off-line due to road construction was especially common along SR 91 while the express lanes and HOV lanes west of the 91X were being constructed, as well as along SR 55 and I-5, where other major construction projects were underway.
It was discovered that loops which appeared to be functioning would occasionally provide obviously incorrect data, sometimes intermittently and sometimes for long time periods. Sometimes incorrect data would come from the loop in one lane while data from adjacent lanes appeared fine; sometimes data from all the loops at a site would be clearly unreasonable.
To deal with this variability in the quality of loop data, software was written to subject all of the data on the Modcomp archive tapes to a series of logical tests, based on whether loop counts and estimated speeds fell within reasonable ranges. When they did not, the software attempted to fix minor anomalies by interpolating or extrapolating values from adjacent lanes or adjacent time periods. Checks were included so that when the data for a particular site-day had too many errors to fix with reasonable confidence, the data for the problem location and time period were flagged as unusable.
The loop data which passed our tests for reasonableness were placed in an Oracle database to facilitate subsequent retrieval and manipulation. To perform the analysis presented in this report, queries were made to extract the needed data from Oracle, upon which the data were downloaded to Excel for manipulation and graphing.
Speed data were obtained from two sources: floating car runs using tacograph-equipped vehicles, and speed estimates from the loop detectors.
Speeds and travel times from tacograph-equipped vehicles are quite accurate, especially when experienced drivers are skilled at matching the probe vehicles' speeds to average speeds of surrounding traffic. The problem with tacograph runs is that they are very labor intensive and expensive; therefore the coverage is necessarily limited. Some tacograph coverage was available for selected peak periods with runs spaced 20-30 minutes apart.
Loops, of course, provide full coverage throughout the day. However, the half-mile loop spacing results in large gaps in coverage over the length of the freeway. Also, since particular loops are sometimes non-functional for weeks or months at a time, additional coverage gaps occur. Under the best of circumstances, loop speed estimates miss transient speed changes between loop installations. Also, it is impossible to estimate where speed changes occurring within the half-mile gap between loop sites are actually located. Both these problems introduce errors in loop-based travel time estimates.
Since the loops throughout Caltrans Districts 7 and 12 are single loop rather than double loop "speed trap" configurations, speeds must be estimated based on approximate densities, using the fundamental traffic flow relationship:
Q = K U
where Q is the traffic flow rate (vehicles per hour), K is the traffic density (vehicles per mile), and U is the speed (miles per hour). This relationship can be used to estimate speeds on a lane-by-lane basis or averaged across all lanes. In either case, the values are averaged over the 5 minute time period of observation.
For each 5 minute observation period, the flow value, Q, is obtained directly from the loop count for the period. The average density, K, is estimated from the fraction of the 5 minute period that vehicles are present above the loop. This recognizes that the fraction of time when moving vehicles are present above each loop is proportional to lane traffic density. Density estimation uses the relationship:

where Le is the effective length of the average vehicle (its actual length plus the length of the magnetic field over the loop), estimated by Caltrans as 22.18 feet; 5280 is the number of feet per mile; and O is the fraction of the observation period when vehicles are sensed as present above the loop (called "presence" or "loop occupancy"). The mechanics of presence measuring is that each loop senses whether or not a vehicle is above it 30 times per second, or 9000 times during the 5 minute period. Therefore, O is calculated by dividing the number of presence "clicks" by 9000.
In addition to the problem of coverage gaps along the length of the freeway, single loop-based density estimates suffer from technical difficulties measuring and transmitting presence clicks (for estimating O) and in the assumed value of Le. As noted, Caltrans uses the statewide average of Le=22.18 feet. Obviously, the correct Le value depends on the vehicle types present in the local traffic stream, which varies with both location and time of day. It would be desirable to calibrate Le against site and time-specific tacograph speed data, radar data, and/or video data to obtain more accurate density measurements loop by loop. However, the resources of the study did not permit this level of refinement.
Largely for reasons of economy, although some tacograph runs were available, loop-based speed estimates were used to develop most speed comparisons for the freeway mainlines. In these calculations, the five minute average speed estimates at the midpoint of the time period of interest were assumed to represent the simultaneous speeds at all loop locations along the section of highway considered. For example, for the 7:00-8:00 AM time period, reported loop speeds at 7:30 were used for the length of the section. The time-space trajectories which were estimated are what would result if vehicles traveled at the estimated loop speeds through the entire length of the highway section between a pair of loops. In each section, the estimated speed was taken as the average of the speeds obtained from the loops at both ends.
2.15 Methodology Appendix 2-C: Tests of Statistical Significance
Throughout the report, many references are made to the statistical significance of study findings. This appendix describes the statistical tests supporting these statements of significance.
As a rule, findings are said to be statistically significant if the relevant test rejects the null hypothesis at the 5% level or better. Generally, the "null hypothesis" is the hypothesis that a value is zero or that two values are the same (the difference is zero). A significance level ("α-level") of 5% means that there is less than a 5% chance of observing the values at hand if the null hypothesis is true. Another way to look at the significance level (α-level) is that it is the probability of being wrong in stating that an estimated value is non-zero or that two estimated values are different.
Throughout this report, findings are based on the 5% α-level. However, where a finding is also significant at the more exacting 1% α-level or better, this is often stated.
The statistical analyses performed were primarily of four different types:
- Chi-square hypothesis test for the difference in distribution of two or more multinomial variables.
- Standard linear regression analysis with a single independent variable,
- Hypothesis test for the difference between two estimated proportions,
- Hypothesis test for the difference between two independently estimated means.
The Chi-square test is the most frequently used tool to test the equality of two or more multinomial variables, and to test the independence of two categorical variables. If there are k different categories for a variable of interest, and there are p different groups or populations, this test determines if the multinomial distribution for the variable of interest is the same for the p different groups. For example, if income is categorized into five non-overlapping classifications, and three groups of commuters are classified by mode of travel (SOV, HOV2, and HOV3+), the Chi-square test can determine if the (multinomial) distribution of income is the same for all three groups of commuters.
We let Nij represent the actual number of individuals (or observations) in the ith group which fall in the jth category of the response variable, and let E(Nˆij ) be the estimated expected
frequency for that category of that group. If the (multinomial) distribution of all groups is the same, then the Chi-square statistic has the following formula:

where E(Nˆ ij )is equal to the total of the observations in the ith group times the total of the
observations in the jth category divided by the total number of observations combined. The summation is taken over all categories and groups. If the null hypothesis that the distributions are equal is true, the Chi-square statistic has approximately a Chi-square distribution with (p-1)*(k-1) degrees of freedom. When the calculated value of the Chi-square statistic is greater than the upper percentage point of the Chi-square distribution for some pre-chosen level of α, there is significant differences in at least some of the
multinomial distributions. Note that the validity of the statistic relies on the E(Nˆ ij) not being
too small. A common procedure is to require the estimated cell values to be at least five. More recent research has shown that a small number of cells (group-category combinations) may have estimated expected frequencies as low as two, as long as no cells are empty.
The Chi-square statistic and test can also be used to test whether there is an association between two categorical variables. This situation is used when we consider that we have one large sample, and we are interested in determining whether there is an association between what individuals answer on one question, and what they answer on a different question. For example, is there an association between income (placed in four categories) and whether or not an individual commuted on Route 91? The table and the calculations would be set up the same as above, but the null hypothesis would be that there is no association between the two variables (they are independent) with the alternative that there is some association. From a practical point of view, the conclusions in the two cases are very similar.
For analyses performed using standard linear regression, conclusions regarding the statistical significance of slopes used the standard t-test criterion applied to the estimated coefficient of the independent variable. A regression slope is considered statistically significant at a particular confidence level if the corresponding confidence interval does not contain the value zero. In addition, the quality of the regression line fit to the data is characterized by the R2, the square of the Pearson product moment correlation coefficient, generally regarded as the proportion of the variance in Y attributable to the variance in X. Formulas for calculating these estimates are available in any basic statistics text.
Many of the regression analyses presented in the report involve trends in time-series data, such as changes over time in daily traffic or accident rates. In these situations, Durbin-Watson tests for possible serial auto-correlation were performed. In no case did the test determine that significant auto-correlation is present.
The hypothesis test for the difference in proportions is used in situations where the data give estimates of proportions but no corresponding standard deviations. It is assumed that the data are randomly distributed according to a Binomial probability distribution, so the necessary standard deviation can be determined directly from the estimated mean. A null hypothesis is identified which states that the two proportions to be compared are assumed to be calculated from different data samples drawn from the same underlying probability distribution. The test investigates whether it is possible to accept this null hypothesis at the stated significance level. If not, we then draw the conclusion that the difference between the two estimated proportions is significant at the stated level.
As noted, the null hypothesis assumes that the proportions are the result of drawing the two data samples from the same Binomial probability distribution, for which P is the probability of each person giving the answer we are looking for. For example, if the objective is to test whether the proportion of travelers who choose to use the toll lanes is different for SOV compared to HOV commuters, P would be the average proportion of all commuters who use the toll lanes. P would be estimated by pooling the data for both SOV and HOV commuters, and calculating the average proportion for everyone. Then, the separate proportions for the SOV and HOV groups are compared to each other to see if it is reasonable to conclude that the separate proportions could be just different data samples drawn from the common underlying distribution, with mean P.
The test employs the following test statistic:

Where P1 is the first proportion, for example, the estimated proportion of SOVs who use the toll lanes, P2 is the second proportion, for example, the estimated proportion of HOVs who use the toll lanes, P is the pooled average proportion, usually obtained as a weighted average of P1 and P2, and N1 and N2 are the number of data points used to calculate P1 and P2. The Z value is compared to a standard normal distribution to determine the probability that the two proportions P1 and P2 could come from the same underlying probability distribution. If that probability is very small, we reject the null hypothesis that P1 and P2 are from the same underlying distribution, and we conclude that the difference between the two proportions is statistically significant.
To illustrate, consider commuters who travel 30-60 minutes to work. If 25% of SOV commuters and 50% of HOV commuters in this trip length category use the toll lanes, is this difference statistically significant? Let P1=0.25 and P2=0.50. Let‘s say that the number of observed trips used to calculate these proportions are N1= 181 and N2=103. The overall average —pooled“ proportion of commuters (SOV and HOV) using the toll lanes is then P=0.34 (a weighted average of P1 and P2). With these data, we calculate Z=-4.2, which according to the Normal distribution corresponds to a probability of about 0.00001 that the two proportions could be based on data drawn from the same underlying probability distribution. We then conclude that the difference between 0.25 and 0.5 is statistically significant at the 1% level. In contrast, if Z had turned out to be 2.0, we would have concluded that the difference is significant at only the 5% level.
The last type of statistical test often presented in this report examines the difference between two independently estimated means. It is similar to the test of the difference between proportions, except in this case the two estimates being compared are assumed to be Normally distributed, or in the case of small samples, by the Student's T-distribution. This test can be performed with any estimated averages, including proportions, provided that the data also provide estimates of the corresponding standard deviations. In this case, the null hypothesis is that the two estimated means are based on two data samples drawn from the same underlying Normal probability distribution. The —pooled“ standard deviation associated with the null hypothesis is calculated by:
![]()
where S1 and S2 are the estimated standard deviations corresponding to the two means being compared, and N1 and N2 are the corresponding number of data points. The test statistic is then calculated by:

Where X1and X2are the two averages being compared. The T-value is compared to the tabulated T-distribution with N1+N-2 degrees of freedom. If the degrees of freedom are large, say more than 30, the value can be compared to the tabulated standard Normal distribution.
To illustrate, say that the average estimated fatal and injury (F&I) accident rate for 17 weeks in 1995 is 0.50, while the corresponding average for 90 weeks in 1996-97 is 0.57. Are these rates significantly different? Let X1=0.5 and X2=0.57. Assume that the estimated standard deviations associated with these two averages are S1=0.148 and S2=0.152. Of course, N1=17 and N2=90. With these data, we calculate Sp=0.152 and T=1.65, which by the Normal distribution corresponds to a probability of 0.05 that the two means could be calculated from data drawn from the same underlying probability distribution. We therefore conclude that the difference between 0.50 and 0.57 in this case is statistically significant at the 5% level.
3. Investigation of Corridor Travel Behavior28
3.1 Introduction
In fall of 1999, travel surveys were conducted to explore the characteristics of peak period travel in the SR 91 corridor. Selected results from the 1999 surveys were compared to surveys conducted earlier, especially the major travel survey performed in fall/winter 1996. The findings of this analysis are the subject of this chapter. Opinions were also solicited from survey respondents, and these are discussed in Chapter 4.
The principal objectives of the 1999 surveys were to extend and update the earlier investigations of travel behavior and public opinions, and to highlight where changes may have occurred in light of changing conditions in the corridor. Of particular interest is the possible influence on travel of the new Eastern Toll Road (ETR) which opened in October, 1998, about a year before the surveys were conducted. Possible changes to be investigated include diversion effects (in route, time, and mode) and any relationships to external factors such as employer trip reduction programs and demographic-employment changes in the corridor.
The 1999 travel surveys, all conducted by telephone, involved four closely coordinated but distinct samples, providing a grand total of 1788 completed interviews:
- Present and former commuters contacted using the random phone-dial technique, drawn from surrounding areas in proportion to the geographic distribution of SR 91 commuters (645 respondents);
- Persons who also participated in our 1996 travel survey (the "panel" sample) (348 respondents);
- Persons identified through recent license plate observations on SR 91 and the ETR (730 respondents);
- Persons who participated in travels surveys of SR 91 commuters conducted by U.C. Irvine researchers in 1997 and 1998 (65 respondents).
The surveys included conventional origin-destination (O-D) questions supplemented by in-depth queries on use of the toll lanes, commuting strategies, and travelers' perceptions about the 91X toll lanes.29
The O-D questions addressed the location, length, time, purpose, mode, and route of each trip. Travelers were asked about their most recent peak period, peak direction trip on Monday through Thursday as well as a recent Friday trip, if different, or another weekday trip that differed in some material respect. Travelers were asked to contrast how they travel now with how they traveled in the corridor two years before, if they did. Questions on a variety of personal and household characteristics were included. Persons who formerly but no longer commute on SR 91 were only asked the personal opinion questions and a few special questions on why they no longer commute in the corridor. Detailed descriptions of the survey methodology and the statistical sampling aspects of the 1999 surveys are found in Methodology Appendix 3-A (Section 3.14).
The 1999 surveys extend previous data sets obtained from a sample of 1,300 peak period SR 91 highway users telephone-interviewed in fall of 1995, just before the 91X lanes opened, and from 1,001 peak period users (548 repeat respondents from 1995) in fall/winter 1996/97, a year after the opening. Two other small supplementary surveys of SR 91 highway users, conducted in spring 1996 and spring 1997, focused on public opinions and selected travel behavior issues. Additionally, two short self-administered travel and opinion surveys were administered to 129 bus riders and 368 commuter rail passengers in the corridor during 1995 and 1996; and a mail-out, mail-back opinion survey was conducted with 100 area businesses in winter of 1996/97. This collection of surveys provides a rich data set with which to track changes in travel behavior and public perceptions in the SR 91 corridor through this noteworthy four-year period.
This chapter presents information about travel behavior and traveler characteristics based on the 1999 surveys of SR 91 and ETR highway users, contrasting these with findings from the 1995/96 surveys where pertinent. As noted, survey results about travelers' opinions and perceptions appear in Chapter 4. Earlier findings that are not directly comparable with the 1999 highway commuter surveys, such as results from the survey of businesses and the on-board bus and rail survey are documented in the May, 1998, study report.30
The next section contains a summary of the major findings from the O-D and travel behavior portions of the surveys. Succeeding sections present the details of these findings. The survey instruments may be downloaded from the Internet.31
3.2 What We Learned about SR 91 Travelers and Travel Behavior
Respondents to our surveys have made many adjustments to their travel behavior during the past two years, a substantial number in response to worsening traffic conditions. The presence of toll facilities, and the toll levels, appear to have had some influence on these behavioral changes, but less than the effect of congestion. There are significant income and gender differences in the changes observed. Changes observed in mode and time of day of travel appear unrelated to commuters' frequency of using the 91X toll lanes.
The following are our principal specific findings about traveler characteristics and travel behavior in the SR 91 corridor, as related to changing travel conditions in the corridor. The location in the text containing the supporting data for each finding is identified.
Findings Concerning the Amount of Trip Making and Trip Purpose
- SR 91 commuters are now using the 91X lanes more than reported after the first year of operation. The proportion of commuters who use the 91X lanes at least some of the time increased from 28.2% in 1996 to 42.0% in 1999. (Section 3.4, Table 3-I.)
- Worsening congestion has motivated some persons to reduce their peak period travel in the corridor. Of 1057 survey subjects, 224 (21%) no longer regularly travel in the SR 91 corridor in peak periods, but did so within the past two years, and have not changed jobs or home location. Of these, 47% said that changing travel conditions influenced their decisions to stop using the corridor. When asked to explain, 86% cited worse traffic, 18% cited driving stress, and 9% cited higher tolls. Females and commuters in the lowest income group were significantly more likely than other groups to have discontinued commuting in the corridor. (Section 3.13.)
- Changes in the peak period trip purpose breakdown indicate that increasing congestion has pushed some discretionary trips out of the peak periods. In 1996, we observed an increase in peak period non-work travel apparently induced by improved travel conditions shortly following the increase in capacity from opening the 91X lanes. In 1999, these non-work trips had decreased, especially in the PM peak. (Section 3.7, Figure 3-28.)
Findings Related to Ridesharing and Employer Trip Reduction Programs - Our previous 1995 and 1996 surveys found that more SR 91 commuters shifted from single occupant vehicles (SOV) to high occupancy vehicles (HOV) than vice versa in the first year after the express lanes opened. Our 1999 surveys indicate that there has been no significant mode shifts since that time. (Section 3.3.)
- HOV commuters are more likely than SOV commuters to choose the 91X lanes. This suggests that the opportunity to split the toll among multiple occupants is a factor in route choice. (Section 3.3, Figure 3-2.)
- 46% of HOV3+ and 26% of HOV2 commuters indicate that they share commuting costs. 34% of HOV3+ groups cite cost-sharing as their principal motivation for ridesharing. Only 19% of the HOV3+ sample rideshare with members of the same household. (Section 3.10, Figure 3-47.)
- Despite the 50% toll discount for HOV3+ commuters on the 91X lanes, the difference in the proportions of HOV2 and HOV3+ groups using the 91 toll lanes is not statistically significant. (Figure 3-2.)
- Work schedule flexibility was found to be unrelated to the level of 91X lane use. This is surprising, since it was expected that schedule flexibility would result in time-of-day shifts to avoid congestion and high tolls. (Section 3.11.)
- The presence of employer rideshare and transit incentive programs was found to be associated with more frequent toll lane use, probably due to those companies having more HOV commuters, who use the toll lanes more than SOV commuters. The ability to
telecommute was found to be related to decreased use of toll facilities. (Section 3.11,
Figure 3-48 and
Figure 3-49.
)
Findings Concerning Travel Times and Perceived Travel Conditions - Trip lengths of SR 91 commuters are long compared to most commute corridors in the U.S. The average one-way trip time for SR 91 commuters has remained constant at about an hour since 1995. There is no evidence that long commutes for SOV and HOV2 commuters encourage greater use of the toll lanes. There is some indication that HOV3+ commuters with long commutes may use the toll lanes more often, however that difference is not statistically significant. (Section 3.8, Figure 3-34.)
- Among toll lane users, the magnitudes of perceived time savings increased between 1996 and 1999. As expected, the perceived PM peak savings exceed the AM peak savings. Although travelers appear to accurately perceive the relative magnitude of their time savings, they typically overestimate their actual absolute time savings, by amounts between 5 and 30 minutes. Not surprisingly, both the likelihood of using the 91X lanes and the frequency of use are related to the perceived travel time savings. (Section 3.9, Figure 3-35 through Figure 3-42.)
- Despite the correlation between travel time savings and the percentage of SR 91 traffic using the toll lanes, some toll lane users choose to use the toll lanes under traffic conditions where the expected value of their time savings is clearly less than the tolls paid. In both 1996 and 1999, driving comfort and the perception of greater safety were identified by travelers as the principal motivations for this behavior. Reliability of travel time was cited a distant third. Also noteworthy is that over 15% of transponder holders do not personally pay for their use. The number of toll lane users who say the 91X lanes are safer than the freeway lanes outnumber by 4:1 those who say the express lanes are
less safe. (Section 3.10, Figure 3-43 and Figure 3-44.)
Findings about Transponder Acquisition and Use
- About half (55%) of all peak period travelers report that they currently own a transponder. Transponder ownership is higher among HOV3+ commuters on SR 91 (72%) and among all modes on ETR (70 - 80% depending on mode). The top three reasons for not having a transponder are: 1) It‘s too expensive, 2) Toll lanes are not on my route, and 3) Wouldn‘t use enough (which may reflect the carrying cost for little used accounts). In 1999, 31% said congestion isn‘t bad enough to get a transponder, while in 1996 just 6% said congestion isn‘t bad enough. (Section 3.12, Figure 3-50.)
- About 10% of transponders in our sample are funded by the travelers' employers. Another 5% are funded by a friend, family member, or someone else, and 3% are paid for by a combination of sources. (Section 3.12.)
- Just 12% of the 618 commuters who own CPTC transponders report that they belong to the Express Club. So while commuters are using the 91X lanes more frequently, few commuters are everyday users. (Section 3.12.)
Findings Related to Income and Other Demographics
- Little has changed since 1996 in the association between income and use of toll facilities. In both 1996 and 1999, the proportions of commuters who chose the 91X lanes increased with income for all modes. The differences are statistically significant among income groups in whether toll or free routes are chosen. One notable change from 1996 to 1999 is the significant decrease in the percentage of trips on toll facilities for the $40-60K income category, from 40% in 1996 to 25% in 1999. This suggests that middle income commuters have been particularly sensitive to the toll increases, and are less willing to pay tolls despite worsening congestion. (Section 3.4, Figure 3-6, Figure 3-8 through Figure 3-13.)
- In general, the proportion of commuters who chose the 91X lanes over the free lanes is higher for females than for males. Only in the HOV3+ category is the proportion higher for males than females. The same trends are apparent when analyzing how frequently commuters report using the 91X lanes (e.g., more females than males are frequent users, except among HOV3+ commuters) and this has been stable over time. However, the only statistically significant differences between the genders are among SOV commuters. (Section 3.5, Figure 3-14 through Figure 3-17.)
- Age is associated with frequency of toll lane use. The youngest and oldest travelers are less likely to be frequent toll lane users than travelers in intermediate age categories. Education level is also directly related to the level of use of the toll facilities. Household type, that is, whether there are children in the home, was found not to be related to the level of toll facility use. (Section 3.6, Figure 3-24 and Figure 3-27.)
3.3 Observations about Express Lane Use and Choice of Mode
This section presents findings concerning the interplay between choice of mode (SOV, HOV2, or HOV3+) and use of the 91X toll lanes, compared to the SR 91 free lanes and the ETR. Where possible, changes between 1996 and 1999 are identified. Except where noted, data describe the trips made on a recent Monday through Thursday prior to the interview, and include only peak period, peak direction trips by private vehicles, excluding motorcycles.
Figure 3-1 shows the mode breakdown reported for the most recent Monday through Thursday trips by 848 respondents in the 1999 Random and New License Plate samples. As discussed in the appendix on survey methodology (Section 3.14), these proportions are believed representative of the actual 1999 weekday peak period commute population. These values differ from the 76%, 20%, and 4% mode shares observed in roadside vehicle occupancy counts in 1999, as reported in Chapter 2. Since the roadside observations were made during the afternoon, 3:30-5:30, they probably underestimate the overall proportion of HOV3+ users, since HOV3+ vehicles is a lower proportion of total traffic in the PM peak when more non-work/school traffic is on the highway.
Figure 3-1
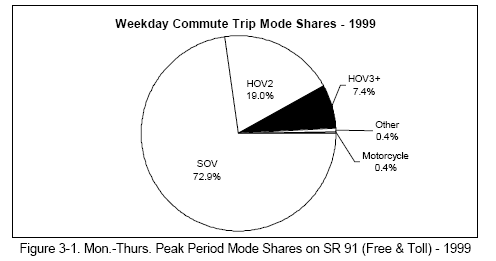
Using data from the panel of commuters who reported their peak period, peak direction trips in both 1996 and 1999, no significant shifts in mode are seen. For this panel group, the estimated share of SOV users decreased from 0.8 to 0.77 between 1996 and 1999. However, the standard deviation of the 1999 proportion is 0.04, thus the difference cannot be regarded as statistically significant, which reflects the small sample size involved (95 respondents).
Among 757 commuters in our Random Dial and New License plate samples who traveled on SR 91 in 1999 and did not use the ETR, the proportions of commuters choosing the express lanes varies significantly among the three modes. Differences are significant at the 1% level based on a Chi-square test (Pr.=0.6%32). As seen in Figure 3-2, both categories of HOV commuters are more likely than SOV commuters to choose the 91X lanes, with differences significant at the 5% level (Pr.=2.7% and 0.8% for HOV2 and HOV3+, respectively). This suggests that the opportunity to split the toll among multiple occupants is a factor in route choice.
Figure 3-2
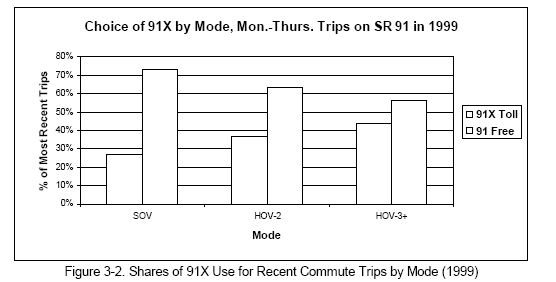
Although the visual evidence in Figure 3-2 suggests that HOV3+ commuters on SR 91 are more likely than HOV2 commuters to use the 91X toll lanes, the difference, based on a fairly small sample of 202 respondents, does not test as significant (Pr.=33%). This is despite the 50% toll discount enjoyed by HOV3+ commuters. The comparison is interesting in combination with the finding in Chapter 2 (Figure 2-16 and Figure 2-17) where it was shown that the number of HOV3+ commuters in the 91X lanes dropped significantly after the 50% discounted toll was implemented in place of the previous zero-toll policy.
The corresponding data for 512 trips observed in 1996 appear in Figure 3-3. The much higher use of the 91X lanes by the HOV3+ group that year (80% of trips) is apparent, and the decrease to 44% in 1999 is highly significant (Pr.=0%). For commuters using SR 91, the differences between 1996 and 1999 in the proportions of the SOV and HOV2 groups using the 91X lanes are not significantly different (Pr.=40% and 58% for SOV and HOV2, respectively). The only significant change is for the HOV3+ group which, as noted in Chapter 2, is probably due to HOV3+ commuters now paying 50% of the posted toll, instead of traveling free as in 1996.
Figure 3-3
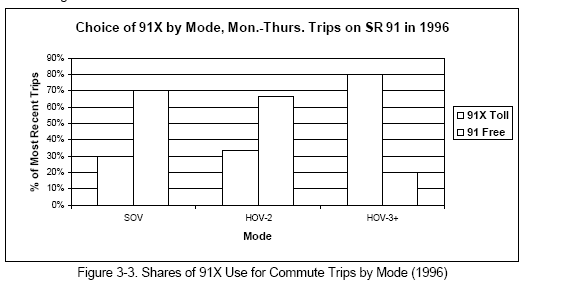
The difference in the use of the 91X lanes between the SOV and HOV2 groups in 1996 appears similar to the difference in 1999, however it is not statistically significant at the 5% level (Pr.=49%).
We observed the same changes between 1996 and 1999 for the 95 members of the Panel sample who report trips in both survey years. In this case, for the Panel group, shown in Figure 3-4, the comparison considers either toll facility (91X or ETR), as distinct from using a non-toll facility. The use of toll lanes dropped significantly for HOV3+ commuters (Pr.=0.6%), but not for SOV and HOV2 (Pr.=70%+ for both groups).33
Figure 3-4
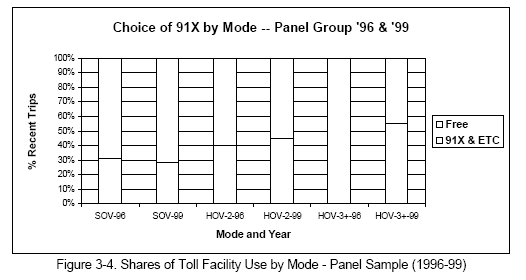
3.4 Observations about Express Lane Use and Income
The SR 91 serves a generally affluent population. As seen in Figure 3-5, over half the peak period highway users who provided income data in 1999 reported annual household incomes over $60,000 per year. (83% of survey respondents provided income data.)
Figure 3-5
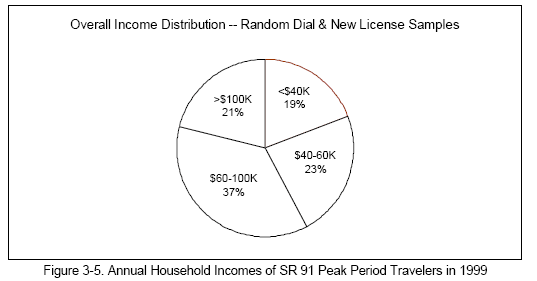
Little has changed in the association between income and use of toll facilities. In both 1996 and 1999, although persons at all income levels use the toll facilities, the proportions of commuters who chose the 91X lanes increase with income for all modes.
Figure 3-6 shows the relationship between income and the split between the ETR, 91X and SR 91 free lanes for 698 recent Monday-Thursday trips observed in the 1999 Random Dial and New License Plate samples. The use of toll facilities (ETR+91X) ranges from 21% for the lowest income group to 51% for the highest. The differences among income groups are statistically significant at the 1% level (Pr.=0%).
Figure 3-6
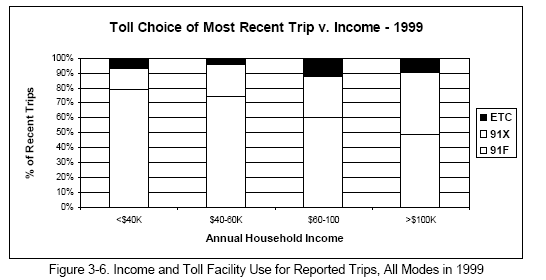
The relationship for 1999 shown in Figure 3-6 is independent of mode. The same relationship exists when SOV and HOV trips are considered separately. For SOV and HOV commuters, the relationships between income and use of the toll facilities are similar to Figure 3-6 and not significantly different from each other at the 5% level (Pr.=10%).
Figure 3-7
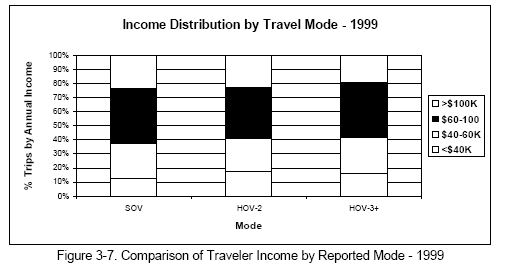
This is consistent with findings from an analysis of 633 recent trips in the 1999 Random Dial and New License samples which show there is little difference in the income distributions of persons reporting different modes for recent Monday through Thursday trips. This is shown in Figure 3-7. Although there appears to be a small tendency toward lower incomes in the HOV groups, the income distributions are not significantly different among the modes at the 5% level (Pr.=9.3%).
The relationship for 1996 between income and toll lane use appears in Figure 3-8. The overall pattern is similar to 1999 and supports the conclusion that the income relationship has been mostly stable over time. The percentages of trips on toll facilities for the lowest and highest income categories (20% and 50%) are virtually identical in 1996 and 1999, however the percentages for the two middle income categories decreased. The decrease for the $40-60K income category, from 40% to 25%, is statistically significant at the 1% level (Pr. 0.4% for a one-tailed comparison), however the decrease for the $60-80K category, from 43% to 39%, is not significant at the 5% level (Pr.=21%). As in 1999, the same relationships are seen when SOV and HOV trips are considered separately; and the relationships for the different modes in 1996 are not significantly different from each other at the 5% level (Pr.=19%).
Although the overall income relationship is mostly stable, the significant decline in reported toll lane use by commuters in the $40-60K category suggests that these middle income commuters have been unusually sensitive to the toll increases, and are less willing to pay tolls despite the worsening traffic congestion in the corridor. The impact on this income group is similar for both the SOV and HOV commute groups.
Figure 3-8
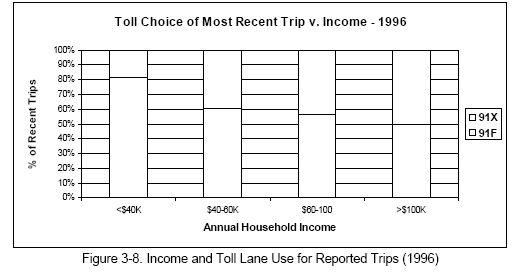
Another way to explore the relationship between route choice and income is to analyze how frequently commuters use the express lanes. For this purpose, commuters are divided into three groups: frequent 91X users, infrequent 91X users, and non-users. Frequent Users are commuters who choose the 91X for at least half of their peak trips. Infrequent Users are commuters who use the 91X lanes, but for less than half their peak trips. Non-Users are commuters who don‘t use the 91X lanes.
Table 3-I summarizes the reported frequency of 91X lane use for our 1996 sample and for our 1999 Random Dial and New License samples. The clear trend over time is toward increasing numbers of commuters identifying themselves as 91X users, differences which are statistically significant at the 1% level (Pr.=0%).
Table 3-I. Increase in 91X Use by Commuters -- 1996 to 1999
| 1996 | 1999 | |
|---|---|---|
| Freq. 91X Users | 21.7% | 27.5% |
| Infreq. 91X Users | 6.5% | 14.5% |
| Non-Users | 71.8% | 58.0% |
| Sample Size | 1000 | 1375 |
Figure 3-9
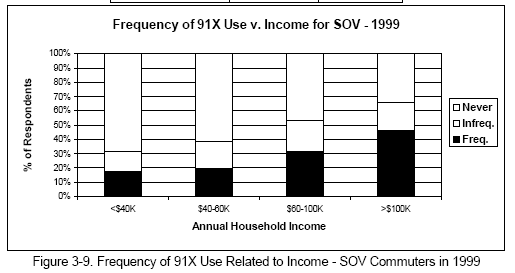
As shown in Figure 3-9 and Figure 3-10, the proportion of commuters in 1999 who say they are frequent users increases steadily with income for both the SOV and HOV groups.34 These results are based on 842 respondents in 1999 who provided both income and mode data for a recent trip. The differences are statistically significant at the 1% level for SOV (Pr.=0%) and the 5% level for HOV (Pr.=2%). In this case, HOV2 and HOV3+ commuters are combined because of small sample sizes and because previous analysis showed that the two HOV groups were not significantly different in their use of the 91X lanes in 1999. As seen before in Figure 3-2, HOV commuters are more likely than SOV commuters to be frequent 91X lane users across income categories. The differences between SOV and HOV are all significant at least at the 5% level except for the lowest <$40K income group where the small apparent differences in both frequent and infrequent use are not significant at the 5% level. This finding is counter-intuitive, since one would expect that the lowest income group to have a greater incentive to rideshare in order to split the cost of tolls.
Figure 3-10
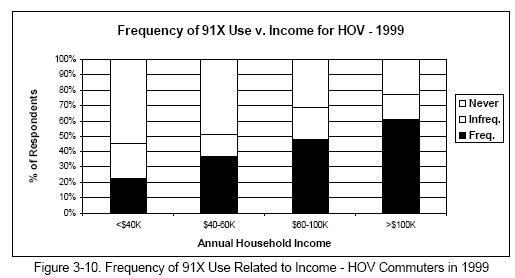
The corresponding relationships for 1996 are shown in Figure 3-11 through Figure 3-13. Here, HOV2 and HOV3+ are shown separately since their use of the 91X lanes was different in 1996, at the time when HOV3+ commuters paid zero toll.
Figure 3-11
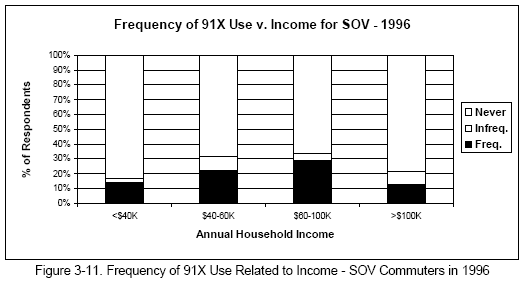
Comparing the income relationship for SOV commuters in 1996 and 1999 (Figure 3-9), the proportions of frequent users are not significantly different, at the 5% level, up to $100K. Above $100K, the percentage of frequent SOV 91X lane users in 1999 (46%) far exceeds 1996 (13%, or 9 of 69 respondent), the latter coincidentally equal to the value for the lowest income group. Given the positive relationship between income and use frequency seen elsewhere in the data, this is viewed as an anomaly. The percentages of SOV commuters identified as infrequent 91X users in 1999 are consistently larger than in 1996 for all income groups, by differences which are significant at least at the 5% level.
Figure 3-12
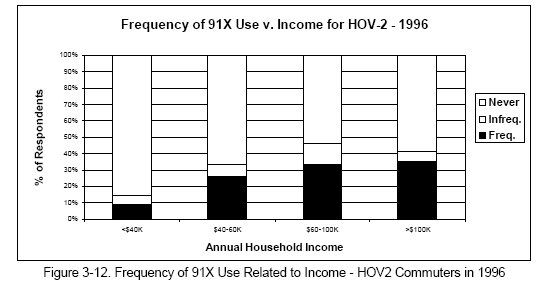
With the exception of the SOV, over $100K group, the income v. frequency relationship for HOV2 commuters in 1996 is similar to the 1996 SOV commuters. In both cases, the relationship is less sensitive to increasing income, compared to 1999. On the other hand, although the groupings are not directly comparable (since the 1996 HOV relationship includes HOV3+), it is evident that in 1999 there is more use of the 91X lanes by SOV and HOV2 commuters in the lowest income group than in 1996.
Finally, Figure 3-13 shows very high frequency of use for HOV3+ commuters in 1996, as noted previously. Except for the <$40K income group, no increasing relationship with income is evident, reflecting the fact in 1996 HOV3+ commuters could use the 91X lanes toll-free (although transponders were necessary). It is interesting that the percentage (about 60%) of frequent users in 1999 for the HOV >$100K income group (Figure 3-10) is essentially equal to the HOV3+ >$100K group in 1996, when no tolls were paid.
Figure 3-13
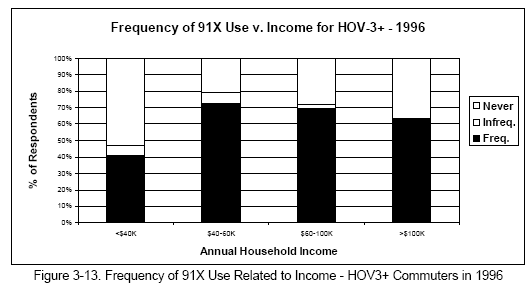
3.5 Observations about Express Lane Use and Gender
65% of commuters in the SR 91 corridor are male and 35% female, a ratio which has remained the same since 1996. In most cases, the proportion of female commuters who chose the express lanes over the free lanes is generally higher than for males. This difference in behavior also has largely remained stable since 1996. Only in the HOV3+ mode category is the proportion of male commuters who chose the express lanes higher than for females.
Figure 3-14
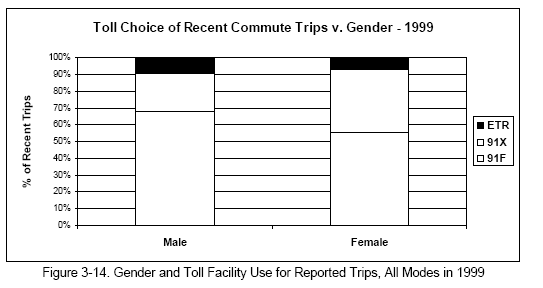
This relationship neglects mode. When mode is considered, shown in Figure 3-15 through Figure 3-17, we find that the preference for toll facilities only clearly applies to women driving alone.
Figure 3-15
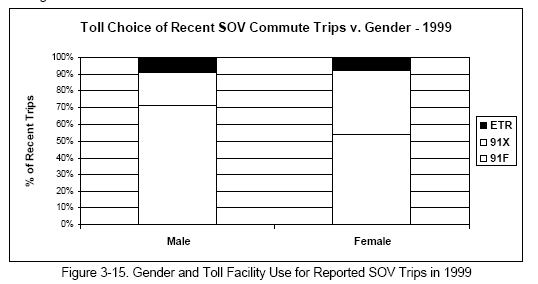
Figure 3-16
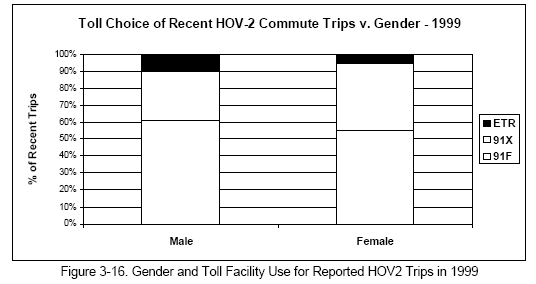
The difference between males and females is significant for the SOV mode shown in Figure 3-15, however no significant difference appears in the HOV2 comparison (Pr.=27%) and the comparison for HOV3+ commuters actually show more use of the toll facilities by men, however that difference in Figure 3-17 is not significant at the 5% level (Pr.=19%), due to the small sample size (63).
Figure 3-17
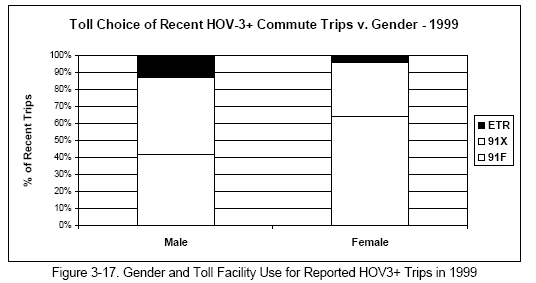
Figure 3-18
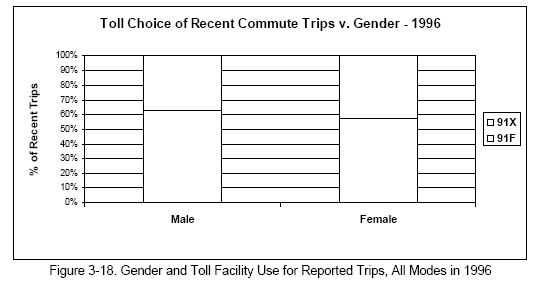
The corresponding comparison for all modes based on 512 subjects in our 1996 sample, shown in Figure 3-18, is very similar in appearance to the 1999 comparison shown in Figure 3-14. However, in this case the difference is not quite as distinct and the sample size is smaller (512), so the difference turns out to be not statistically significant at the 5% level (Pr.=23%). 1996 comparisons by mode also look very similar to the 1999 data in Figure 3-15 through Figure 3-17, although none of the comparisons are statistically significant for the same reason.
We conclude that there are gender differences but only in the case of SOV commuters, with women more likely to use the toll facilities than men, and these differences have remained essentially unchanged over the observation period.
We can also explore the relationship between route choice and gender by analyzing how frequently commuters report using the express lanes. As before, commuters are divided into three groups: frequent 91X users, infrequent 91X users, and non-users. Frequent Users choose the 91X for at least half of their peak trips. Infrequent Users use the 91X lanes but for less than half their peak trips. Non-Users are commuters who don‘t use the 91X lanes.
The reported use frequency data reflect the results of the trip data analysis quite closely. Figure 3-19 and Figure 3-20 show the relationships for 1999 (N=842) and 1996 (N=760). In both cases, women are significantly more likely than men, at the 1% level in 1999 (Pr.=0%) and the 5% level in 1996 (Pr.=4%) to be frequent users of the 91X lanes. When differences by mode of trip are examined, the relationships are as before. The differences are significant for women who commute alone. HOV differences are not significant, however for the HOV3+ group, men consistently report being frequent 91X lane users more than women.
Figure 3-19
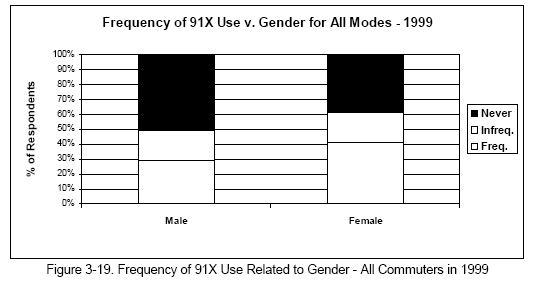
Figure 3-20
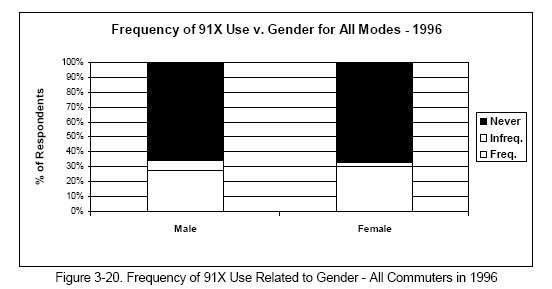
3.6 Observations about Express Lane Use, Age, Education & Household Type
As seen in Figure 3-21, over half the commuters who participated in our surveys are in their 30's and 40's, with the others fairly evenly distributed among other age groups. 55% of commuters in the corridor reported that they live in a household with children. Figure 3-22 shows the breakdown of the commuter population by education level.
Figure 3-21
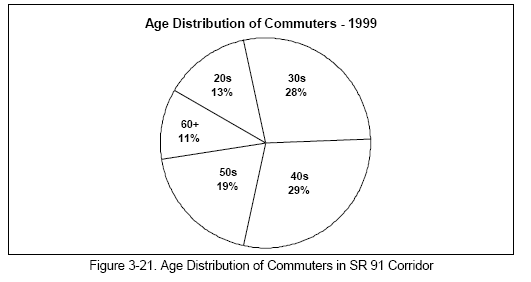
Figure 3-22
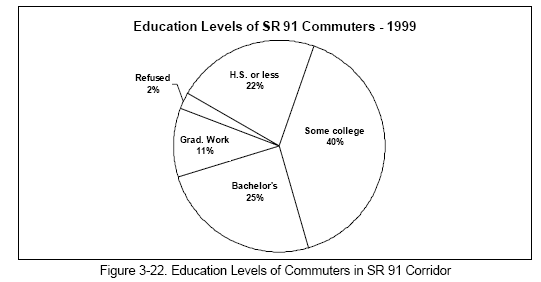
This section explores the possible relationships between these various demographic variables and express lane use. Only univariate relationships are considered here. Chapter 5 further examines the influence of these variables through the calibration of multivariate demand models.
The presence of children at home has been suggested as a possible influence on express lane use, on the basis that child care requirements might increase the motivation for a faster and more reliable commute. This relationship was studied in detail, with mixed results. The influence on toll facility use of children at home was examined in both 1996 and 1999, for each mode group, and separately for female commuters. The majority of differences observed were not significant at the 5% level and the few that were significant tended to be contradictory. We conclude that the presence of children at home is not a factor that influences the use of the 91X lanes.
The possible relationship between age and use of the toll facilities was examined. In 1996 and 1999, toll facility use appears to increase with age up to the 50-60 age range, and then decline. However, in both 1996 and 1999, the age relationship is weak and differences in toll facility use among age groups are not statistically significant at the 5% level in either year (Pr.=50% and 11% in 1999 and 1996, respectively). The relationship for 810 recent Monday-Thursday trips observed in the 1999 Random Dial and New License Plate samples appears in Figure 3-23. The relationship for 1996 is very similar. In addition, the same pattern emerges if when trips are stratified by mode. The consistent tendency for commuters in their 20s to use the toll facilities less than older commuters probably reflects the fact that their incomes are significantly lower.
Figure 3-23
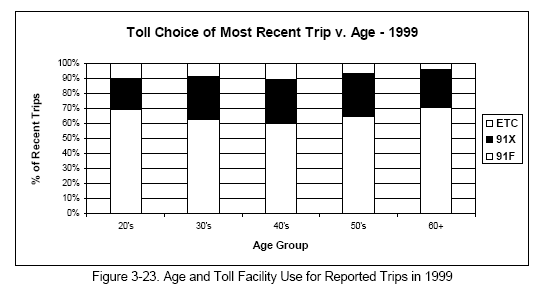
The same basic relationship appears for commuters identified as frequent 91X users (more than 50% of commute trips on the toll lanes). Figure 3-24 and Figure 3-25 show these relationships for 1999 (N=821) and 1996 (N=754), respectively. In this case, the 1996 age distributions are significantly different at the 1% level (Pr.=0%), with the youngest and oldest age groups much less likely to be frequent 91X lane users, compared to 1999 where the apparent differences among the age groups are not significantly different (Pr.=43%).
Figure 3-24
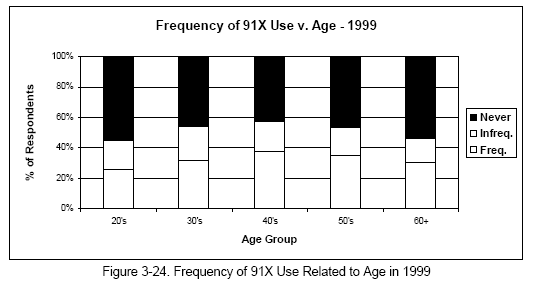
Figure 3-25
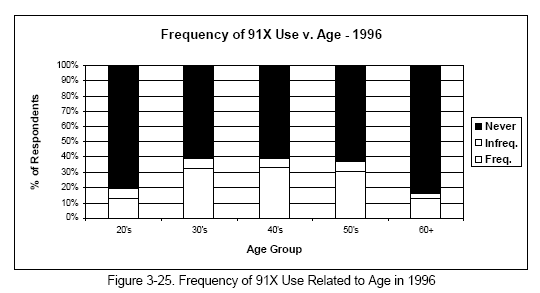
The possible relationship between education level and use of the toll facilities was examined. Figure 3-26 shows the relationship for 810 recent Monday-Thursday trips observed in the 1999 Random Dial and New License Plate samples. The apparent relationship between increased use of toll facilities and higher education level is significant at the 5% level (Pr.=3.0%).
Figure 3-26
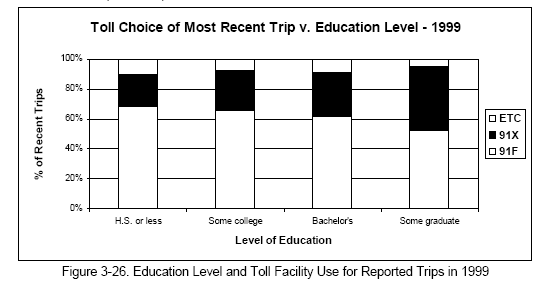
The same relationship appears for commuters identified as frequent 91X users (more than 50% of commute trips on the toll lanes). Figure 3-27 shows the relationships for 1999 (N=821). The differences among education levels are statistically significant at the 1% level (Pr.=0%).
Figure 3-27
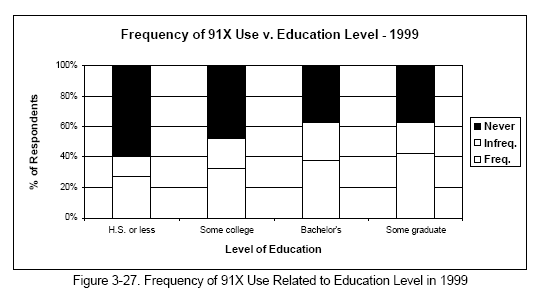
3.7 Observations about Express Lane Use and Trip Purpose
In our previous report, it was observed that opening the 91X lanes in December 1995, and the corresponding congestion relief, was accompanied by a significant increase in peak period trips for purposes other than commuting to work. The purpose of this section is to see whether the peak period trip purposes have changed in the subsequent three years, and to explore other possible differences associated with trip purpose, such as the choice of mode, differences by gender, and the decision to use or not use the toll facilities.
Figure 3-28
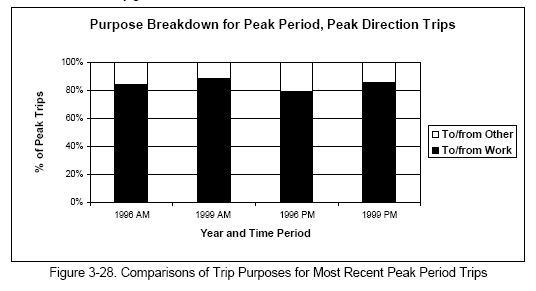
Figure 3-28 shows the comparison for AM and PM of the proportions of peak period, peak direction trips for commute-related purposes (between home and work or home and school) relative to other trip purposes (shopping, recreation, personal business, job-related travel,..) The proportions of non-commute purposes decreased from 1996 to 1999 in both the AM and PM, with changes significant at the 5% level (Pr.=2.5% for AM, Pr.=3.8% for PM). This may reflect increasing congestion in 1999 which discouraged some discretionary trips from traveling in the corridor during the peaks.
During the afternoon peak, women are more likely to be traveling for non-commute purposes than men. Figure 3-29 shows this comparison and the trend from 1996 to 1999 toward fewer discretionary peak period trips for both genders. Figure 3-30 shows the corresponding AM peak, where the significant gender difference in trip purposes does not occur.
Figure 3-29
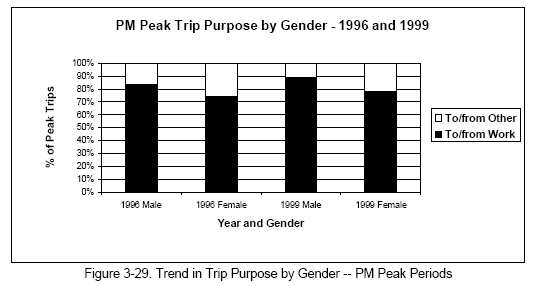
Finally, it might be expected that toll facilities would be used differently for trips having different purposes. Figure 3-31 shows this comparison. Indeed, in 1996, the proportion of commute purpose trips (between home and work and home and school) is higher in the toll lanes than the free lanes, by an amount significant at the 1% level (Pr.=0.1%). However, in 1999, the difference is small and not significant at the 5% level (Pr.=15%). By 1999, the proportion of commute trips in both the free and toll lanes had become equal to that of the toll lanes in 1996, again suggesting that trips for discretionary purposes in the corridor had moved away from the increasingly congested peaks.
Figure 3-30
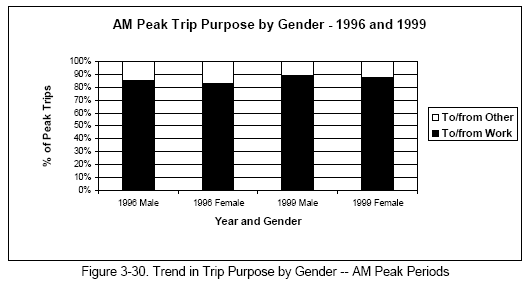
Figure 3-31
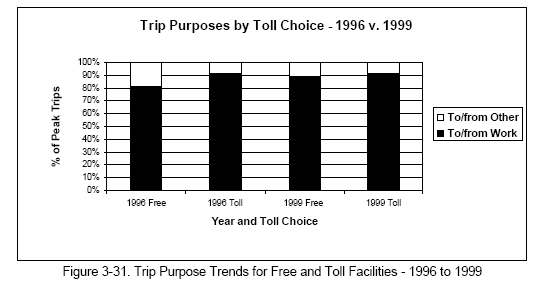
3.8 Observations about Express Lane Use and Trip Length
Commuters in the SR 91 corridor commute long distances. The average one-way travel time for peak travelers has remained approximately one hour since 1995, and there is no evidence that the average has increased.
Although it is believed that ridesharing generally increases with trip lengths, data for 817 commuters from our 1999 Random Dial and License Plate samples indicates otherwise, in the case of SR 91 peak period, peak direction travelers. The travel time distributions for HOV groups in Figure 3-32 show that most rideshare commutes are in the 30-40 minute range, while SOV commutes show much more variation, with half the trips in excess of 50 minutes. This difference appears due to rideshare groups having access to the extensive regional system of HOV lanes. In particular, while the modal travel time distributions in Figure 3-32 are significantly different at the 1% level (Pr.=0%), the corresponding travel distance distributions shown in Figure 3-33 are not significantly different at the 5% level (Pr.=6.4%). Both distributions were obtained by calculating shortest paths through the regional network between respondents' reported origin and destination locations, assuming that rideshare groups would use available HOV lanes when faster.
Figure 3-32
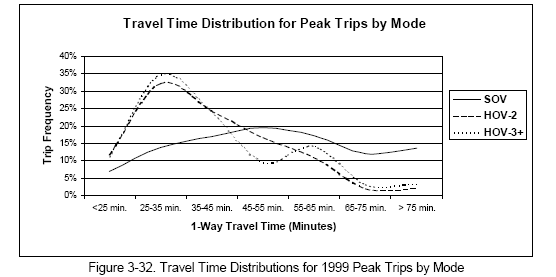
Figure 3-33
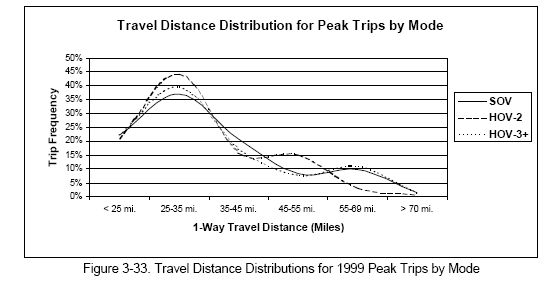
It has been suggested that longer trips might make more use of toll facilities, because the toll as a share of total trip cost decreases as trip lengths increase. However, previously published data from 1996 reveals only a weak relationship, with percent toll lane use apparently increasing for trips up to 60-90 min., especially for HOV commuters, but decreasing with even longer trip lengths. (Note: in 1996, trip times were estimated by the commuters themselves, not based on network times.) A similar pattern exists in 1999, as shown in Figure 3-34. There is no evidence that long commutes for SOV and HOV2 commuters encourage greater use of the toll lanes, however there is an apparent increase with trip length in the proportion of HOV3+ users. However, the difference between the proportions of HOV3+ 91X lane users for <35 min. compared to >45 min. commutes is not statistically significant at the 5% level, due to the limited sample size (the HOV3+ distribution is based on only 55 trips). Also, very long commutes are excluded from this graph because of the small samples involved. We conclude that trip length is not a significant influence on toll lanes use, despite some weak evidence that such a relationship might exist.
Figure 3-34
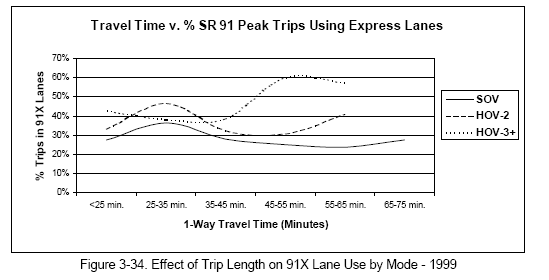
3.9 Observations about Express Lane Use and Travel Time Saved
Our previous report of May 1998 presented data indicating that, in 1996, commuters gave estimates of peak time savings for 91X lane users substantially greater than our independent estimates, which are based on loop speeds at the time. Figure 3-35 shows that relationship using data obtained from 122 respondents in spring 1997.
Figure 3-35
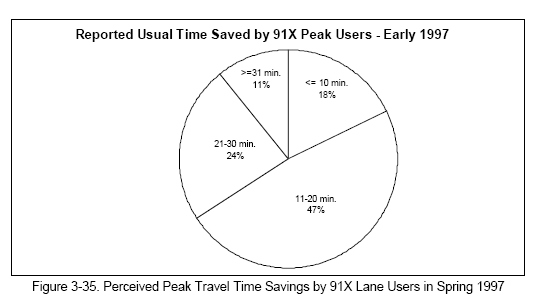
Figure 3-36 and Figure 3-37 show the corresponding data from a subset of 403 randomly selected respondents to our 1999 surveys, including persons who use the 91X lanes at least occasionally. Respondents were asked to estimate their "typical" time savings for the AM and PM peak periods separately. Although not directly comparable to Figure 3-35, which combines the two peaks, it is clear that the magnitudes of the perceived savings have increased between 1996 and 1999, and that, as expected, the perceived PM peak savings exceed the AM peak savings.
Figure 3-36
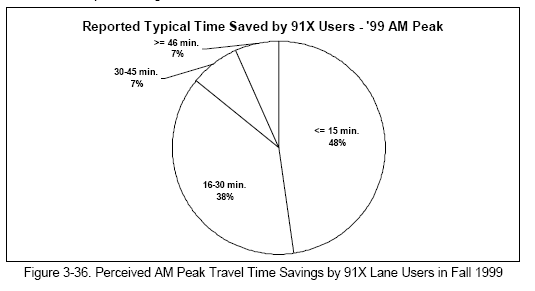
Figure 3-37
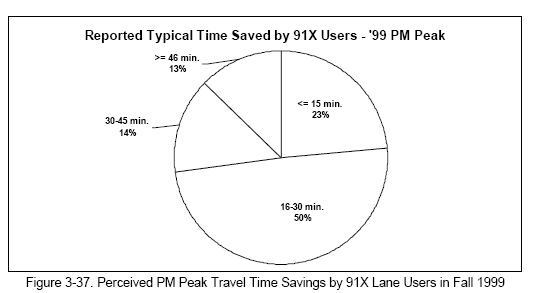
If we compare the perceptions in Figure 3-36 and Figure 3-37 to our best independent estimates of actual average time savings, based on loops and floating car observations, we find, as in 1997, that although travelers appear to accurately perceive the relative magnitude of their time savings, as shown in Figure 2-35 through Figure 2-37, they commonly overestimate their actual absolute time savings. Figure 3-38 and Figure 3-39 show the distributions of the overestimation of time saved for persons sampled for this question and who reported trips in the AM and PM peaks, respectively (from which the "actual" times were estimated). The AM and PM distributions are fairly similar except that among AM commuters a substantial minority underestimated their time saved, which happened rarely in the case of the PM commuters questioned. Overall, overestimation of time saved tends to be evenly distributed between 5 and 30 minutes, with values less than and greater than this range falling off rapidly.
One would expect that the likelihood of using the 91X lanes, as well as the frequency of their use would be correlated to the perceived travel time savings. This turns out to be the case. To the extent that the perceptions of time savings are systematically overestimated, it suggests that making available accurate data on actual toll lane time savings might result in reduced toll lane use.
Figure 3-38
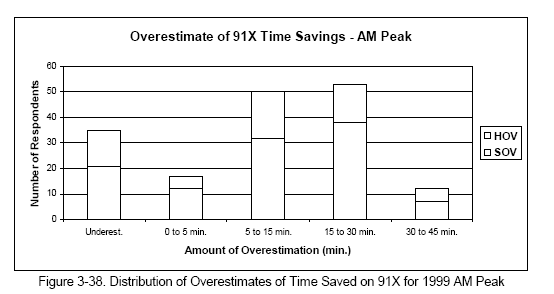
Figure 3-39
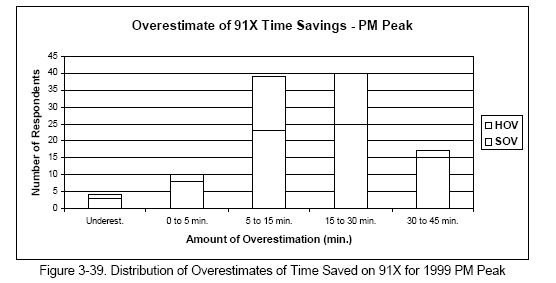
Figure 3-40 and Figure 3-41 show the relationship between the time people perceive they save by taking the 91X toll lanes and the percentage of recent peak period trips on SR 91 which reported using the 91X toll lanes. The apparent differences among the time savings categories are statistically significant at the 1% level (Pr.=0.7% and 0.2% for the AM and PM peaks, respectively, with sample sizes of 265 and 271). Although the correlation may appear stronger for the AM peak, this is not the case since AM peak commuters generally perceive less time saving than PM commuters. The relationship and statistical significance is approximately the same if users of the ETR are included in the dependent variable; that is, perceived time savings on the 91X lanes are a good predictor of likelihood of using both the 91X and the ETR.
Figure 3-40
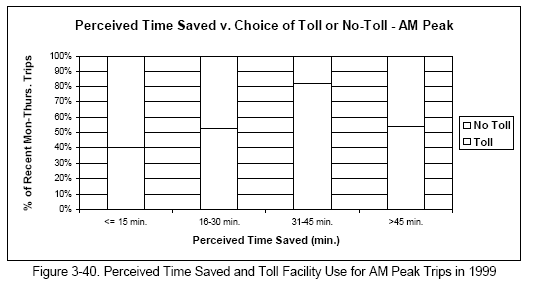
Figure 3-41
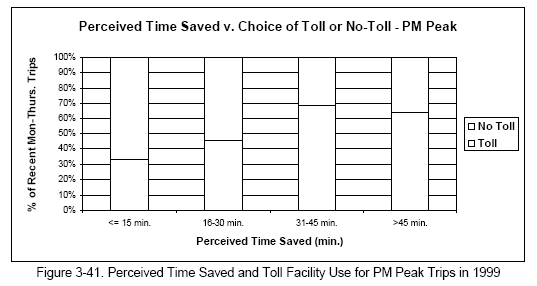
As would be expected, the reported frequency of use of the 91X lanes is also positively related to the perceived time savings for typical trips. Figure 3-42 shows that relationship for 404 respondents who reported PM peak trips. The differences across the categories of perceived time savings are different at the 5% level (Pr.=1.1%).
Figure 3-42
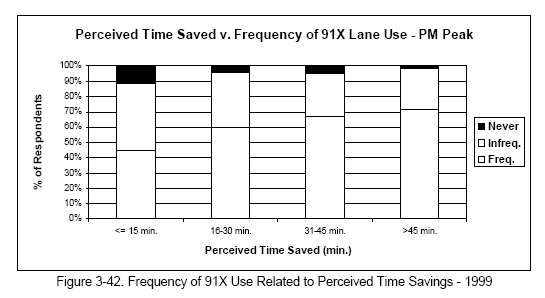
3.10 Observations on Perceived Safety, Cost-Sharing, and Additional Reasons for Using the Express Lanes
Although saving travel time is obviously the main motivation to use the toll facilities, past evidence suggests that people perceive and value other benefits obtained from using these facilities. This would explain why the 91X (and ETR) consistently attract patrons outside of peak periods. Included with the other motivations explored in this section are the patterns of cost-sharing among rideshare groups and their effect on toll lane use, as well as the possible influence of employer trip reduction programs and telecommuting.
A random subset of survey respondents in 1999 were asked if there were reasons besides saving time for deciding to use the 91X toll lanes. Of 425 respondents in all mode categories who responded to this question, 34% replied that they did have additional reasons. These reasons are shown in Figure 3-43. 35 The findings are similar to results from similar questions asked in our 1996 survey. Easier driving and perceived safety appear to be the major motivations, with reliability of travel time a rather distant third.
The issue of perceived safety was explored in more depth. A sub-sample of 408 91X lane users were asked to compare the safety of using the 91X lanes compared to the regular freeway lanes. The responses appear in Figure 3-44. Although some users think otherwise, a strong majority apparently feel safer riding in the 91X lanes. These opinions were not significantly different across the three mode categories (Pr.=51%).
Figure 3-43
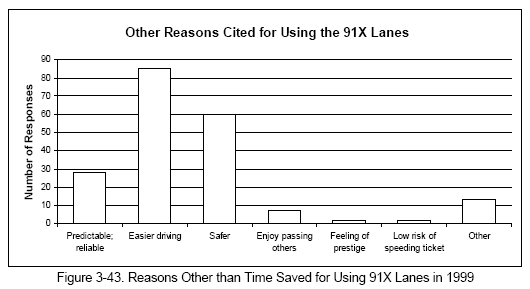
Figure 3-44
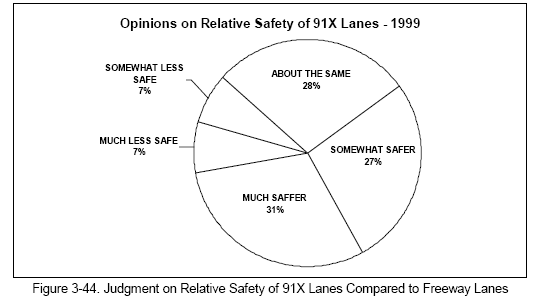
The reasons given by 228 respondents who feel the 91X lanes are safer are summarized in Figure 3-45. The principal reasons given by 56 respondents who feel the 91X are less safe appear in Figure 3-46. Some of the reasons in the two charts mirror each other, but the fundamental distinction is that the number of people who think the 91X lanes are safer outnumber 4:1 those who think the lanes are less safe.
Figure 3-45
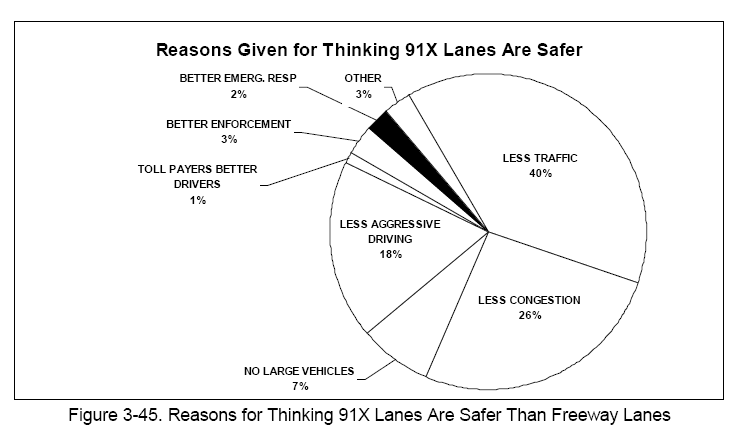
Figure 3-46
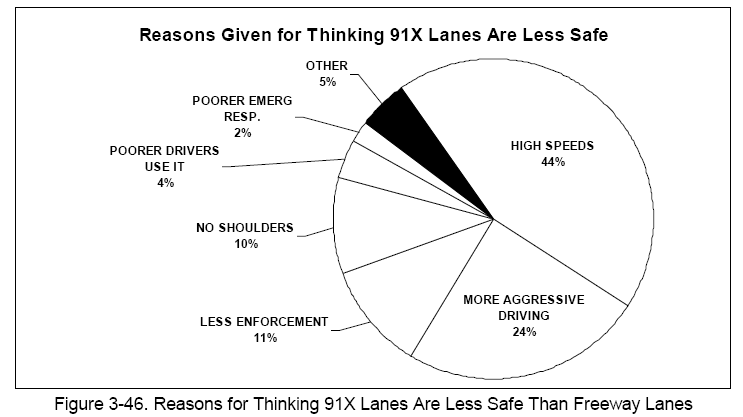
Among 216 rideshare groups who responded to our 1999 survey, the opportunity for cost- sharing appears to be a surprisingly minor consideration. As shown in Figure 3-47, respondents gave a variety of answers when asked their primary reasons for carpooling or vanpooling. Over a third of the sample carpool with members of the same household. Being able to save time by using HOV lanes is cited by about a quarter of the sample, and a sixth of the sample cite cost-sharing.
Figure 3-47
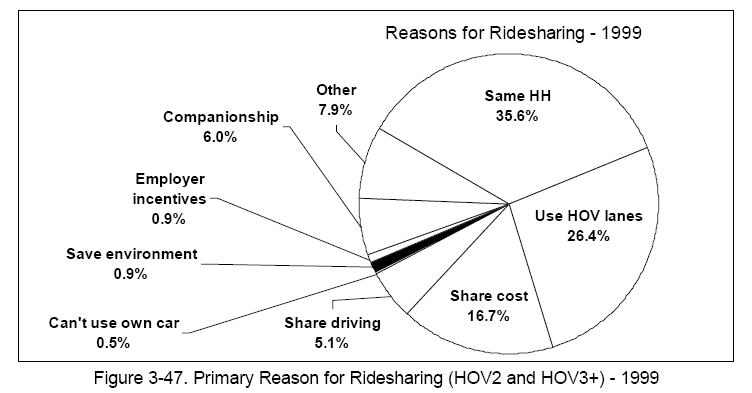
A surprisingly high 69% of the commuters who rideshare indicate that they do not cost-share, while 31% say they do, although that is not necessarily their principal motivation. However, a much higher percentage of HOV3+ groups (46%) cost-share than HOV2 groups (26%), a difference which is significant at the 5% level (Pr.=1.7%). Among the 62 HOV3+ groups responding to this question, 34% cite sharing cost as their principal motivation for ridesharing, and only 19% of HOV3+ rideshare with members of the same household. Other motivations of the HOV3+ sub-sample parallel the entire sample of rideshare groups shown in Figure 3-47.
We found no significant gender differences related to motivations for ridesharing.
Additional investigations were made to see if there appeared to be any systematic differences in toll lane use by the 63 rideshare groups who said they share trip costs compared to the 139 rideshare groups who do not. Although the sample size is limited, no significant differences appear to exist between the two groups, either in their likelihood of using toll facilities for recently reported trips or in their reported frequency of toll lane use (Pr=64% and 52%, respectively).
An interesting apparent difference in the data was that rideshare groups from the same households and those who cite "share driving" as their principal motivation for ridesharing seemed less likely to be toll facility users. Although this difference proved not to be significant at the 5% level (Pr.=11%), we believe that it might prove significant if a larger sample size were available.
3.11 Observations on Employer Trip Reduction Programs, Work Schedules, and Telecommuting
It has been suggested that employer trip reduction programs and telecommuting, through their influence on ridesharing and schedule flexibility, might be related to the use of toll facilities. Of a total of 1097 respondents in our 1999 Random and New License samples, 297 (27%) work for employers with some kind of ridesharing or transit incentive program, and 219 (20%) say their employers permit them to work at home, which we will call "telecommuting." In addition, 43% have some flexibility in the time of day they must arrive at work, while 59% have some flexibility in the time of day they can depart.
A comparison of the trip characteristics of commuters whose employers have rideshare or transit incentive programs reveals that those with such programs use the toll facilities more frequently. The differences, illustrated in Figure 3-48, are significant at the 5% level (Pr.=2.3%). This effect may reflect the correlation between rideshare programs and HOV3+ use, and the fact that HOV commuters are more likely than SOV commuters to be toll lane users (see Figure 3-2). In our sample, among commuters whose employers have rideshare programs, 13% are HOV3+ commuters while 68% are SOV, compared to commuters whose employers have no rideshare programs where 5% and 76% are HOV3+ and SOV commuters, respectively. Interestingly, the HOV2 share in our sample seems unrelated to the presence of employer rideshare programs, equal to 18% of commuters in both cases.
Figure 3-48
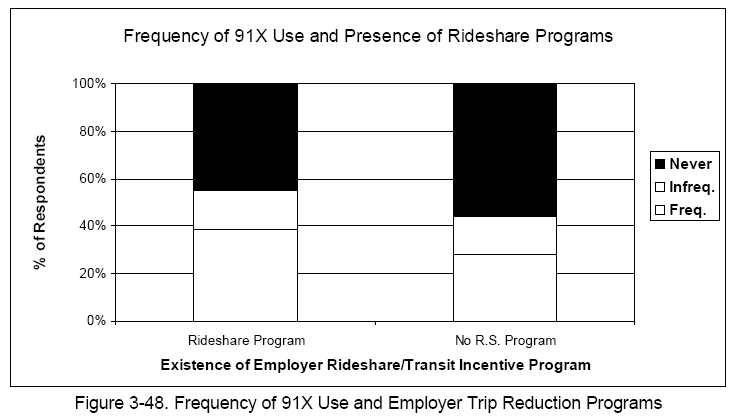
Schedule flexibility for arrival and departure from work was investigated for a possible relationship to toll lanes use, but no link was found either in the likelihood of using toll facilities on recent trips or to the frequency of 91X lane use. This is surprising, since it was expected that schedule flexibility would permit travelers to shift their time of travel to avoid the worst congestion and therefore have less need to pay the toll. Curiously, of survey respondents with schedule flexibility, 33% of AM commuters and only 20% of PM commuters cite congestion avoidance as a factor in deciding when to travel. As expected, schedule flexibility does appear to influence choice of mode, with 22% of commuters with schedule flexibility in our sample using HOVs while 33% of those without flexibility used HOVs. However, probably because of small sample size, this difference is not significant at the 5% level.
The ability to telecommute appears to be associated with decreased toll facility use, as seen in Figure 3-49. This difference in toll lane use between persons whose jobs permit them to work at home is statistically significant at the 5% level (Pr.=2.2%). As might be expected, the ability to telecommute is also negatively related to ridesharing. Among commuters who can work at home, 83% used SOVs and 17% used HOVs; while of those who cannot work at home, 71% used SOVs and 28% used HOVs for recently reported trips. This difference in mode is significant at the 5% level (Pr.=4.4%), and is evenly distributed between the HOV2 and HOV3+ subgroups.
Figure 3-49
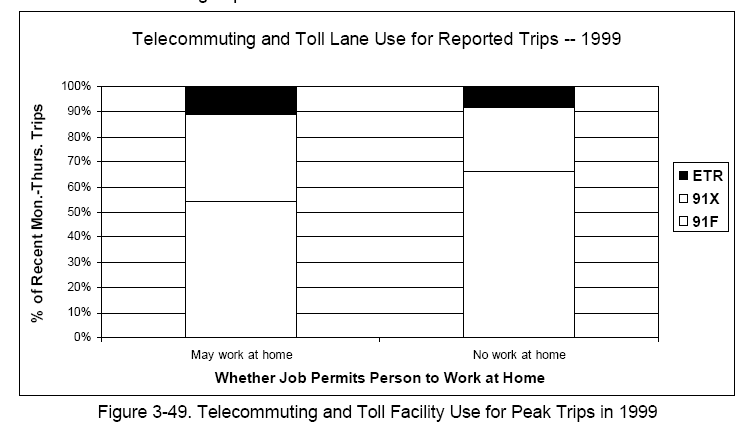
3.12 Observations about Transponder Ownership and Use
52% of the 1438 persons in our Random, New License Plate, and 1996 Repeat samples reported that they currently have a Fastrak transponder. 84% of the 745 transponders were issued by CPTC, the 91X operator, and 15% were issued by other the other Orange County toll authorities. Only 2 persons in our sample had transponders issued by the San Diego I15 agency.
Of 618 holders of transponders issued by CPTC, only 12% (76 people) reported that they belong to the Express Club, which for $15/month provides a $0.75 discount on every toll, making some off-peak travel free. Two others said they once belonged, but no longer do. This low participation rate is further evidence that most commuters are not everyday users of the toll roads, since 20+ one-way trips per month justifies the cost of "Club" enrollment.
Interestingly, about 10% of transponders in our sample are funded by the travelers' employers. Another 5% are funded by a friend, family member, or someone else, and 3% are paid for by a combination of sources. 82% are funded by the traveler alone. Of travelers who split the cost of the transponder, about a third say they pay for 20% or less of the tolls, and about half pay 20% to 50% of the tolls. An interesting difference, although based on very small numbers of samples, is that persons who share costs with their employer pay on average about 20% of toll costs (N=4), while persons who share costs with family or friends typically pay 50% of the costs (N=12).
Figure 3-50 shows the breakdown of 789 reasons given by respondents for not having a transponder in 1999, compared to 281 corresponding reasons given in our 1996 survey.
Although the categories are not 100% the same, some interesting contrasts emerge. In 1999, comparatively few people claim congestion isn't bad enough to consider paying tolls, and the high perceived cost of paying tolls or having a transponder becomes the dominant reason. The "Other" category in 1999 is dominated by the answer "Wouldn't use enough," a reason not seen in the 1996 data. Although not specifically stated, the "Wouldn't use enough" answers may be related to the monthly carrying charge for infrequently used transponders which CPTC enacted subsequent to our 1996 survey. The proportion of people citing disapproval fell between 1996 and 1999, as did the proportion of respondents saying the toll facilities are not convenient for their trips.
Figure 3-50
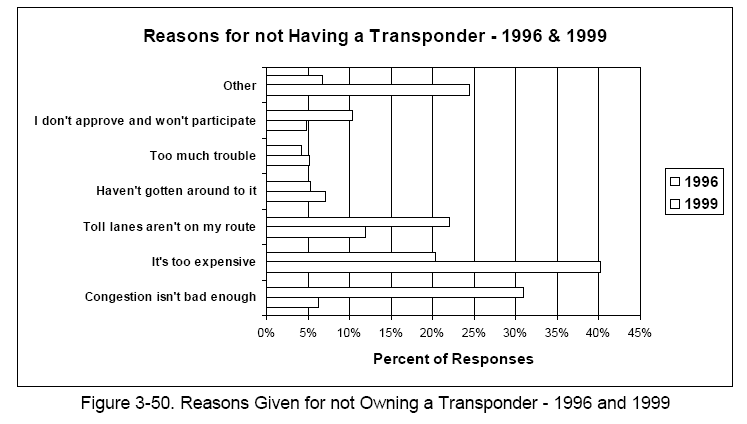
We investigated the demographic characteristics of transponder-holders and non-holders and, as expected, found many parallels with the relationships between demographics and toll lane use.
People in the lowest income category (<$40K annual household income) are 72% non-holders, compared to the sample average 48%. The percentage of non-holders decreases progressively with income, and is smallest at 31% for the highest income group (>$100K). These income differences are significant at the 1% level (Pr.=0%).
A somewhat higher percentage of women in our sample (55%) than men (50%) are transponder-holders, however this difference is not significant at the 5% level (Pr.=11%). Also, a somewhat higher percentage of commuters (both genders) with children at home have transponders (54%) compared to commuters without children at home (49%), however this difference also is not significant at the 5% level (Pr.=6.1%).
Finally, commuters who reported using HOV3+ for their latest Mon.-Thurs. peak period trip report a much higher percentage of transponder holders (76%) than their SOV and HOV2 counterparts, who reported 55% and 59% transponder-holders, respectively. These differences among the three modes are significant at the 1% level (Pr.=0.5%). Note that the overall percentage of transponder-holders (58%) is higher for persons with recent trips recorded by our travel survey than among all survey respondents, some of whom no longer commute or travel infrequently in the corridor.
3.13 Additional Observations about Changing Travel Behavior over Time
An effort was made in our program of travel surveys to inquire directly about changes in travel behavior over the past few years, since such changes might have been influenced by the presence of the toll lanes. This was meant to compensate for the small size of the Panel sample in which we were actually able to observe the same individuals' travel behavior in both 1996 and 1999.
A two-pronged approach was taken. On the one hand, in our Random Dial and Repeat samples (including persons previously surveyed by UC Irvine), we were able to identify 299 persons in our samples who no longer regularly travel in the SR 91 corridor in peak periods, but who did do so within the past two years. Reasons for these changes were investigated. Secondly, respondents in the Random Dial and New License samples who currently use the corridor in peak periods were asked if they also commuted in the corridor two years ago. If so, they were then asked a series of questions about how their travel behavior might have changed during the intervening period.
Figure 3-51
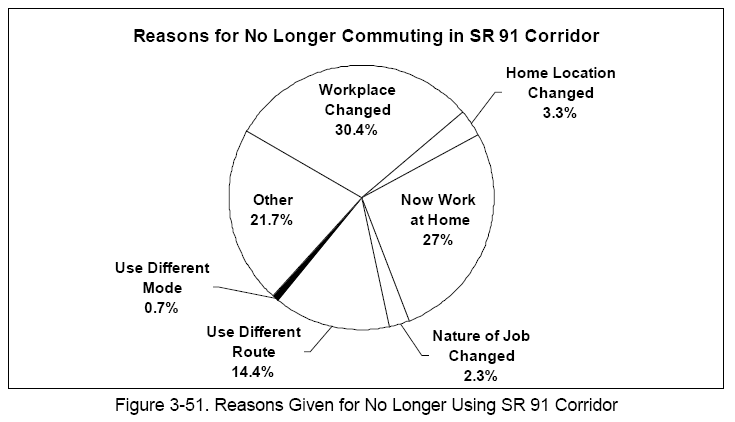
As shown in Figure 3-51, about a third of the people who no longer regularly use SR 91 during peaks have changed their work or job locations, or the nature of their work. Another 27% now work at home and 15% changed their method of travel.
The 224 persons who had not changed jobs or home location were asked if travel conditions in the SR 91 corridor had influenced this change, of whom a rather substantial 47% replied that changing travel conditions had influenced their decision to avoid using the corridor. When asked to explain, 86% of respondents cited worse traffic, and 18% cited the danger and stress of driving. 9% said they were discouraged by higher tolls. (Some people gave multiple answers.)
We examined the demographic characteristics of persons who no longer regularly use the corridor in peak periods. It happens that females and respondents of both genders in the lowest income category are significantly more likely to have discontinued commuting, with the difference for females significant at the 5% level (Pr.=2%) and for the low income group significant at the 1% level (Pr.=0%). However, there were no significant differences among genders or income groups in the reasons given for the change.
All survey respondents in 1999 were asked if they now commute between the same locations they did two years ago. Two-thirds (66%) said yes. These 988 persons were asked if their peak travel changed in the past two years and, if so, why.
80% of AM commuters and 75% of PM commuters said they now make about the same number of peak period trips as two years ago. The others are almost evenly split between making more or fewer trips, with slightly more people making fewer trips today than two years ago. Of 106 people making fewer peak trips, 12 (11%) cited worse traffic as a reason for the change. Only 4 people (4%) cited higher tolls. Most of the reasons given related to changing work conditions. Almost nobody (2 persons) cited availability of toll facilities (91X and ETR) as a reason for making more peak trips.
Survey respondents revealed considerably more change in ridesharing behavior. Fully 50% of 323 respondents say they rideshare a different amount than two years ago. Of those who changed, 24% now rideshare more and 26% now rideshare less. We examined the frequency of 91X lane use for persons whose rideshare levels did and did not change and found no significant differences among the subgroups (Pr.=57%).
Arrival time at work also changed considerably in the past two years, with 44% of 324 persons citing a change. Curiously, only 23% of respondents said their departure times from work also had changed. Of those citing a change, half now arrive earlier and half arrive later than before. We examined the frequency 91X lane use for persons whose arrival times did and did not change and found no significant differences among the subgroups (Pr.=79%).
We conclude that respondents to our surveys have made many adjustments to their travel behavior during the past two years, a substantial number in response to worsening traffic conditions. The presence of toll facilities, and the toll levels, appear to have had some influence on these behavioral changes, but less than the effect of congestion. There are significant income and gender differences in the changes observed. Changes observed in mode and time of day of travel appear unrelated to commuters' frequency of using the 91X toll lanes.
3.14 Methodology Appendix 3-A: Survey Design and Statistical Properties
The surveys of highway users were performed in the following manner:
- With a few exceptions, the surveys attempted to contact current weekday peak-period travelers in the SR 91 corridor. The interviews were intended to split evenly between trips in the AM and PM peak periods, however the actual split was about 60/40 AM/PM. Due to the nature of the contact method and questionnaires, some information about off-peak and non-corridor travel was also obtained, although those trips were excluded from the analyses.
- The exceptions to the focus on weekday peak period, peak direction travel occurred in the case of the Panel, Random Dial, and U.C. Irvine samples, where persons who
- do not now but used to commute in the corridor responded to special questions on why their travel behavior had changed. 36
- The New License Plate and Panel samples of highway users included three distinct survey populations: drive-alone (SOV), two-person carpools (HOV2), and three-plus rideshare groups (HOV3+). The same sample precision was sought for each of these groups, consistent with population size.
- In addition to obtaining a variety of traveler characteristics and perceptions, the surveys were designed to measure current travel behavior for a recent typical Monday through Thursday trip, as well as a recent Friday trip or another day if different from the Mon.-Thurs. experience. Travelers were also asked to contrast their current travel method with two year's previously, if they traveled in the corridor at that time. In the case of the Panel and U.C. Irvine samples, current trip characteristics could be compared directly with previously observed data. 37
- The Random Dial sample was obtained by randomly sampling phone numbers from exchanges throughout the commuter-shed of SR 91 in proportion to the number of trips from the different cities observed in our 1996 surveys. Persons who currently commute along SR 91 or who previously commuted during the past two years were asked to participate. A separate target sample of 600 interviews was established; a total of 645 interviews were actually obtained.
- For the New License Plate and Panel samples combined, the target sample sizes for the three population groups (SOV, HOV2, HOV3+) were 740, 680, and 544 (1964 interviews total). 38 The survey actually produced 1143 completed interviews and, from those interviews, 638 valid trip descriptions. The large target sample size was in part based on the expectation that only 200 respondents from our 1996 survey would be available. However, we were able to find 348 respondents for that Panel sample, which substantially exceeded expectations, and would have permitted a reduction in our original sample size targets. Of the 348, we are confident that 150 are indeed the same persons interviewed in 1996. On the other hand, our ability to obtain interviews with HOV commuters, especially the HOV3+ population, fell short of targets. Consequently, some statistical inferences for these populations may be not statistically significant due to data limitations. Nevertheless, the survey provided a large and well structured data base which, as this chapter demonstrates, permitted drawing numerous conclusions with high statistical confidence.
- The New License Plate sample was obtained by parking a university van equipped with a high resolution mast-mounted camera at key locations along SR 91 and the Eastern Toll Road (ETR) at times and for durations designed to obtain a target number of license plates for the critical HOV populations. Originally, a license plate reader was to be used, but it turned out to be more expedient to extract plate numbers from the videotapes manually. 8,650 license plate numbers were sent to the DMV for matching, which yielded 730 completed interviews. Approximately ten times as many plates are needed to compensate for commercial vehicles, persons unable to be contacted -- especially because of unlisted phones -- and refusals. In an effort to come closer to our targets for HOV vehicles, supplemental field data were collected by vehicles in chase cars traveling up and down SR 91 and recording needed license plate numbers. (The chase car method was more effective than the camera in hours of darkness.) The target number of license plates for the SR 91 free lanes and express lanes, and for the ETR, were established in proportion to their relative traffic volumes.
- Phone numbers were obtained from a commercial address-telephone number matching service and vehicle owners who appeared to be private individuals were contacted. Fleet vehicles and those owned by leasing companies were eliminated. An information letter was mailed, explaining the nature of the survey and requesting cooperation with a follow-up telephone call. Persons with unlisted numbers were asked to participate by contacting an 800 number (although that produced almost no interviews, even though a lottery and cash prize for participation was awarded). The household members who travel on SR 91 were identified and asked to participate in telephone interviews lasting 10-15 minutes. The phone contacts were conducted by a survey research subcontractor, SCR (Strategic Consulting & Research) of Irvine, California.
- Small supplemental on-board surveys of passengers traveling on scheduled transit services through the SR 91 corridor were conducted in fall of 1995 and fall of 1996. Also, a small survey of local businesses was conducted in winter of 1997. The findings from these surveys are fully documented in our previous report of May 1998.
Travel Surveys -- Sampling Considerations.
For the road user travel surveys, the initial unadjusted target sample size for each vehicle occupancy category was 420. The target sample of 420 was obtained from standard sample size formulas, using two statements about the intended use of the panel data:
-
Any proportion with a true value up to 0.22 (e.g., the proportion of HOV3+ travelers in the lowest income group) can be estimated with 90% confidence that the error in the estimate is less than ±0.033. The sample size formula for this condition is:

where Φα is the 2-tail cutoff point of the Normal distribution for 90% confidence (1.64), P is the assumed maximum value of the representative proportion to be estimated (0.22), and d is the maximum error in the estimated proportion (0.033). - The average travel time or cost for any subset of trips which makes up at least 20% of all trips made by the population can be estimated with 90% confidence that the relative error in the average is less than ±18%. The sample size formula for this condition is:
 /
/
where Φα is as above, f is the reciprocal of the minimum fraction of the sample to which the condition applies (5, which is the reciprocal of 0.20), and r is the maximum
relative error in the estimate (0.18).
These two statements are obviously arbitrary. For a broad travel survey of this nature, many different statements of this nature can be made, each leading to a different target sample size. The value of doing this at all is to establish an explicit basis for sizing the sample. What is far more important, as discussed below, is the amount of variability of the data actually obtained, and the corresponding levels of confidence associated with the findings which are estimated from these data.
Both the above statements yield a target sample size of about 420, assuming that the population from which the sample is drawn is infinitely large. However, in reality, the populations of peak direction SOV, HOV3, and HOV3+ commuters are finite, estimated a priori as 28160, 5640, and 1410, respectively. Using these estimated population sizes, the required samples are determined by the following formula, which adjusts a sample size which is close to the size of the population:

where
N′ is the adjusted sample size needed to achieve the stated sample accuracy for a finite size population,
N is the sample size needed for an infinite size population (420, in this case),
n is the population size (28160, 5640, and 1410 in this case).
This adjustment yields sample sizes of about 415, 390, and 325, respectively, for the SOV, HOV2, and HOV3+ occupancy groups. These adjusted targets were then reduced by the expected number of Panel sample members from our 1996 survey (which were 80, 80 and 40, respectively 39), leading to target values for the new License Plate sample of 335, 310, and 285, or a grand total of 930. This value was then doubled on the assumption that only half the respondents would have been commuting in the corridor for two or more years and therefore could reply to questions on how their travel behavior had changed during that period. By our best estimate, from all samples including the Random Dial, we obtained about 1290 SOV commuters, 355 HOV2 commuters, and 135 HOV3+ commuters. These sample sizes are more than adequate to draw many conclusions with high statistical confidence; although confidence levels for statements about comparisons to two year's ago for the HOV groups are sometimes limited by the small sub-sample sizes.
In conclusion, it must be emphasized that the accuracy targets identified here pertain only to a priori efforts to obtain samples with adequate and consistent statistical properties. Once the data have actually been collected, these target values become irrelevant and what matters is the quantity and variability of the actual data used in estimating parameters and comparisons. As seen throughout this chapter, despite some shortfalls in achieving target sample sizes, most of the comparisons on which our findings are based enjoy very high levels of statistical confidence. This is discussed in further detail in the methodology appendix of Section 2.15.
Travel Surveys -- Representativeness of the Samples.
As noted above, the License Plate and Panel samples in our 1999 survey were drawn as stratified or, more specifically, choice-based samples. That is, respondents were selected at random from the SOV, HOV2, and HOV3+ populations of commuters. The goal was to get roughly the same number of respondents in each group, even though, in the universe of all SR 91 commuters, there are many fewer HOV users than SOV users.
When a sampling approach such as this is used and data from the different populations are to be combined, for example, to create an overall income distribution for all SR 91 commuters, it is usually necessary to apply expansion factors in order to eliminate the bias from sampling the different populations at different rates. In our particular situation, in order to get unbiased estimates of the entire universe of commuters, we would have expected to count the data for each HOV respondent less than the data for each SOV respondent, since each HOV respondent in the sample represents a larger share of the actual HOV population.
The Random Dial sample was expected to provide an independent data source with which to establish appropriate expansion factors for the choice-based components of the survey, since the proportions of SOV, HOV2, and HOV3+ commuters in the Random Dial sample should be representative of the actual universe of commuters on the highway.
A series of statistical tests were run in order to explore these needed adjustments. To our surprise, because of our inability include as many HOV2 and HOV3+ commuters as intended in the sample, and because that shortfall was made up by over-sampling SOV commuters, we discovered that the mode distribution in both our 1999 Panel and License Plate samples was not significantly different than the mode distribution in the Random Dial sample. In other words, it is as if we had applied simple random sampling throughout.
The exception to this was the 1999 U.C. Irvine sample, whose 65 members showed characteristics significantly different than the others. Thus, to combine data from the Irvine sample with the other data, it is necessary to apply expansion factors. This was not actually done, due to the trouble required and the small number of observations involved. The U.C. Irvine sample remains available as a second panel sample that can be analyzed separately. Also, the U.C. Irvine data can be combined with the rest in cases where inferences are drawn for the three mode groups separately.
The following investigations for comparability among the different 1999 survey samples were completed:
- Vehicle occupancy differences (SOV, HOV2, HOV3+) among the samples (Pr.=25%, Pr.=45%);
- Difference in choice of toll lanes v. free lanes among the samples (Pr.=16%, Pr.=26%);
- Income differences among the samples (Pr.=37%, Pr.=24%);
- Gender differences among the samples (Pr.=0.3%, Pr.=0.4%);
- Age distribution differences among the samples (Pr.=0%, Pr.=0%);
- Level of education differences among the samples (Pr.=2%, Pr.=0.7%);
- Employment type differences among the samples (Pr.=15%, Pr.=16%);
- Whether full-time or part-time employees, differences among the samples (Pr.=14%, Pr.=7.6%).
In most of these comparisons, the high α-values which are shown indicate that the differences among the samples are not significant at the 5% level. In each case, two different α-values are shown. The first is for comparisons which include all four samples (Random, Panel, New License Plate, and U.C.I) and the second is for comparisons which include the first three samples but not the U.C.I. data.
In the case of the comparisons for modes and route choice, the levels at which the differences among the samples are not significant increases when the U.C. data are removed. A separate comparison of differences among modes which includes just the Random Dial and U.C.I. data also tests as insignificant, but with Pr.=10% and a zero cell value, which raises concern that the sampling regime is different from the rest of the samples. Therefore, we decided to eliminate the U.C.I. data from any analysis where bias due to different sampling rates for the different modes could affect the results.
Thus, with the exception of the U.C.I. sample, we conclude that although we set out to take a choice-based sample, the final sampling rates for the three modes are equivalent to a simple random sample. Consequently, expansion factors were not used in combining data for the statistical analyses. Note, however, that the comparisons among the samples for gender, age, and education show that our samples are significantly different at the 5% level. We concluded that this is probably due to a bias in the Random Dial sample, reflecting the observation that women and young household members are more likely to answer the phone than men and older household members.
4. Assessing Public Opinion40
4.1 Introduction
This chapter presents findings from the opinion questions contained in our 1999 travel survey, and compares them to results of similar questions in our opinion surveys of 1995 through 1997. Details on the conduct of the 1999 survey and sampling considerations appear in the methodology appendices of Chapter 3.
In order to accommodate the extensive travel behavior components of the 1999 survey, a reduced number of opinion questions were included, compared to previous years. A more extensive investigation of public opinion on a wide range of additional issues appears in our 1998 report. The survey instruments for 1999 and other years are available on the Internet. 41
This chapter also documents the highlights of local press coverage of the 91X facility during the past few years.
The next section contains a summary of the principal study findings concerning public opinions. Only current users or persons who traveled in the SR 91 corridor as recently as 1997 are represented in these findings. Succeeding sections present the related details. On the whole, the levels of public approval for all aspects of the 91X project declined between 1996 and 1999. Controversies surrounding a number of operational and institutional aspects of the project have recently received intense media scrutiny, which probably contributed to the lower levels of approval. The final section of this chapter reviews selected portions of that press coverage.
4.2 What We Learned about Public Opinion Regarding the 91X Toll Lanes
The following are the principal findings of this part of the study. The location in the text containing the supporting data for each finding is identified.
- Commuters in the SR 91 corridor draw a sharp distinction in their opinions about toll facilities generally and about the special characteristics of the 91X lanes. Approval for providing toll facilities in general remains high for most commute groups, in the 50-75% range, similar to three years ago. However, approval of variable tolls, which has consistently lagged approval of toll financing in general, decreased significantly from its high point of 55-75% in 1996 to the 30-50% range in 1999. (Section 4.3, Figure 4-1 and Figure 4-3.)
- Current approval of variable tolls varies significantly among groups depending on their method of travel. Among SOV commuters, a very large difference in approval (53% v. 28%) was observed between recent toll lane users and non-users, however no similar difference was observed for HOV commuters. (Figure 4-1 and Figure 4-3.)
- Levels of approval of variable tolls are not very sensitive to commuters' income. Commuters with household incomes above $100,000 were found to show higher approval
- Approval of private companies operating toll roads for profit decreased significantly among all commuter groups between 1996 and 1999, currently showing approval levels in the 3045% range, compared to 50-75% approval in 1996. As noted below, it is evident that public opinions about variable tolls and for-profit operations have been negatively affected by the highly public controversies which recently have occurred in connection with the 91X project. (Section 4.4, Figure 4-5.)
- Corridor commuters express generally high levels of approval (in the 45-75% range) for the idea of selling excess HOV lane capacity to SOV users, provided that this doesn't cause the HOV lanes to become congested. Apparently, the recent public relations difficulties of the 91X project do not extend to other related innovations. (Section 4.4, Figure 4-7 and Figure 4-8.)
- Recent media coverage of the 91X project and CPTC has contributed to negative public perceptions of the project. Well documented problems include worsening congestion and traffic spill-over to residential areas, collision experience, and charges of irregularity in CPTC's efforts to sell the business to a non-profit organization. Litigation and threatened litigation as well as government investigations have further affected the atmosphere. (Section 4.5.)
4.3 Opinions about Toll Lanes and Value Pricing
Since the beginning of this study, the idea of providing extra toll-financed lanes to bypass congestion (with no mention of variable tolls) has consistently been regarded positively by the majority of SR 91 commuters. Figure 4-1 shows the trend in approval ratings among different vehicle occupancy groups and based on whether the respondent most recently commuted on the free or toll facilities.
Although approval ratings decreased for the SOV commuter groups, overall approval for being able to pay to bypass congestion remained comparatively high, especially among commuters who reported using toll facilities for their recent trips (70-75% approval regardless of mode). SOV and HOV commuters who recently used the free lanes for their peak travel expressed significantly lower approval (50-55%). 42 The decline in approval between 1996 and 1999 for the SOV free lane group is significant at the 1% level (Pr.=0%), while the smaller reduction for the SOV toll lane group is significant at the 5% level (Pr.=4.4%). 43 The corresponding changes for HOV commuters between 1996 and 1999 are not significant at the 5% level. Interestingly, while the differences in approval levels comparing 1999 free lane and toll lane users are highly significant, once toll-paying behavior is accounted for, the differences between SOV and HOV users are not statistically significant.
Figure 4-1
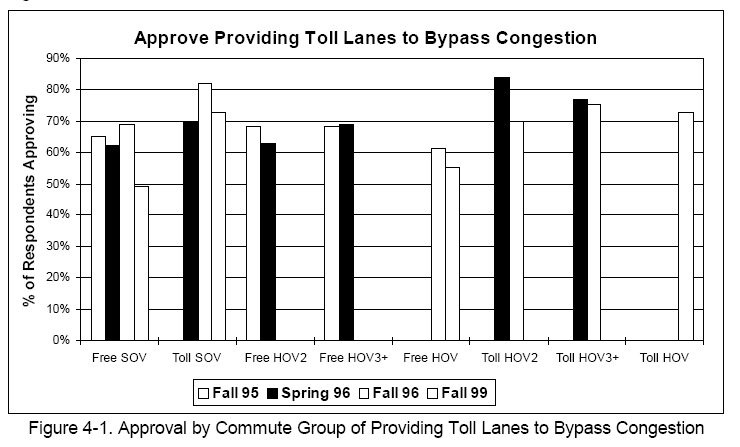
Since income level has been shown to influence toll lane use, we thought it would be of interest to examine whether public opinions vary with income. Figure 4-2 shows the income variations in approval ratings for providing toll lanes to bypass congestion, based on 1999 survey data. The relationship turns out to be fairly weak. Only the highest income group, at just over 70% approval, shows a strong positive correlation between approval and income. The difference between that group and all other groups combined is significant at the 1% level (Pr.=0%). The lower approval level for commuters the $40-60,000 range compared to both adjacent income groups is significant at the 5% level (Pr.=3%), however the difference between the <$25,000 and the $25-40,000 groups is not statistically significant (Pr.=41%).
In contrast to the approval ratings for providing toll lanes generally, approval for the idea of varying the tolls depending on the severity of the bypassed congestion decreased significantly among all commuter groups between 1996 and 1999. In this case, the question asked with prior reference to the 91 Express Lanes was, "The amount charged on the express lanes varies based on the amount of congestion the user avoids. Do you think this is… (multiple choice) A good idea/A bad idea/No opinion." Figure 4-3 shows the results. There exist similarities and differences compared to opinions on toll lanes in general (Figure 4-1). As before, SOV commuters who reported using the free lanes on recent trips showed the largest decrease in approval, from nearly 60% to just under 30%. However, SOV commuters using the toll lanes also showed a large decline, from 73% to 53%, a difference significant at the 1% level (Pr.=0.4%). Surprisingly, approval for variable tolls among HOV commuters using the toll lanes fell by about 30 percentage points to 40%, while the decrease for HOV commuters using the free lanes was less (from 58% to 46%). That latter decrease (for HOV commuters using the free lanes) is the only change not statistically significant at the 5% level (Pr.=8.6%), although the change would probably become significant if the sample size were larger (both rates are based on N=65-70).
Figure 4-2
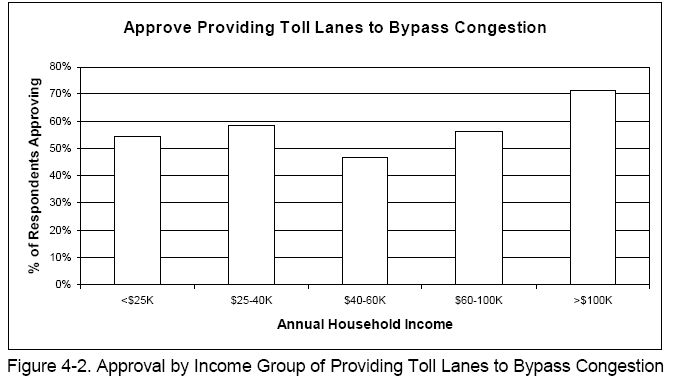
The pattern of approval for HOV commuters in 1999 appears to reverse the previously consistent trend that toll lane users approve of variable tolls more than free lane users. However, the HOV approval levels (46% and 40%) are not significantly different from each other at the 5% level (Pr.=25%). Also, the approval levels for all HOV commuters combined (43%) and for SOV toll lane users (53%) are not significantly different at the 5% level (Pr.=6.9%). The approval level for SOV free lane users (28%) is significantly different from that of SOV toll lane users (53%) at the 1% level (Pr.=0%).
Although approval of variable tolls has consistently lagged behind approval of non-variable priced toll lanes, why approval of variable tolls fell so far below approval of toll lanes in general is of concern. Resentment among some HOV commuters about charging 50% tolls to HOV3+ users in January 1998, where previously this group traveled for free, might partly explain why the approval level of HOV toll lane users fell so dramatically. Also, CPTC is the only Orange County toll facility operator using variable tolls, and extensive recent negative press coverage of CPTC and the 91X lanes (see Section 4.5) may have influenced, by association, the public's opinions of variable tolls. In any case, it is clear that variable tolls no longer enjoy the approval levels which had been reached at the end of the first year of operation of the 91X facility.
Figure 4-3
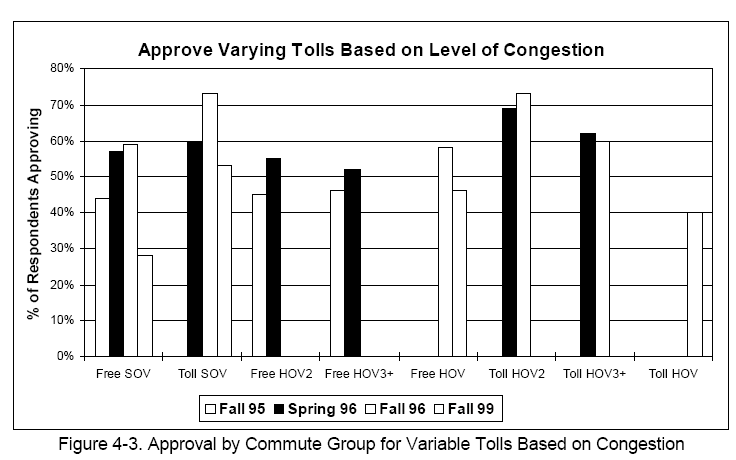
Figure 4-4 explores the relationship between approval of variable tolls and income in 1999. Although approval levels are lower across the board, the pattern is similar to that for toll lanes in general ( Figure 4-2). The difference in approval between commuters with incomes greater than $100,000 and all other groups is significant at the 1% level (Pr.=0.2%). However, although there appears to be an increasing trend, none of the pairwise differences between adjacent income categories less than $100,000 tested significant at the 5% level. We conclude that there is a weak positive relationship between approval of variable tolls and income.
These 1999 comparisons are based on 982 respondents in all four survey samples who answered our opinion questions, among whom 668 also reported income. In addition, we looked separately at the 241 persons in the Panel sample of households who participated in both the 1996 and 1999 surveys. For this subset of respondents overall, the expressed level of approval for variable tolls decreased from 63% in 1996 to 51% in 1999, a change statistically significant at the 5% level (Pr.=4.3%). While members of the Panel group seem not to be as negative about variable tolls as the complete survey group (which expressed 39% approval overall), the trend is similar.
Figure 4-4
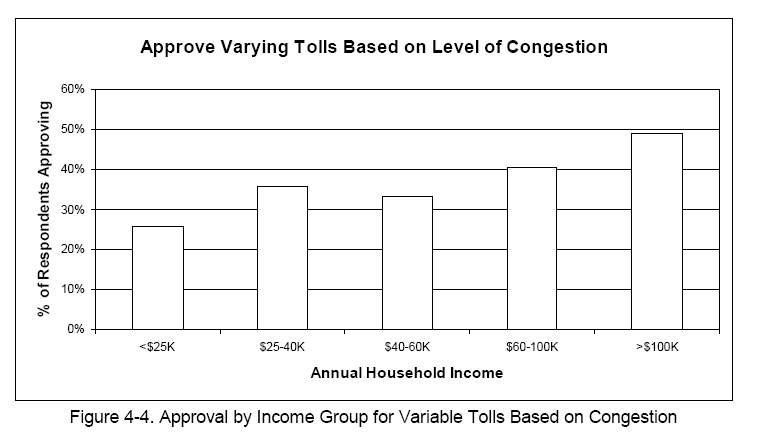
4.4 Opinions about Private Toll Facilities and SOV Buy-in
This section examines opinions regarding the private development and operation of the 91X lanes and the concept of permitting SOV commuters to use excess HOV lane capacity for a fee.
The public's approval of private, for-profit development and operation of toll lanes has been consistency lower than approval of variable tolls. As with variable tolls, approval levels for toll lane users generally exceed non-users. Also, as with variable tolls, between 1996 and 1999 approval of private toll facility operation decreased across the board. Figure 4-5 shows the trends over time. The decreases between 1996 and 1999 are statistically significant. The approval level for SOV commuters who use the toll lanes (45%) is significantly higher than for SOV commuters who use the free lanes (33%) at the 5% level (Pr.=1.3%), however the difference between HOV commuters using the toll lanes and free lanes (35% v. 29%) is not significant at the 5% level (Pr.=27%). Approval of SOV toll lane users (45%) exceeds that of all HOV commuters (32%) by an amount significant at the 5% level (Pr.=1.4%).
The relationship between approval of private for-profit operation and income is similar to what was seen for previous questions. A weak relationship exists, as shown in Figure 4-6. The approval rating in 1999 for commuters with income above $100,000 is significantly higher than for those with income below $100,000 combined, at the 1% level (Pr.=0%), however no increasing trend exists in pairwise comparisons between income categories less than $100,000.
Figure 4-5
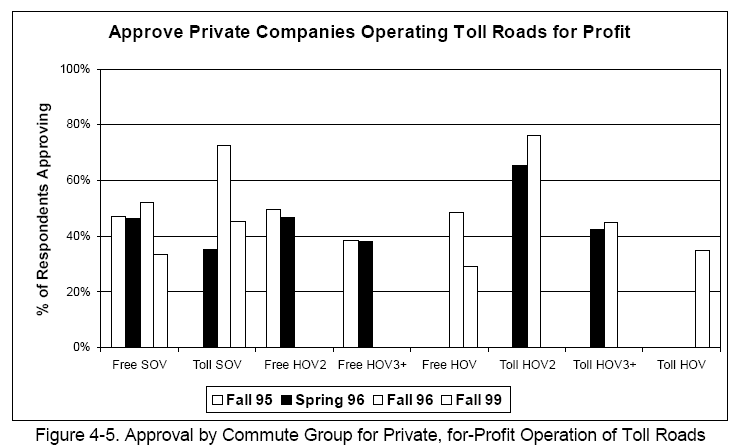
Figure 4-6
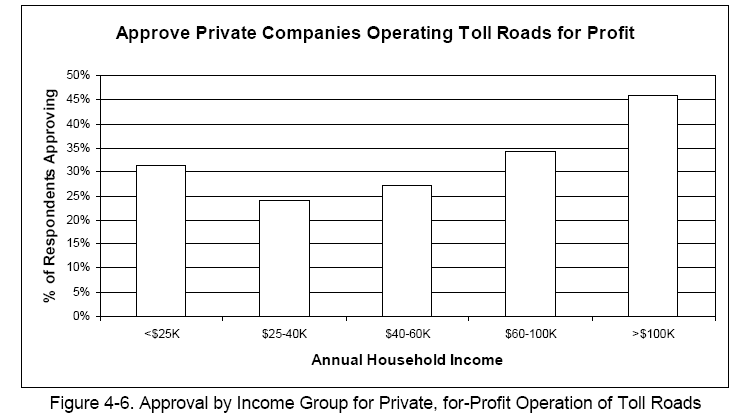
In our 1999 survey, participants were asked whether they thought it was a good idea to let single occupant vehicles use under-utilized carpool lanes for a fee, provided the lanes do not become congested. This question was not asked in surveys prior to 1999. Figure 4-7 shows that SR 91 users, and especially SOV commuters, are favorably disposed to this idea. However, even 45-50% of recent HOV commuters approve of the idea, which surpasses the approval levels of the HOV groups for both variable tolls and private toll lane operation. This probably reflects the fact that the survey respondents we classified as "HOV" also drive alone some of the time. Approval of SOV toll lane users (74%) exceeds that of SOV free lane users (59%) by an amount significant at the 1% level (Pr.=0.2%). The approval levels for the two HOV categories are not significantly different at the 5% level (Pr.=37%).
Figure 4-7
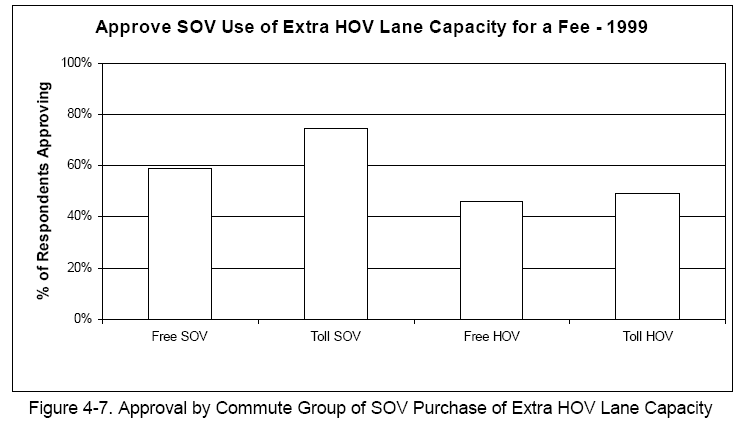
As shown in Figure 4-8, approval of SOV travelers purchasing excess HOV lane capacity is not very sensitive to income, registering above 50% in all categories. As usual, the >$100,000 group has the highest approval level (66%), exceeding all other income groups combined by an amount significant at the 5% level (Pr.=1.1%).
Finally, Figure 4-9 shows a breakdown of reasons given by the 1999 survey respondents who said they thought it was a bad idea to let SOV commuters purchase excess HOV lane capacity. While many reasons were given, about half the answers seem related to opposition to government receiving more funds. Concerns about favoritism to rich people were only 13% of the responses. 44
Figure 4-8
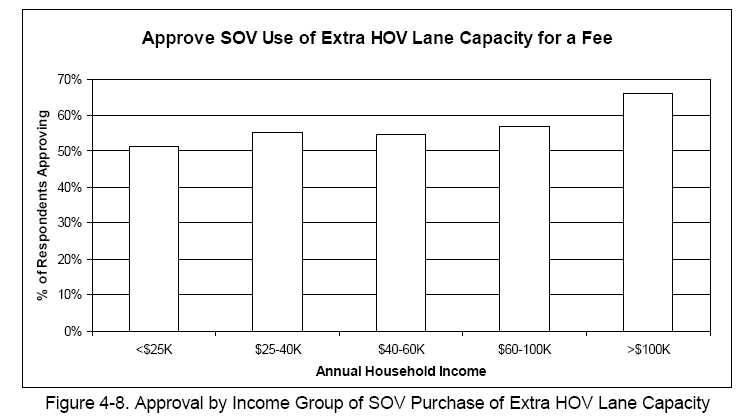
Figure 4-9
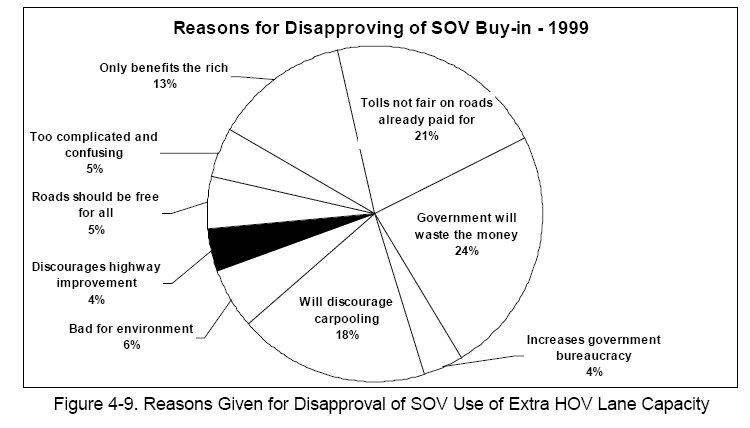
4.5 Highlights of Recent Media Coverage45
This section provides a brief review of a sample of news articles written between May 1997 and May 2000, found through a bibliographic search of regional publications. The review focuses on articles considered likely to have an influence on public opinion.
Recent media coverage of the 91X facility has portrayed the project as a clash between a number of competing interests -- public v. private, safety v. profit, Riverside County v. California Private Transportation Company and Caltrans, taxation v. private ownership, nonprofit v. for-profit organization. In addition, the project has been illustrated to the public as a web of lawsuits created by the forced intermingling of competing interests.
Media coverage of the 91X facility has questioned the private operation of toll roads and, specifically, how well the AB 680 law, which enabled private development of the 91X lanes, was written. One concern is whether the 91X project, the first in California to involve private development of toll lanes, has been a successful business. One article written shortly after the release of CTPC's first annual report (in May 1997) emphasized that a —$6.7 million net loss for the year“ (1996) indicates a commercial failure.[14] However, that same article acknowledged that a survey conducted by CPTC revealed a customer satisfaction rate of 95%.
Although CPTC's second year annual report (Spring 1999) showed a small profit, some reports about CPTC's efforts to sell the business described the project as financially troubled. One article comments, "If all CPTC has to do is wait a few years to make hundreds of millions, why wouldn‘t it just wait it out? The answer is that the CPTC doesn‘t really believe its own fantastic revenue projections… —[2]
In 1997, the idea of a nonprofit corporation buying the 91X lanes was introduced to the public and received considerable media attention. The Riverside County Transportation Commission prepared a proposal to —encourage a nonprofit corporation to buy the 91 express lanes from the toll lanes‘ for-profit owner.“ The nonprofit owner would —better serve those who commute“ stated Jack Reagan, executive director of the Commission. The nonprofit owners would be more concerned with —maintaining traffic flow“ as opposed to producing revenue.[ 18] CPTC, a for-profit company, had recently raised the toll rates twice within a year's time.
In 1998, it appeared likely that the toll lane franchise would soon be sold. A nonprofit organization called NewTrac entered negotiations for the purchase of the business. The public was told that if the acquisition went through —carpools would again ride for free and money that would otherwise have gone to profit would instead go back to the public.“[16] However, in a 1999 article, it was charged that CPTC —structured the sale (to NewTrac) to reap a substantial profit from their struggling investment.“[6] An investigation was launched into the sale of the toll lanes, in part because of an alleged —conflict of interest“ between CPTC and NewTrac.
Joint legislative hearings on the proposed sale, conducted in February 2000, produced considerable critical commentary about the 91X project and its operating concepts. —…a company created by CPTC attempted to buy the lanes using tax-exempt bonds issues by the state. The proposed sale was halted in December just days before it was to go through… The State Attorney General‘s Office and other agencies are investigating allegations of conflicts of interest.“ [12] The reporting included statements by elected officials such as —'I regard (toll roads) as a polite form of highway robbery.' Tom McClintock, Assemblyman.“
It seems fair to say that CPTC currently has a negative public image on several fronts. As discussed below, CPTC has been characterized as a company that is willing to sacrifice safety for profit, repeatedly raise toll rates, and be secretive in that they —rarely release figures“ about their performance.[18] The CPTC operation also has been charged with encouraging the illegal use of public carpool lanes in Riverside County.[9]
Media coverage has noted that CPTC has a —monopoly“ over the 91 freeway and will continue to have it until their 35-year contract is up.[6] This —monopoly“ is a result of a provision of the AB 680 law called the —absolute protection zone.“ The absolute protection zone prohibits the state from making improvements to alternate public routes in order to protect the company‘s investment and prevent their revenues from being —undercut.“[7,11] Although the absolute protection zone was created to encourage private companies to be willing to invest in building toll facilities, it is not depicted this way. As the press describes it, this provision gives private companies the ability to prevent the state and other public agencies from making any road improvements, even for safety reasons. The privatization of roads has been termed an —incredible breach of public trust.“[3]
The State of California has been accused of —failing in its duty to protect the traveling public.“[ 7] It has been questioned whether the State of California is —putting public safety at risk with these deals (allowing private companies to build toll roads and restrict improvement of alternate routes).“ —California can‘t successfully run a hybrid, public-private system,“ stated Attorney General Bill Lockyer.[11] Caltrans has also been cast in a negative light. The —internal workings of Caltrans“ have been —questioned“ by lawmakers.[10] —Caltrans breached an agreement it had with the county (Riverside) in an effort to assist the private operator of the toll lanes.“[9]. Caltrans has been accused of allowing the 91X customers to —illegally use public carpool lanes“ when they merge into the toll lanes. The chairman of the Riverside County Transportation Commission stated that he is —deeply concerned over the close cooperation between CPTC and Caltrans against the public in Riverside County.“[9] Caltrans has been said to have —overstepped its authority agreeing to not build road improvements that would compete with the toll lanes.“[19]
Some coverage has accused Caltrans of jeopardizing public safety in order to aid a for-profit company. An article reported a —significant increase in accident rates“ on State Route 91 and in one area —accident rates jumped by as much as 183% since the toll lanes opened in late 1995.“[10] Overall, —accident rates along the freeway are as much as 72 percent higher than on comparable stretches of freeway throughout California."[5]. It is stated that Caltrans cannot do anything to fix these problems due to the agreement with CPTC.
Although the 91X project and CPTC have received quite a bit of negative press coverage recently, there have been exceptions. One recent article in Riverside County praised the project for being innovative and for the philosophy behind the privatization of toll lanes. —The lanes have won national acclaim for pioneering the concept of ”congestion pricing‘.“[4]. It has also been stated that taxpayers have no right to complain about the toll lanes since —none of their money is at risk“ and the —private companies assume all risk.“[1] One recent public opinion article supports privatization and the —absolute protection zone,“ stating that there needs to be a reasonable degree of protection from state competition with toll lanes and if Caltrans had the —ability to add unlimited amounts of free capacity, no one is likely to buy toll road bonds.“[15]
The lawsuits and investigations surrounding the project throughout its history probably have influenced public opinion. In 1994, Riverside County officials filed suit against CPTC stating that they were —never consulted on the legislation or tollway deal.“[3] The lawsuit ended in a settlement. In 1999, Riverside County Transportation Commission threatened to sue NewTrac; this led to an investigation by the Attorney General‘s office to determine whether or not CPTC and NewTrac (the nonprofit company seeking to buy the toll lanes) had a —conflict of interest.“[6] About the same time, Caltrans was threatened with a lawsuit by CPTC after the agency proposed to make improvements to the parallel State Route 91 free lanes. Caltrans eventually dropped the improvement plan.[8] The Riverside County Transportation Commission also sued CPTC and the State of California, stating that —Caltrans has allowed the private toll-road company to illegally use public carpool lanes in Riverside County that are adjacent to the toll lanes.“ Riverside County —contends that Caltrans breached an agreement it had with the County in an effort to assist the private operator of the toll lanes.“[9]
Media coverage during recent years leaves the distinct impression that nobody is content with the situation which has developed. Relationships between some of the key participants seem to have become increasingly adversarial, adding to the difficulty of finding fair and reasonable resolutions to the important issues. These issues include establishing guidelines for improving competing highways without unduly undermining the financial health of the toll lanes, and implementing the sale or reorganization of the business to modify its organizational and tax status.
4.5.1 Appendix - References
- Arakal, B. Going the Wrong Way on Express Lanes. LA Times. January 23, 2000. p. B-15.
- Baker, J., Sweetheart Deals Take Their Toll. The Orange County Register. Commentary. February 20, 2000.
- Berkman, L, Bowles, J. Analyst Assails Tollway Takeover: Plan for 91 Lanes Called Wasteful. The Press Enterprise. December 15, 1999. p. A 01.
- Berkman, L, Garrett, R, Thurston, S. Easing the Commute. The Press Enterprise. May 21, 2000. p. A01.
- Bishop, D. Tough Toll Road Questions: Has the Public Been Endangered or Defrauded? The Sacramento Bee. January 11, 2000.
- Bowles, J. Sale of Toll Lanes Halted: As Officials Meet to Quash Bond Sales for the Highway 91 Lanes, the Deal is Pulled. The Press Enterprise. December 14, 1999. p. A01.
- Bowles, J, Garrett, R. How California Sold the Future of a Highway: Tax Shortage Led to Private Toll-Lane Deal. The Press Enterprise. January 2, 2000. p. A01.
- Garvey, M, James, M. Controversy Stops Sale of Toll Road in Orange County. LA Times. December 14, 1999. p. B-1.
- James, M. Caltrans‘ Link to 91 Toll Lanes Decried. LA Times. March 17, 2000. p. B-4.
- James, M. Legislators Vow Quick Action for Commuters. LA Times. February 3, 2000.
- Kelleher, J, McKim, J. Difficult Path for Toll Roads Transportation: The idea of Creating a Network of Public-Private Roads Hasn‘t Worked as Planned. The Orange County Register. January 5, 2000. p. C01.
- Kindy, K. and J. McKim. Heated Hearing Held on Tollway. The Orange County Register. February 2, 2000.
- McKim, J. Initiative Brushed Aside in 91 Deal? Transportation: Sales Tax Approved in 1990 Could Have Paid for Car-Pool Lanes and Prevented Toll Lanes, Critics Say. The Orange County Register. February 5, 2000. p. B01.
- Messina, F. Deficit, Fewer Clients Don‘t Dull 91 Operators‘ Pride. LA Times. May 2, 1997. p. B-4.
- Poole, R. Caltrans Had No Choice But Make Deal with 91 Express Lane Firm. LA Times. April 23, 2000. p. B-13.
- Pund, E. New Toll Lane Will Make Cars Breathe Easier. The Press-Enterprise. October 10, 1998. p. F01.
- Scott, G. Inland Empire Focus Driving the Economy: Roads to Aid Commerce. The Business Press/ California. October 13, 1997. p. 1.
- Scott, G. Officials Wants Toll Lanes Sold. The Business Press/California. September 29, 1997. p. 3.
- Steele, J. Panel Urges Purchase of 91 Toll Lanes. The Press Enterprise. April 13, 2000.
5. Modeling of Travel Choice and Elasticities46
5.1 Introduction
This chapter presents findings from the calibration of travel choice models, using the survey data described in previous chapters. Several different model specifications were tested for their ability to capture in a reasonable manner the influence of time and toll variations on revealed travel behavior.
The principal findings of the work are summarized in the next section. Subsequent sections present the details of the modeling approach, the models obtained, and the corresponding estimates of price elasticities. Details concerning the collection of the travel survey data and sampling considerations appear in the methodology appendices of Chapter 3. The coding and use of a network model of the study area highway system for developing time and cost variables needed in the choice modeling are discussed in Methodology Appendix 5-B (Section 5.11).
5.2 Principal Findings from Choice Modeling
The following are the principal findings from this part of the study. The location in the text containing the supporting data for each finding is identified.
- The work culminated in the development of three final choice model specifications: one joint logit model which only considers choice among the three alternative routes through the corridor (toll and non-toll); and two nested logit models, one which considers choice of mode, transponder acquisition, and route, and another which considers choice of time of day, transponder acquisition, and route. The models relate choices to the travel time and per capita toll for each option, along with numerous trip and traveler characteristics such as gender, age, income, education level, and employer policies on commuting. The models are powerful predictors of toll lane use with good statistical properties and consistency with other study findings, as reported in Chapter 3. (Table 5-IV, Table 5-VI, and Table 5-VII.)
- The calibrated choice models are shown to be robust with plausible parameter values. Model parameters are stable across different specifications, providing predictions, elasticities, and value of time estimates which do not vary much among the various model specifications. (Section 5.9.)
- Certain traveler or trip characteristics increase the willingness of commuters to use a toll road. One of the strongest is being female. Other factors -- high income, middle age, higher education, and being a commuter to work -- appear to affect toll-road use more indirectly, by favoring a willingness to acquire an electronic transponder. The combined effect is that women aged 30-50 are more likely to choose a toll road than any other age/gender classification, and this effect seems to hold across different amounts of time savings and toll levels. (Section 5.9.)
- Estimates of travelers' implied average values of time are similar among the preferred models, approximately $13-16 per hour. (Table 5-IV, Table 5-VI, and Table 5-VII.)
- The price elasticity for use of the 91X lanes during the 6-hour period of heaviest use (morning westbound or afternoon eastbound) is consistently about 0.7 to 0.8, based on response to uniform percentage toll changes. This means that a 10% across-the-board toll increase would result in about a 7-8% decrease in toll facility use.47 More targeted toll increases -- during just the one-hour "peak of the peak" -- yield price elasticities between 0.9 and 1.0. These results demonstrate that there is scope for adjusting toll schedules, even in as small as one-hour increments, in order to regulate traffic levels. (Sections 5.5 and 5.8.)
5.3 Overview of Methodology
Traveler responses to value pricing in the SR-91 corridor occur along many dimensions. First is the decision of which route to take. We represent this decision as one of whether to travel in the express lanes (91X), the free lanes (91F), or the Eastern Toll Road (ETR). The latter involves taking SR-241 along with a short stretch of the SR-91 free lanes at the eastern end of the study section. Other traveler responses include changing time of day and/or changing car occupancy (which we term —mode choice,“ given the very small mode shares of bus and rail in this corridor). In addition, as part of the route decision but still distinct from it, the traveler decides whether or not to install a transponder in order to pay tolls electronically (which is required for 91X and optional for ETC).
Ideally, all these responses should be modeled simultaneously, either as fully joint decisions or as some kind of hierarchical decision process. However, the most important response for predicting overall use of the express lanes is probably route choice. Therefore, we opted to first develop route choice models, conditional on time of day and mode. Later we expand the model to allow for the route choice to be made simultaneously with these other choices.
Travel demand analysis of such choices is based on the idea that each traveler maximizes some unobserved quantity called —utility“ which indicates the relative desirability of the alternatives. This utility has both systematic and random parts. The goal is to estimate the systematic part while accounting realistically for the presence of the random part. This is typically accomplished by defining the utility for the individual choosing alternative:
![]()
where X ij denotes a set of observable characteristics for the individual and
alternative, B is a vector of parameters to be estimated, and ε is the random part of utility. The parameters denoted by B contain quantities of practical interest; for example, if time and cost are included as simple linear variables, the value of time can be defined as the ratio of their coefficients.
If the random parts of utility for the various alternatives j are independent of each other, and they follow a particular statistical distribution known as —extreme value,“ these assumptions lead to the conditional logit model for the probability Pij that individual i chooses alternative j:

The three route choices considered here differ from each other in two equally important ways: two are toll routes, and a different two follow the same geographical route. Therefore, for route choice, we see no reason to expect that any two choices would be more closely related (in terms of the random part of the utility) than any other two. Under these circumstances, the logit model is appropriate, and it is assumed to apply to the route choice. A more complex model, nested logit, is necessary for the more complex models.
For a random sample, the model is estimated by maximizing the likelihood function, consisting of the sum over observations of the logarithms of estimated Pij for the observed choices. However, our data include a random subsample and three choice-based subsamples. That is, in these three subsamples, the potential survey respondents were identified by observing people traveling on one of the routes being studied. Fitting a logit model with choice-based subsamples leads to biases in the parameter estimates, primarily in the —alternative-specific constants“ which indicate systematic preferences for one alternative over another. This problem can be eliminated by weighting the observations appropriately in the log-likelihood function, resulting in an estimator known as a Weighted Exogeneous Sample Maximum Likelihood Estimator (WESMLE). This estimator and the weights we use to implement it are described in Appendix 5-A found at the end of this chapter (Section 5.10). In all our models except time of day, most of the weights are near one, so weighting has little effect on the results.
5.4 Variables and Results: Route Choice
We begin with the simplest model, which is route choice only. In this model, time of day and mode are assumed to be exogenous. We will see later that this assumption is supported as a good approximation by the more complex models. Getting a transponder, by contrast, is treated as an inherent part of the route choice œ that is, any inconvenience associated with getting a transponder is simply reflected as a part of the mode-specific constant for 91X and ETC. Later, we consider explicitly the choice of whether to acquire a transponder.
Table 5-I defines the variables used in all the models of this study. These are chosen based on past experience with travel demand models and knowledge of factors that seem to affect choices in this corridor. For the route choice model, the variable —toll/person“ reflects the fact that this model is conditional on mode choice, so we know the number of people in the vehicle. Use of this variable implicitly assumes that all the people in the vehicle share the toll equally. (We did not ask the age of people riding in the car, so we are unable to adjust for differences that might apply to children.) Both in previous studies and in this one, this form of toll seems to fit better than others, and it is quite plausible œ even if money does not actually change hands among the occupants in a car, it is likely that the terms of ride sharing are negotiated on the understanding that the driver should not have to bear the entire financial burden of a decision to take a toll road.
The variable —time“ was computed by Cal Poly staff using a network model and shortest-path algorithm to find the least-time paths using the alternative routes for any given origin and destination. The coding and use of the network model are described in detail in Appendix 5-B (Section 5.11). Eleven different networks were used, each representing a different time of day (five for the AM peak, six for the PM peak). The shortest time value for each alternative (91F, 91X, ETR) was computed using appropriate deletions of links in the network. In computing —time“ for the ETR alternative, the 91X link was deleted; however, for people not going to South Orange County, the result may actually reflect a path that does not use the ETR at all. This can be recognized in the data as identical travel times for 91F and ETR. For such individuals, it is assumed that the ETR is not a viable alternative and the ETR is therefore deleted from the choice set. (A very small number of such people œ approximately four œ reported that they did nevertheless choose ETR; we assume there is some coding error for them and they were dropped from the estimation sample.) As a control for possible bias if this assumption is not strictly accurate, we estimate a separate alternative-specific constant for ETR, or alternatively we allow the coefficient of —time“ to be different for the ETR choice, but interpret the result as a statistical correction and not a real behavioral difference.
Table 5-I. Definitions of Independent Variables
| Independent Variable | Description |
|---|---|
| Alternative-Specific Estimated Variables | |
| time | travel time in minutes, for the route in question, given the individual?s time of day and home and work destinations. |
| toll/person | toll in dollars, divided by number of people in vehicle (assumed to be 3 if there are three or more) |
| Alternative-Specific Dummy Variables | |
| Transponder | transponder dummy (1 for transponder, 0 otherwise) |
| DT | toll route dummy (1 for 91X or ETR, 0 otherwise) |
| ETR | Eastern Toll Road dummy (1 for ETR, 0 otherwise) |
| HOV | Carpool dummy (1 for HOV2 or HOV3+, 0 otherwise) |
| HOV3 | HOV3+ dummy (1 for HOV3+, 0 otherwise) |
| T1 | before peak dummy (1 for time period between 4 AM and 5 AM or between 2 PM and 3 PM, 0 otherwise) |
| T2 | early peak shoulder dummy (1 for time period between 5 AM and 7 AM or between 3 PM and 5 PM, 0 otherwise) |
| T4 | late peak shoulder dummy (1 for time period between 8 AM and 9 AM or between 6 PM and 7 PM, 0 otherwise) |
| T5 | after peak dummy (1 for time period between 9 AM and 10 AM or between 7 PM and 8 PM, 0 otherwise) |
| BP | before peak of the peak (T1+T2) |
| AP | after peak of the peak (T4+T5) |
| Traveler and Trip Characteristics | |
| income | annual household income in thousands of dollars, calculated as mid-point of the income interval (except coded as 9 for the category <10, and as 120 for the category >100) |
| high income | 1 if income<100, 0 otherwise |
| low income | 1 if income>40, 0 otherwise |
| wage | Income*1000/2000, intended to approximate the hourly wage rate in $/hr (assuming one worker works 2000 hours per year) |
| female | gender dummy, 1 if female, 0 otherwise |
| male | gender dummy; 1 if male, 0 otherwise |
| child | children in household dummy; 1 if there are children 18 years old or less in household, 0 otherwise |
| age30-50 | age dummy; 1 if between 30 and 50, 0 otherwise |
| age50+ | age dummy; 1 if greater than 50, 0 otherwise |
| lang | language dummy; 1 if foreign accent detected by phone interviewer, 0 otherwise |
| edu | 1 if has bachelor or higher degree, 0 otherwise |
| prof | 1 if occupation is manager or professional, 0 otherwise |
| commute | dummy for commute trip; 1 if commute trip, 0 otherwise |
| distance | shortest distance from origin to destination, in 10's of miles |
| am | 1 if a morning trip, 0 otherwise |
| pm | 1 if an afternoon trip, 0 otherwise |
| program | 1 if employer has program encouraging ridesharing, 0 otherwise |
| home | 1 if permitted to work at home, 0 otherwise |
| flex | 1 if has flexible arrival time for AM trip or flexible departure time for PM trip, 0 otherwise |
Our sample includes people both with and without the electronic transponders which are required to use the 91X toll lanes and which facilitate use of the ETR. This reflects our view that the decision to acquire a transponder (and the associated financial account) is endogenous to the choices being considered here; to include it as an explanatory variable would be akin to including possession of a transit pass in explaining choice between auto and public transit. Nevertheless, we recognize that the decisions to install and use a transponder are taken in different time frames, so a better way to model this would be as a joint decision process. This is done in the more complex models described later.
As the first step of model specification, we tried to find a —good“ base model in which income is not considered—good“ meaning the model fits well and the estimates of most parameters are statistically significant and plausible. The results from different trials are shown in Table 5-II.48 We begin with the general specification shown in Model 1a, then we drop the most insignificant parameters and re-estimate the model (Models 1b and 1c). These models show that certain traveler characteristics -- notably language, gender, being in the middle age group (30-50), and having a college education -- have reasonably stable effects on propensity to choose a toll road (as judged by coefficients of variables like —DT*lang,“ —DT*male,“ etc.). These characteristics do not seem to have much of a differential effect on choosing the ETR as opposed to the 91X (as judged by —ETR*lang,“ —ETR*male,“ etc.). Therefore, in Model 1d all interactions with ETR are dropped, except for one variable which, as noted above, is intended to control for possible biases due to the way —time“ was calculated for the ETR alternative. (For this reason, the variable —ETR*time“ is ignored in calculating the value of time.) We consider Model 1d our best base model without income in the specification.
Table 5-II. Estimation Results of Base Model
| Variable | Model 1a | Model 1b | Model 1c | Model 1d |
|---|---|---|---|---|
| Time | -0.125 (0.022) |
-0.118 (0.019) |
-0.118 (0.019) |
-0.119 (0.019) |
| Toll/person | -0.442 (0.110) |
-0.436 (0.109) |
-0.443 (0.109) |
-0.416 (0.099) |
| DT | -0.577 (0.410) |
-0.485 (0.392) |
-0.265 (0.297) |
-0.347 (0.280) |
| DT * lang | -0.486 (0.294) |
-0.489 (0.294) |
-0.477 (0.294) |
-0.311 (0.276) |
| DT * male | -0.904 (0.179) |
-0.896 (0.179) |
-0.802 (0.175) |
-0.802 (0.174) |
| DT * age30-50 | 0.709 (0.328) |
0.720 (0.328) |
0.457 (0.184) |
0.431 (0.178) |
| DT * age50+ | 0.342 (0.356) |
0.354 (0.357) |
||
| DT * educ | 0.363 (0.183) |
0.308 (0.178) |
0.320 (0.177) |
0.319 (0.177) |
| DT * commute | 0.105 (0.191) |
|||
| ETR | -0.001 (0.678) |
-0.161 (0.599) |
-0.051 (0.550) |
|
| ETR * lang | 0.808 (0.556) |
0.799 (0.546) |
0.826 (0.551) |
|
| ETR * male | 0.540 (0.420) |
0.565 (0.416) |
||
| ETR * age30-50 | -0.873 (0.646) |
-0.981 (0.626) |
-0.783 (0.587) |
|
| ETR * age50+ | -1.238 (0.806)p |
-1.395 (0.796) |
-1.064 (0.699) |
|
| ETR* educ | -0.451 (0.454) |
|||
| ETR * commute | -0.162 (0.444) |
|||
| ETR * time | -0.013 (0.004) |
|||
| Mean VOT | $16.97/hr | $16.24/hr | $15.98/hr | $17.16/hr |
| Log-likelihood | -498.79 | -499.56 | -501.50 | -502.19 |
| Pseudo R2 | 0.206 | 0.205 | 0.202 | 0.201 |
| # of observations | 770 | 770 | 770 | 770 |
Notes:
|
||||
Next, we add income into the model in different ways. The results of these estimations are shown in Table 5-III. In Models 2a and 2b, we interact income (or wage, which here is just another form of income) with toll. In Models 2c and 2d, we interact income or wage with time. These specifications are intended to allow the value of time to vary by income. However, we find that a better fit is obtained in Models 2e and 2f, where we interact income with the toll lane dummy instead of with time or toll. Model 2f, in which income affects toll-lane choice continuously (rather than in discrete amounts), provides the best fit. It suggests that income affects the willingness to use a toll road more or less across the board, independent of the time or toll savings that apply for that particular individual. Model 2f also has quite plausible parameters, including implied values of time well within the expected range for this relatively affluent population. We conclude that Model 2f is the best of the models incorporating income effects.
Table 5-III. Estimation Results of Route Choice Model Accounting for Income
| Variable | Model 2a | Model 2b | Model 2c | Model 2d | Model 2e | Model 2f |
|---|---|---|---|---|---|---|
| Time | -0.113 (0.019) |
-0.113 (0.019) |
-0.102 (0.022) |
-0.114 (0.019) |
-0.112 (0.019) |
|
| Time * (wage/10) | -0.024 (0.004) |
|||||
| Time * high income | -0.049 (0.023) |
|||||
| Time * low income | 0.033 (0.032) |
|||||
| Toll/person | -0.241 (0.114) |
-0.438 (0.103) |
-0.406 (0.100) |
-0.381 (0.100) |
-0.411 (0.102) |
-0.407 (0.102) |
| (Toll/person) / (wage/10) | -5.240 (1.704) |
|||||
| (Toll/person) * high inc. | 0.206 (0.075) |
|||||
| (Toll/person) * low inc. | -0.152 (0.104) | |||||
| DT | -0.238 (0.287) |
-0.253 (0.287) |
-0.273 (0.286) |
-0.231 (0.282) |
-0.304 (0.300) |
-1.254 (0.345) |
| DT * lang | -0.201 (0.282) |
-0.232 (0.280) |
-0.280 (0.277) |
-0.258 (0.279) |
-0.160 (0.284) |
-0.146 (0.287) |
| DT * male | -0.852 (0.178) |
-0.861 (0.178) |
-0.835 (0.175) |
-0.843 (0.175) |
-0.894 (0.179) |
-0.885 (0.179) |
| DT * age30-50 | 0.377 (0.182) |
0.416 (0.183) |
0.429 (0.182) |
0.418 (0.178) |
0.425 (0.184) |
0.418 (0.180) |
| DT * educ | 0.208 (0.182) |
0.191 (0.184) |
0.238 (0.181) |
0.184 (0.179) |
0.146 (0.185) |
0.097 (0.185) |
| DT * (income/10) | 0.136 (0.030) |
|||||
| DT * high income |
| 0.643 (0.203) | ||||
| DT * low income | -0.665 (0.284) |
|||||
| ETR * Time | -0.013 (0.004) |
-0.013 (0.004) |
-0.014 (0.004) |
-0.014 (0.004) |
-0.013 (0.004) |
-0.013 (0.004) |
| Mean VOT | $17.89/hr | $16.59/hr | $16.16/hr | $14.95/hr | $16.64/hr | $16.51/hr |
| VOT with high income | $29.22/hr | $22.32/hr | ||||
| VOT with low income | $11.49/hr | $10.20/hr | ||||
| Log-likelihood | -497.59 | -496.23 | -499.18 | -498.52 | -492.36 | -491.18 |
| Pseudo R2 | 0.208 | 0.210 | 0.205 | 0.206 | 0.216 | 0.218 |
| # of observations | 770 | 770 | 770 | 770 | 770 | 770 |
| Note: VOT (value of time) is the ratio of the marginal effects of increasing the time and the toll per person, times 60. Where it varies across groups, it is calculated separately for each group and a weighted average is taken. | ||||||
Note: VOT (value of time) is the ratio of the marginal effects of increasing the time and the toll per person, times 60. Where it varies across groups, it is calculated separately for each group and a weighted average is taken.
Table 5-IV shows attempts to see whether the effects of age and gender are due to higher values of time among people likely to have family responsibilities. In Model 2b′, 2e′and 2f′, we re-estimate Models 2b, 2e and 2f but interact the age and gender variables with age3050 and time. However, these models do not fit as well as the corresponding Models 2b, 2e, and 2f.
Our search ends with Model 3 (also presented in Table 5-IV), in which we add into Model 2f a new variable indicating professional or managerial occupation. This variable is a powerful predictor of toll lane use. The variable indicating higher education, which is highly correlated with it, becomes insignificant so is not included in Model 3.
Table 5-IV. Estimation Results of Route Choice Model: Further Specifications
| Variable | Model 2b′ | Model 2e′ | Model 2f′ | Model 3 |
|---|---|---|---|---|
| Time | -0.101 (0.025) |
-0.102 (0.025) |
-0.101 ( 0.025) |
-0.110 (0.020) |
| Toll/person | -0.452 (0.104) |
-0.429 (0.103) |
-0.425 (0.104) |
-0.406 (0.103) |
| Time * age30-50 | -0.042 (0.026) |
-0.043 (0.026) |
-0.042 (0.026) |
|
| Time * age30-50 * female | 0.057 (0.035) |
0.058 (0.035) |
0.058 (0.035) |
|
| (Toll/person) * high inc. | 0.198 (0.074) |
|||
| (Toll/person) * low inc. | -0.170 (0.107) |
|||
| DT | 0.157 (0.274) |
0.131 (0.283) |
-0.837 (0.340) |
-1.332 (0.349) |
| DT * lang | -0.190 (0.283) |
-0.119 (0.286) |
-0.108 (0.290) |
-0.120 (0.291) |
| DT * male | -1.074 (0.219) |
-1.114 (0.220) |
-1.104 (0.220) |
-0.881 (0.179) |
| DT * age30-50 | 0.400 (0.181) |
|||
| DT * educ | 0.213 (0.184) |
0.171 (0.185) |
0.120 (0.185) |
|
| DT * prof | 0.330 (0.178) |
|||
| DT * (income/10) | 0.136 (0.030) |
0.132 (0.030) |
||
| DT * high income | 0.610 (0.201) |
|||
| DT * low income | -0.176 (0.290) |
|||
| ETR * Time | -0.013 (0.004) |
-0.013 (0.004) |
-0.013 (0.004) |
-0.013 (0.004) |
| Mean VOT | $16.27/hr | |||
| Log-likelihood | -497.19 | -493.34 | -492.12 | -489.42 |
| Pseudo R2 | 0.209 | 0.215 | 0.217 | 0.221 |
| # of observations | 770 | 770 | 770 | 770 |
Based on our best model, Model 3, we can summarize some properties of the results. First, both the time and cost coefficients are significant and their estimates are very stable across different models. This means that the value of time and the price-elasticities, which depend on these variables, are not very sensitive to the model specification.
Second, women and people aged 30 to 50 are considerably more likely to use toll roads. The combined effect of these two characteristics means that women aged 30-50 are more likely to choose a toll road than any other age/gender classification, and this effect seems to hold across different amounts of time savings and toll levels. We suspect that these results reflect a relationship between greater family responsibilities and the need for a predictable schedule, along with the perception (probably accurate) that travel time predictability is a characteristic of both toll roads throughout the day.
Third, professionals and people with higher incomes are more likely to choose the toll roads. Probably this reflects a combination of higher value of time (indicated in those models where income is interacted with toll or time) and higher willingness to pay for increased reliability (for which we do not have explicit measures). At the same time, the effects are far from overwhelming. For example, the effect on the probability of choosing a toll road of an additional $30,000 in household income (which in Model 3 raises utility by 0.132*3 = 0.396) is about the same as the effect of being in the 30-50 age group (0.400), and less than half the effect of being female (0.881).
The estimates for mean value of time from the various models are very similar, about $16 per hour. This estimate is quite plausible for the relatively affluent population using this corridor. This is especially true given that we are not separately controlling for reliability; rather, the value of "time savings" here includes the value of those unmeasured reliability improvements that go along with them.
5.5 Price Elasticity of Toll Road Use: Route Choice Only
There are many questions one can ask about the effects of price changes on the use of toll roads. One of the most interesting, which we are now well equipped to answer, is how much route shifting would occur if tolls were generally higher or lower.
We use sample enumeration to estimate the response in terms of traffic volume on the SR 91 express lanes during the relevant hours, with respect to various changes in the tolls. In each case, the sample is the same one we used for estimation, weighted as described, since that sample should be representative of the population using the corridor.49 In each case, we consider an identical percentage increase in all the toll charges for a given time period. The predicted change in passenger volume would be calculated by summing the (weighted) probabilities of each person choosing the 91X alternative. The predicted change in vehicle volume is the same, except the contribution of each carpooler is divided by the number of people in the carpool (to a maximum of three).
The time periods considered are: the 4-hour morning peak (5 am-9 am) westbound; the 4hour afternoon peak (3 pm-7 pm) eastbound; the 6-hour morning peak (4 am-10 am) westbound; the 6-hour afternoon peak (2 pm-8 pm) eastbound; and the 12-hour daily peak in both directions (i.e. both the 4 am-10 am westbound and 2 pm-8 pm eastbound). The results are shown in Table 5-V in terms of the percentage change in traffic for a given percentage change in tolls. The elasticity is just the ratio of these percentage changes. For example, the elasticity of the 4-hour morning peak volume when tolls are increased 10% is œ7.54/10 = -0.754.
The results show that the relationship is mildly nonlinear. As tolls are increased up to 100%, the effect on traffic increases less than proportionally. Generally, the elasticities are all quite similar, and our results can be summarized by saying that the elasticity value which applies for small increases in tolls is approximately œ0.7
These calculations are intended to display the properties of the demand model, not the overall system. They assume travel times are held constant. In order to forecast the full effects of raising the toll, we would also have to take into account the effects that these changes would have on congestion. Raising tolls on the 91X would probably add to congestion on the 91F, which in turn would dampen the shift to the 91F shown here. Given a model of congestion formation, we could use the demand model shown here in a process known as —equilibration“ to predict the complete set of route shifts and changes in travel times.
Table 5-V. Estimated Response to Toll Changes Using Model 3
| 10% increase in toll | 50% increase in toll | 100% increase in toll | |
|---|---|---|---|
| % change of 4-hour morning peak volume westbound (5am-9am) | -7.54 | -33.27 | -56.28 |
| % change of 4-hour afternoon peak volume eastbound (3pm-7pm) | -7.11 | -32.35 | -55.99 |
| % change of 6-hour morning peak volume westbound (4am-10am) | -6.88 | -30.63 | -52.42 |
| % change of 6-hour afternoon peak volume eastbound (2pm-8pm) | -7.45 | -32.58 | -56.18 |
| % change of 12-hour daily peak volume both directions (4am-10am westbound, 2pm-8pm eastbound) | -7.03 | -31.53 | -54.16 |
| Note: Approximate point elasticities are obtained by dividing the numbers in the left column by 10. | |||
5.6 Simultaneous Models of Choice of Mode, Transponder, and Route
In this section, we model route choice simultaneously with the choice of vehicle occupancy (which we call mode choice) and with the choice of getting a transponder. A primary objective is to see how much pricing might affect the extent of carpooling. Another objective is to more accurately capture the feedback between the route and carpool choices, and the barriers that may exist in getting a transponder.
We distinguish three car occupancy categories: driving alone (SOV), a vehicle with two people (HOV2), and a vehicle with three or more people (HOV3+). For each occupancy category, there are five possible combinations of transponder and route: people can get a transponder and travel on any of the three routes, or they can forego a transponder and travel on two of the three routes (ETR and 91F). Thus, there are 3x5=15 alternatives in all.
The problem of adjusting for the non-random sampling scheme is now more complex, but it operates on the same principles as before. The model is conditional upon traveling either in the morning (westbound) or the afternoon (eastbound), so in fact there are 30 weights to compute for each of the non-random subsamples (—new plates“, —repeat“, and —UCI“).50 The random subsample is assumed to accurately reflect the population distribution across the 15 alternatives. Therefore the weight assigned to a sample member choosing any particular alternative is the ratio of the share choosing that alternative in the random sample to its share in the relevant subsample. (The weight for anyone in the random sample is 1.0.) The resulting weights are described more fully in Appendix 5-A, Section 5.10.
Figure 5-1
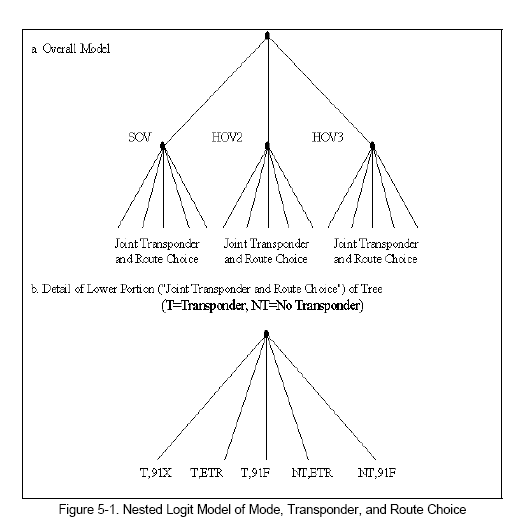
One possible choice model for this situation is the joint logit model, meaning that all 15 alternatives are treated as equally distinct. (Formally, this means the random utilities for the 15 alternatives are assumed independent of each other.) We estimated such a model to see whether plausible forms for the variables can be found, and they can. We also explored the effects of weighting, and found as expected that the weights make little difference except to some of the alternative-specific constants (which are determined in large part by the absolute numbers of people in the sample choosing them). One of these models is shown in the Appendix, Table 5-XVIII.
However, a joint logit model cannot meet one of the primary goals of this phase of the work: to see how much travelers would shift carpooling behavior relative to route. The reason is that joint logit imposes an equi-proportionate shift from any one alternative to all the others œ so, for example, any alternative that becomes more expensive loses share to all other alternatives in proportion to their initial shares. But we want to allow for the possibility of unbalanced shifts, in particular a greater tendency to shift to other routes than to other modes. We do this by using a nested logit model based on the tree structure in Figure 5-1. This model does not force an unbalanced shift, but it allows for it, depending on the parameters ρk in the following choice formula, which replaces equation (5-2):

where Pijk is the probability that individual i will choose transponder-route combination j (from the 5 possibilities) and mode k (from the 3 possibilities). The new quantity Ik introduced in this equation is called the —inclusive value“ of mode k; it is defined as the logarithm of the denominator of the first of the two fractions shown in equation 5-3, and can be viewed as an index of the overall desirability mode k. (Formally, Ik is the expected utility achieved by choosing the best of the five transponder-route options, given mode k.) The parameter ρk is called the coefficient of inclusive value. If all three of the parameters ρk are equal to one, the model is identical to joint logit; hence the possibility of balanced shifts to routes and modes is allowed by the model. The closer these parameters are to zero, the more unbalanced the shifts.
Table 5-VI shows the results of estimating the nested logit model. The parameters ρk are all around 0.15, very different from one, indicating that people shift much more readily to other transponder-route combinations than to other modes. These differences are highly statistically significant.
We now discuss the other variables in Table 5-VI. Our strategy for specifying variables is to treat each of the three choice dimensions as eliciting preferences that depend on certain traveler or trip characteristics. This is accomplished by including a dummy variable for all those choices involving a transponder (denoted —Transponder“); another dummy variable for those choices involving a toll road (denoted DT); another for all carpools (denoted HOV); and yet another just for 3-person carpools (denoted HOV3). 51 So, for example, the alternative representing a 3-person carpool traveling without a transponder on the Eastern Toll Corridor has the following values for these dummy variables: Transponder=0, DT=1, ETR=1, HOV=1, and HOV3=1. Some characteristics, such as gender, might plausibly affect choice on many of these dimensions; therefore the variable —female“ is interacted with three of these five dummies. Other characteristics, such as having children, are expected mainly to affect carpooling, so they could be interacted with either or both of the carpool-related dummies, HOV and HOV3. It turned out that only the latter had a significant effect, so it is kept in Table 5-VI.
This model captures a number of features which cannot be observed in a model of route choice only. They appear in the panels of the table labeled —variables with transponder choice“ and —variables with mode choice“. These results show that higher-income people are more likely to get a transponder. Several other factors (female, higher education, middle age, and being a commuter) also favor getting a transponder, but those results are not quite statistically significant in the weighted model. The results also show that being female, having lower education, and having a shorter trip all favor carpooling. (Since other studies have found longer trips to favor carpooling, the result here on distance probably arises because children count as carpool partners and they are more likely to be carried on shorter trips.) Forming a carpool of three or more people (HOV3+) is favored by having a child and by not being a commuter again consistent with many carpools being trips with children. If one is a commuter, HOV3+ is more likely if the employer has a carpool incentive program.
Table 5-VI. Nested Logit Model of Mode, Transponder, and Route Choice
| Variable | Unweighted | Weighted |
|---|---|---|
| Generic Variables | ||
| Time | -0.0221 (0.0039) | -0.0209 (0.0053) |
| Toll/Person | -0.0901 (0.0121) | -0.0826 (0.0246) |
| Variables with Transponder Choice | ||
| Transponder | -0.1896 (0.0594) | -0.2943 (0.1128) |
| (Income-Median Income) * Transponder | 0.0031 (0.0008) | 0.0034 (0.0011) |
| Female * Transponder | 0.0773 (0.0550) | 0.0709 (0.0420) |
| Educ * Transponder | 0.0705 (0.0481) | 0.0651 (0.0343) |
| Age30-50 * Transponder | 0.0708 (0.0471) | 0.0863 (0.0574) |
| Commute * Transponder | 0.0884 (0.0421) | 0.0895 (0.0547) |
| Variables with Route Choice | ||
| DT | 0.0512 (0.0447) | 0.1026 (0.0514) |
| (Income-Median Income) * DT | 0.0010 (0.0008) | 0.0012 (0.0007) |
| Female * DT | 0.0560 (0.0559) | 0.0884 (0.0459) |
| (Distance-Median Distance) * DT | 0.0240 (0.0320) | 0.0230 (0.0170) |
| (Distance-Median Distance)2 * DT | -0.0092 (0.0116) | -0.0098 (0.0072) |
| ETR | -0.0902 (0.0469) | -0.2293 (0.0739) |
| Variables with Mode Choice | ||
| HOV | -2.1706 (0.1960) | -2.2739 (0.2221) |
| Time | -0.0221 (0.0039) | -0.0209 (0.0053) |
| Female * HOV | 0.7980 (0.2011) | 0.8447 (0.1982) |
| Educ * HOV | -0.3779 (0.1991) | -0.4644 (0.2036) |
| (Distance-Median Distance) * HOV | -0.0990 (0.0680) | -0.2250 (0.0740) |
| HOV3 | -1.5193 (0.5330) | -1.7141 (0.6083) |
| Commute * HOV3 | -1.2126 (0.4369) | -1.0398 (0.5112) |
| Program * Commute * HOV3 | 0.5837 (0.3460) | 0.8689 (0.3778) |
| Child * HOV3 | 1.4006 (0.4033) | 1.1333 (0.4249) |
| Prof * HOV3 | 0.6283 (0.3287) | 0.5271 (0.3478) |
| Inclusive Values | ||
| Inclusive value for solo driving | 0.1560 (0.0276) | 0.1733 (0.0498) |
| Inclusive value for HOV2 | 0.1447 (0.0459) | 0.1405 (0.0432) |
| Inclusive value for HOV3 | 0.1197 (0.0490) | 0.1551 (0.0428) |
| Summary Statistics | ||
| Log-Likelihood | -1316.28 | -1185.35 |
| Pseudo R2 | 0.241 | 0.3004 |
| Implied VOT | $14.74 | $15.18 |
| # of Observations | 739 | 731 |
| Note: The numbers in parentheses are standard errors (not corrected for weighting). | ||
The parts of this combined model which are comparable to the route-choice only model appear in the panels titled —generic variables“ and —variables with route choice“. These give generally similar results once it is remembered that coefficients B in Table 5-IV should be compared to B/ρk in Table 5-VI. This is because B is divided by ρk in equation 5-3 but not in equation 5-2. In particular, the coefficients of the —generic“ variables, time and toll, are very similar in Table 5-VI (when divided by ρk ) to those in Table 5-IV. They imply a similar value of time œ $15.18/hour in the weighted nested logit model of Table 5-VI, as compared to $16.27 in the weighted model of route only in Table 5-IV (Model 3).
On the other hand, certain variables that previously were strongly predictive of choosing a toll route now are found to exert all or part of their influence more indirectly, through increasing the likelihood of getting a transponder. Since getting a transponder is a prerequisite for using 91X, these variables œ gender, education, and age œ remain closely connected with using 91X. The only variable that loses its importance entirely is language, which became insignificant and is omitted from the model of Table 5-VI for brevity. These findings suggest that getting a transponder (and the associated financial account) is a significant barrier to travelers who are male, lower-educated, younger than 30, or older than 50, especially if they are not commuters.
5.7 Simultaneous Models of Choice of Time of Day, Transponder, and Route
In a process completely analogous to that of the previous section, we can form models of choice of time of day, treated as simultaneous with the choice of transponder-route combinations. We define five time of day intervals for morning travelers, and five for afternoon travelers, as indicated by variables T1-T5 in Table 5-I. The time interval refers to the time the traveler would reach the entry to the 91 Express Lanes if he or she were to take that route. These are the same time periods for which the network model was run in order to provide the travel times facing members of the sample on the three possible routes. Intervals T2 through T4 cover the 4-hour peak period, with T3 the —peak of the peak“; while intervals T1 and T5 are the —shoulders“ of the peak. All intervals are 1 hour in duration except T2, which is 2 hours. As a result, T2 has roughly twice the choice probability as would have a one-hour interval in the early peak.
The same considerations as in the previous section lead us to estimate the nested logit model shown in Figure 5-2. The upper level represents choice among 5 times of day, while the lower level represents choice among 5 transponder-route combinations, as before. Thus there are 25 alternatives in all.
Figure 5-2
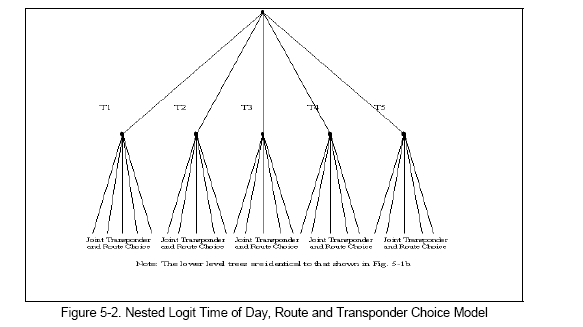
Finding appropriate sampling weights for these 25 alternatives required going beyond the random sample to get additional information, because the random sample was too small to provide reliable counts in many of the cells. We did this by using the loop detector traffic counts described earlier in the report. Details are provided in Appendix 5-A (Section 5.10).
Again, we used joint logit solely to test the efficacy of certain ways of specifying the model, some results of which are shown in the Appendix, Table 5-XIX. These tests supported the strategy of including dummy variables to represent time periods, and interacting them with characteristics likely to affect trip-scheduling considerations.
Although the list of variables in Table 5-VII seems imposing, it is based on the same strategy we have used before. It is longer mainly for two reasons: there are more time of day alternatives, and the way the utility of these alternatives varies with traveler or trip characteristics is likely to be entirely different in the morning than in the afternoon. Three new traveler characteristics are interacted with the time of day dummy variables, reflecting our judgment about what is most likely to affect scheduling. These are: a dummy denoted —Commute“ for whether this is a commute trip; a dummy denoted —Flex“ indicating flexibility of work arrival (for AM trips) or work departure (for PM trips); and a dummy denoted —Home“ for whether work at home is permitted. We reasoned that people traveling long distances would react differently to traveling during the earliest morning time interval or the latest afternoon time interval, so we allowed distance to affect the probability of those extreme times of day. We also reasoned that commuters generally would be more averse than non-commuters to the later morning times (T4 and T5) because of arriving at work late; 52 but that flexible commuters would generally be more favorable toward any of the alternatives outside the peak of the peak. These expectations are generally supported, although many of the coefficients are not statistically significant.
Table 5-VII. Nested Logit Model of Time of Day, Transponder & Route Choice (Full Sample)
| Variable | Unweighted | Weighted |
|---|---|---|
| Time | -0.0144 (0.0055) | -0.0144 (0.0035) |
| Toll/Person | -0.0548 (0.0208) | -0.0649 (0.0180) |
| Transponder | -0.1269 (0.0541) | -0.2032 (0.0545) |
| (Income-Median Income) * Transponder | 0.0020 (0.0009) | 0.0025 (0.0074) |
| Female * Transponder | 0.0488 (0.0270) | 0.0498 (0.0267) |
| Educ * Transponder | 0.0414 (0.0224) | 0.0505 (0.0276) |
| Age30-50 * Transponder | 0.0452 (0.0249) | 0.0688 (0.0187) |
| Commute * Transponder | 0.0628 (0.0331) | 0.0575 (0.0180) |
| DT | 0.0274 (0.0235) | 0.0828 (0.0305) |
| (Income-Median Income) * DT | 0.0006 (0.0003) | 0.0010 (0.0005) |
| Female * DT | 0.0413 (0.0245) | 0.0665 (0.0272) |
| (Distance-Median Distance) * DT | 0.0160 (0.0100) | 0.0110 (0.0110) |
| (Distance-Median Distance)2 * DT | -0.0006 (0.0004) | -0.0004 (0.0003) |
| ETR | -0.0647 (0.0310) | -0.1545 (0.0487) |
| am * T1 | -1.8220 (0.3291) | -1.4761 (0.3064) |
| am * T2 | 0.6415 (0.1538) | 0.4810 (0.1707) |
| am * T4 | 0.8262 (0.4573) | 0.5008 (0.6659) |
| am * Commute * T4 | -1.9207 (0.4895) | -1.8253 (0.6026) |
| am * T5 | 0.9503 (0.4430) | 0.9568 (0.6009) |
| am * Commute * T5 | -3.3220 (0.5245) | -2.8188 (0.5772) |
| pm * T1 | -0.5710 (0.3689) | -0.2512 (0.3623) |
| pm * T2 | 0.6757 (0.2400) | 0.8637 (0.2300) |
| pm * T4 | -0.9256 (0.2826) | -1.3048 (0.3621) |
| pm * T5 | -2.4782 (0.4307) | -2.5784 (0.5124) |
| am * Flex * Commute * T1 | 1.4202 (0.3983) | 1.3501 (0.3544) |
| am * Flex * Commute * T2 | 0.5436 (0.2936) | 0.5979 (0.2937) |
| am * Flex * Commute * T4 | 1.3937 (0.3710) | 1.4567 (0.3150) |
| am * Flex * Commute * T5 | 1.3551 (0.5301) | 0.9178 (0.3814) |
| pm * Flex* Commute * T1 | -0.7486 (0.3822) | -0.6919 (0.3352) |
| pm * Flex * Commute * AP | 0.5444 (0.3186) | 0.5672 (0.3511) |
| am * Home * Commute * BP | -0.4459 (0.3797) | -0.5808 (0.3331) |
| am * Home * Commute * AP | 0.9733 (0.4097) | 1.0350 (0.3009) |
| pm * Home * Commute * BP | 0.6659 (0.3606) | 0.4814 (0.3449) |
| pm * Home * Commute * T5 | 1.1860 (0.6100) | 0.9009 (0.6314) |
| am * (Distance-Median Distance) * T1 | 0.4320 (0.1040) | 0.3720 (0.0970) |
| pm * (Distance-Median Distance) * T5 | -0.0220 (0.1820) | -0.0540 (0.2400) |
| pm * Child * Bp | -0.5322 (0.2594) | -0.5873 (0.2505) |
| am * Prof * Bp | -0.3978 (0.2489) | -0.3172 (0.2627) |
| Inclusive value | 0.0949 (0.0371) | 0.1199 (0.0355) |
| Summary Statistics | ||
| Log-Likelihood | -1779.22 | -1691.90 |
| Pseudo R2 | 0.1502 | 0.1598 |
| Implied VOT | $15.77 | $13.31 |
| # of observations | 732 | 732 |
| Note: Standard errors for tabulated parameters are in parentheses (not corrected for weighting) | ||
The implied value of time in Table 5-VII œ $13.31 per hour in the weighted model œ is somewhat lower than in the other models.
Given the complexity of these models, and the diminishing statistical significance of coefficients as we add more alternatives and variables, we did not think it likely that we could successfully model time of day and mode simultaneously. Nor does it appear that doing so would tell us much that is new, because each of these decisions seems to be quite distinct from the decision of whether to get a transponder and what route to take.
5.8 Mode and Time of Day Responses to Toll Changes
Just as in the initial route choice model, we use sample enumeration with the more complex models to measure the responses to change in tolls. We use the weighted model of Table 5-VI to investigate response in mode shifting, and the weighted model of Table 5-VII to investigate response in time of day shifting. In each case, the calculation also produces additional estimates of route shifts, which can be compared to those of Table 5-V.
To investigate mode shifts, we consider the effects of raising all the tolls on the 91 Express Lanes by a given percentage œ the same set of toll changes we considered earlier in Table 5-V. Table 5-VIII shows the results for total traffic for each of the three modes, while Table 5-IX shows the results for total traffic on each of the three routes. As before, the point elasticities are approximated by dividing the percentage response to a 10% toll increase by
10.
Table 5-VIII. Estimated Mode Response to Increase in All Tolls on 91 Express Lanes: Using Model of Mode, Transponder, and Route Choice
| % change in 6-hour vehicle volumes for: | 10% increase in tolls | 50% increase in tolls | 100% increase in tolls |
|---|---|---|---|
| Morning westbound: | |||
| SOV vehicles | -0.09 | -0.4 | -0.7 |
| HOV2 vehicles | 0.26 | 1.1 | 1.9 |
| HOV3+ vehicles | 0.55 | 2.47 | 4.39 |
| Total vehicles | -0.05 | -0.2 | -0.35 |
| Afternoon eastbound: | |||
| SOV vehicles | -0.11 | -0.47 | -0.77 |
| HOV2 vehicles | 0.34 | 1.37 | 2.18 |
| HOV3+ vehicles | 0.8 | 3.54 | 6.09 |
| Total vehicles | -0.06 | -0.24 | -0.4 |
| Note: Approximate point elasticities are obtained by dividing the numbers in the left column by 10. | |||
As expected from the small inclusive value coefficient in the nested logit model, the mode shifts are quite small. Using the last column of Table 5-VIII, we see that doubling all the tolls on 91X causes just 0.7% of all SOV vehicles to switch to other modes in the morning. This in turn increases the numbers of HOV2 and HOV3+ vehicles by 1.9% and 4.4%, respectively. The net result is only a 0.35% reduction in total vehicles. Responsiveness in the afternoon is slightly greater. Using the first column, the elasticity of SOV vehicle use over the 6-hour period with respect to 91X tolls is 0.005 in the morning and 0.006 in the afternoon.
These calculations understate the true effects of a toll increase on vehicle demand because they do not include trip generation. Some trips would not shift at all, but would just not be taken if the price were raised. Still, previous studies show that such an effect is rather small.
Table 5-IX. Estimated Route Response to Increase in All Tolls on 91 Express Lanes: Using Model of Mode, Transponder, and Route Choice
| % change in 6-hour vehicle volumes for: | 10% increase in tolls | 50% increase in tolls | 100% increase in tolls |
|---|---|---|---|
| Morning: | |||
| 91X | -7.36 | -31.96 | -53.09 |
| ETR | 2.12 | 9.09 | 14.9 |
| 91F | 2.22 | 9.65 | 16.02 |
| Total SR91 | -0.21 | -0.9 | -0.35 |
| Afternoon: | |||
| 91X | -7.95 | -35.27 | -58.96 |
| ETR | 3.53 | 15.59 | 25.97 |
| 91F | 3.36 | 14.91 | 24.93 |
| Total SR91 | -0.21 | -0.92 | -1.54 |
| Total all three routes | -0.06 | -0.24 | -0.4 |
| Note: Approximate point elasticities are obtained by dividing the numbers in the left column by 10. | |||
Table 5-IX shows that the route shifts implied by this model are about the same as those in Table 5-V from the route-only model. The elasticity of total traffic on 91X with respect to the toll on that route is between 0.7 and 0.8. The rows labeled "total SR91" show that nearly all of this shift is to 91F, because the effect on total SR91 traffic (i.e. 91X and 91F combined) is very small. The rows labeled "total all three routes" just repeat the information on total vehicles in Table 5-VIII.
Because these results are so dependent on the estimated coefficients of inclusive value, it's worth taking a closer look at those coefficient estimates (ρk) in Table 5-VI. Each of them has a standard error approximately one-third as large as the coefficient itself. This means that there is roughly a five percent chance that ρk is as much as two-thirds smaller or larger than the value shown. The strengths of the mode responses to toll changes, relative to route responses, are approximately proportional to this coefficient. Therefore the uncertainty in these responses is probably on the order of plus or minus two-thirds. 53 Even so, it seems unlikely they are substantial. It appears that the opportunities for route shifting in response to a toll change are so attractive that the size of the toll makes little difference to the amount of carpooling.
We should point out again that we are holding travel times constant, which would not be the case in an actual field trial of raising tolls. As noted earlier, raising the tolls on 91X would result in more congestion on 91F. This would moderate the predicted route shifts, but would probably have little effect on mode because the increased congestion would affect solo and carpool vehicles equally.
We carried out a similar analysis of time of day shifts, using the weighted nested logit model of Table 5-VII. In this case, we considered just a one-hour toll increase on 91X, in the "peak of the peak" œ that is, 7-8 a.m. or 5-6 p.m. œ because we expected this to maximize the extent of time of day shifting.
To aid interpretation, we first show, in Table 5-X, the distribution of vehicles across time intervals that is predicted with the toll schedule in place in July 1999. To elaborate, this is the result of two steps. First, we use equation 5-354 to predict the probabilities Pijk that individual i of our sample would choose transponder-route combination j and time interval k. Second, we add over individuals in our sample, applying the same weight wi to individual i as was used in estimation, and dividing by car occupancy. (In this case car occupancy, denoted below by Oi, is either 1, 2, or 3 depending on the mode actually reported as being used by individual i.) Thus we can summarize this calculation as:
![]()
where Sjk is the share of vehicles predicted to travel by the jth combination of transponder and route and the kth time of day interval. These shares are shown in Table 5-X. (Recall that interval T2 is twice as long as the other intervals, so has a larger share of vehicles.) For 91F, the distribution in Table 5-X is very similar to the random-sample counts shown in Table 5-XVI, suggesting that our weighting scheme is accurate across times of day. For 91X and ETR, however, the distribution does not closely match the observed traffic data from Table 5-XVI, which probably is due to the small sample sizes used for computing time of day- specific weights for people choosing these two routes.
The process just described is then repeated after raising the toll during the "peak-of-the-peak". We record the changes in vehicle shares for each combination of mode, transponder, and route. Results from this exercise are described in Table 5-XI. The upper panel aggregates the changes in shares across all transponder-route combinations, in order to see the extent of time of day shifting. The lower panel shows the detailed results for one particularly important transponder-route combination: traveling on 91X with a transponder. (Recall that one cannot travel legally on 91X without a transponder.)
We see that the time of day shifts are very small. Increasing the "peak-of-the-peak" tolls by 10% results in overall shifts out of those time periods of just 0.50% in the morning and 0.74% in the afternoon (upper panel, rows 3 and 10). The reason is the same as that for mode shifts: the inclusive value coefficient in Table 5-VII is much less than one. Thus, it appears that people are much more prone to change routes than times of day, in response to increases in the toll.
We also see, from the lower panel, that these route shifts are very time of day specific. The hypothesized 10% increase in peak-of-the-peak toll reduces traffic on 91X during that time period by 9.75% in the morning and 9.25% in the afternoon. This is mainly due to route shifts, which are sufficient to reduce total 91X traffic by 1.53% in the morning and 2.45% in the afternoon. Thus, fine-tuning the toll schedule is a powerful method of regulating traffic on 91X. Indeed, one can easily use the toll schedule to maintain hourly traffic volumes on the express lanes at any desired level, and hence to maintain control over the amount of congestion there.
This is what the private operator has claimed to be doing in its many adjustments to the toll schedule over the years.
Table 5-X. Predicted Distribution of Traffic Volumes Across Times of Day, by Route: Using Model of Time of Day , Transponder, and Route Choice
| T1 | T2a | T3 | T4 | T5 | All times | |
|---|---|---|---|---|---|---|
| Morning: | ||||||
| 91X | 0.1793 | 0.4080 | 0.1688 | 0.1255 | 0.1185 | 0.2476 |
| ETR | 0.0467 | 0.3103 | 0.3650 | 0.1928 | 0.0853 | 0.0710 |
| 91F | 0.1536 | 0.4034 | 0.2018 | 0.1271 | 0.1142 | 0.6813 |
| All routes | 0.1523 | 0.3979 | 0.2052 | 0.1313 | 0.1132 | 1.0000 |
| Afternoon: | ||||||
| 91X | 0.1022 | 0.4850 | 0.2834 | 0.0839 | 0.0456 | 0.2731 |
| ETR | 0.0839 | 0.5325 | 0.2286 | 0.1205 | 0.0344 | 0.0406 |
| 91F | 0.2104 | 0.4204 | 0.2016 | 0.1183 | 0.0493 | 0.6863 |
| All routes | 0.1757 | 0.4426 | 0.2250 | 0.1090 | 0.0477 | 1.0000 |
| a This interval is of two hours duration; all the others are one hour. | ||||||
Table 5-XI. Estimated Time of Day Response to Peak Single-Hour Toll Increase on 91 Express Lanes: Using Model of Time of Day, Transponder, and Route Choice
| 10% increase in "peak-of-peak" toll | 50% increase in "peak-of-peak" toll | 100% increase in "peak-of-peak" toll | |
|---|---|---|---|
| % change of total vehicle volumes for: | |||
| Morning westbound: | |||
| 4-5 a.m. | 0.12 | 0.54 | 0.97 |
| 5-7 a.m. | 0.14 | 0.64 | 1.16 |
| 7-8 a.m. | -0.5 | -2.26 | -4.05 |
| 8-9 a.m. | 0.12 | 0.52 | 0.93 |
| 9-10 a.m. | 0.11 | 0.5 | 0.89 |
| peak period (5-9 a.m.) | -0.04 | -0.19 | -0.34 |
| morning period (4-10 a.m.) | 0 | 0 | 0 |
| Afternoon eastbound: | |||
| 2-3 p.m. | 0.21 | 0.92 | 1.6 |
| 3-5 p.m. | 0.21 | 0.93 | 1.61 |
| 5-6 p.m. | -0.74 | -3.25 | -5.62 |
| 6-7 p.m. | 0.23 | 1 | 1.73 |
| 7-8 p.m. | 0.22 | 0.98 | 1.69 |
| peak period (3-7 p.m.) | -0.06 | -0.24 | -0.47 |
| afternoon period (2-8 p.m.) | 0 | 0 | 0 |
| % change of 91X vehicle volumes for: | |||
| Morning westbound: | |||
| 4-5 a.m. | 0.13 | 0.57 | 1.01 |
| 5-7 a.m. | 0.15 | 0.67 | 1.18 |
| 7-8 a.m. | -9.75 | -39.25 | -60.16 |
| 8-9 a.m. | 0.12 | 0.54 | 0.94 |
| 9-10 a.m. | 0.12 | 0.54 | 0.96 |
| peak period (5-9 a.m.) | -2.23 | -6.18 | -13.6 |
| morning period (4-10 a.m.) | -1.53 | -4.61 | -9.26 |
| Afternoon eastbound: | |||
| 2-3 p.m. | 0.21 | 1.02 | 1.74 |
| 3-5 p.m. | 0.23 | 1.02 | 1.75 |
| 5-6 p.m. | -9.25 | -39.56 | -63.38 |
| 6-7 p.m. | 0.25 | 1.11 | 1.89 |
| 7-8 p.m. | 0.25 | 1.09 | 1.86 |
| peak period (3-7 p.m.) | -2.92 | -8.16 | -19.89 |
| afternoon period (2-8 p.m.) | -2.45 | -7.19 | -16.69 |
| Note: Approximate point elasticities are obtained by dividing the numbers in the left column by 10. | |||
In the case of time of day shifts, it is especially important to remember that we are simulating just the demand side, and not accounting for the feedback this would have on congestion levels and hence travel times. The route shifts to the free lanes (91F) that underlie the figures in Table 5-XI would change the time pattern of congestion there in a direction that would dampen the shifts. In order to estimate such effects, we would need to add a "supply model" which predicts congestion levels as a function of traffic volumes. Because our demand models are sensitive to travel times as well as tolls, the same sample enumeration procedures used here would be well suited to answer these broader questions of how the entire system would adjust to toll changes. It would also be entirely feasible to simulate the effects of some changes that are currently under discussion, including public ownership of the road (presumably with a different toll policy), or eliminating tolls entirely and turning the express lanes into either pure HOV lanes or general-purpose lanes.
Table 5-XII portrays the effects on route choice of another type of toll change: namely, increasing the toll during all time periods, just like in Table 5-V. Again we use the weighted nested logit model of Table 5-VII. The similarity between these results and those of Table 5-V for traffic on 91X confirms that the route-choice components of the two models are similar. We also show the effects on the ETR and 91F, as well as on the 91X and 91F combined; they are quite similar to the shifts calculated earlier (Table 5-IX) from the model that includes mode choice instead of time of day choice. Note, however, that the time of day model, unlike the mode model, forces the total number of vehicles to be unchanged by a toll increase.
Table 5-XII. Estimated Route Response to Increase in All Tolls on 91 Express Lanes Using Model of Time of Day, Transponder, and Route Choice
| % change of 6-hour vehicle volumes: | 10% increase in toll on 91X | 50% increase in toll on 91X | 100% increase in toll on 91X |
|---|---|---|---|
| Morning: | |||
| 91X | -7.57 | -32.51 | -53.22 |
| ETR | 2.37 | 10.04 | 16.19 |
| 91F | 2.5 | 10.77 | 17.66 |
| Total SR91 | -0.18 | -0.77 | -1.24 |
| Total all three routes | 0 | 0 | 0 |
| Afternoon: | |||
| 91X | -8.94 | -38.42 | -61.92 |
| ETR | 3.56 | 15.31 | 24.83 |
| 91F | 3.35 | 14.38 | 23.17 |
| Total SR91 | -0.15 | -0.65 | -1.05 |
| Total all three routes | 0 | 0 | 0 |
| Note: Approximate point elasticities are obtained by dividing the numbers in the left column by 10. | |||
5.9 Conclusion
The demand models have proven to be quite robust. Parameters are stable across different ways of specifying variables; coefficients are plausible and many are estimated with good precision; and several kinds of travel decisions can be combined successfully into an integrated framework. Much of this success is due to the resources that were put into obtaining a high-quality data set. We observed many travelers, they seem to have understood the survey questions, and we spent considerable effort to obtain reliable measures of the travel times and tolls they faced. For these reasons, we have avoided many of the perception biases and measurement errors that plague attempts to estimate models of travel behavior.
The models give good estimates of the effects of travel time and toll. The estimated coefficients of these two variables are highly significant in a statistical sense and quite consistent across models. There is some evidence that income and other factors affect the tradeoff between time and money, but they seem even more strongly to affect toll-road use per se, either directly or through the choice of whether to obtain a transponder. For this reason, our preferred models all estimate a single value of time per person, of approximately $13-$16 per hour. In interpreting this value, two factors should be kept in mind. First, most of the relevant time savings considered here are for time in highly congested conditions, which is known to have higher value than uncongested time. Second, we have no independent measure of reliability; therefore, as in most studies, our estimates of value of time include some portion that is really an aversion to uncertainty.
Certain traveler or trip characteristics increase the willingness of commuters to use a toll road. One of the strongest is being female, a finding that confirms earlier studies on the California value-pricing projects. Several other factors -- high income, middle age, higher education, and travel to or from work -- appear to affect toll-road use more indirectly, by favoring a willingness to acquire an electronic transponder. This finding has implications for the kind of marketing that would be most effective in increasing use of toll roads: namely, by finding ways to make it as easy and attractive as possible for people who lack these characteristics to overcome their resistance to getting a transponder. These results are not definitive -- there is enough statistical uncertainty to suggest that resistance to toll-road use may involve a complex of factors.
The price-elasticity for use of the 91 Express Lanes during the 6-hour period of heaviest use (morning westbound or afternoon eastbound) is consistently estimated at about 0.7 to 0.8. This represents the response to uniform percentage toll changes. For more targeted toll increases -- during just the one-hour "peak of the peak" -- the price-elasticity of use is between
0.9 and 1.0. These results demonstrate that there is plenty of scope for adjusting a toll schedule, even in as small as one-hour increments, in order to regulate traffic levels to a desired amount. In this respect, the models confirm the reported ability of the operators of both value-pricing experiments in California to fine-tune tolls in order to keep the express lanes busy while maintaining conditions of very low congestion.
Finally, we find that shifts to different vehicle occupancies or times of day in response to toll changes are very small. This is probably because of the existence of the option to change routes. As long as the unpriced lanes are available, there is less need for the traveler to consider options that require more drastic changes in behavior. Thus, it is quite possible that pricing demonstrations in which there is a free road parallel to the priced road do not capture the full range of behavioral responses that would be set in motion by a more across-the-board program of congestion pricing.
5.10 Methodology Appendix 5-A: Description of the WESMLE, Sampling Weights, and Joint Logit Models
The Weighted Exogeneous Sample Maximum Likelihood Estimator (WESMLE) maximizes the weighted likelihood function:

where N is the sample size, Ji is the number of alternatives available to sample member i, yij is the dependent variable (1 if individual i chose alternative j and 0 otherwise), and wi is
the weight applying to individual i. This weight is the ratio of the population share of people making the same choice as individual i to the share of that choice in the choice-based subsample. In most cases, we assume that the Random Dial sub-sample in the data set is in fact random, so that the share of the Random Dial sub-sample choosing an alternative is a good measure of the population share. In order to account for the possibility that females are over-sampled in the Random Dial sub-sample, we calculate weights for males and females separately. The resulting shares and weights are presented in Table 5-XIII.
The asymptotic covariance of the WESMLE is given by
![]()
where:

Bˆ here is the maximum likelihood estimate for B . If the sample is random so that wij =1,
Ψ should be approximately the same as Λ , due to the asymptotic equivalence of the Hessian (equation 5-6 ′ ) and the expected cross product of the gradient, which is approximated by equation 5-6 ′′ .
Table 5-XIII. Population Shares and Choice-Based Sampling Weights
| Route Share | Weight | |||
|---|---|---|---|---|
| Male | Female | Male | Female | |
| 1. Random Sample | ||||
| 91 Express Lane | 0.229 | 0.397 | 1.0 | 1.0 |
| 91 Free Lane | 0.693 | 0.539 | 1.0 | 1.0 |
| ETR | 0.078 | 0.064 | 1.0 | 1.0 |
| 2. New Plates Sample | ||||
| 91 Express Lane | 0.259 | 0.352 | 0.884 | 1.128 |
| 91 Free Lane | 0.633 | 0.591 | 1.095 | 0.912 |
| ETR | 0.109 | 0.057 | 0.716 | 1.123 |
| 3. UCI Sample | ||||
| 91 Express Lane | 0.444 | 0.429 | 0.516 | 0.925 |
| 91 Free Lane | 0.556 | 0.286 | 1.246 | 1.885 |
| ETR | 0 | 0.285 | NA | 0.225 |
| 4. Repeat Sample | ||||
| 91 Express Lane | 0.273 | 0.222 | 0.839 | 1.788 |
| 91 Free Lane | 0.682 | 0.639 | 1.016 | 0.844 |
| ETR | 0.046 | 0.137 | 1.696 | 0.46 |
For simultaneous models involving mode choice, we have 15 alternatives. This time we do not distinguish genders, but we do account for the fact that the sampling scheme may differ from morning to afternoon. Table 5-XIV gives the weights for the three non-random subsamples for people choosing each of the 15 alternatives. This same information is summarized in a more aggregate form in Table 5-XV, which aggregates choice shares across the three choice dimensions (transponder, route, and mode).
For example, Table 5-XV shows that people with transponders were oversampled in the —UCI“ subsample by (0.8824/0.5023 œ 1)= 76% in the morning, and by (0.6923/0.5116 - 1)= 35% in the afternoon. Hence, people in that subsample choosing alternatives involving transponder use (there are 9 such alternatives) are given a weight considerably less than one. This can be verified in Table 5-XIV. Because the UCI subsample is small, there are several alternatives with zero counts œ in fact, no HOV3+ people occurred in this subsample œ so for those alternatives, no weight can be computed nor is any needed.
Table 5-XIV. Detailed Choice Weights for Models of Mode, Route & Transponder Choice
| New Plates Sample | Repeat Sample | UCI Sample | |
|---|---|---|---|
| Morning | |||
| 91X_solo_transponder | 1.3836 | 1.272 | 1.081 |
| ETR_solo_transponder | 1.3391 | 0.5546 | 0.7857 |
| 91f_solo_transponder | 0.6355 | 0.501 | 0.365 |
| 91X_hov2_transponder | 1.1199 | 0.91 | 0.3439 |
| ETR_hov2_transponder | 0.2929 | 0.1737 | NA |
| 91f_hov2_transpponder | 0.2733 | 0.1347 | 0.3435 |
| 91X_hov3_transponder | 0.939 | 0.462 | NA |
| ETR_hov3_transponder | 0 | NA | NA |
| 91f_hov3_transponder | 0.3919 | 0.3483 | NA |
| ETR_solo_nontransponder | 0.5878 | 0.521 | NA |
| 91f_solo_nontransponder | 1.4278 | 3.1945 | 3.1701 |
| ETR_hov2_nontransponder | 0 | NA | NA |
| 91f_hov2_nontransponder | 1.2986 | 5.3653 | NA |
| ETR_hov3_nontransponder | 0 | NA | NA |
| 91f_hov3_nontransponder | 0.939 | NA | NA |
| Afternoon | |||
| 91X_solo_transponder | 1.1283 | 1.2084 | 1.2406 |
| ETR_solo_transponder | 0.6979 | NA | 0.6008 |
| 91f_solo_transponder | 0.8177 | 0.571 | 0.9772 |
| 91X_hov2_transponder | 0.6349 | 0.7693 | 0.1973 |
| ETR_hov2_transponder | NA | 0.1103 | NA |
| 91f_hov2_transpponder | 0.6871 | 0.384 | NA |
| 91X_hov3_transponder | 0.5238 | NA | NA |
| ETR_hov3_transponder | 0 | NA | NA |
| 91f_hov3_transponder | 0.7891 | 0.4411 | NA |
| ETR_solo_nontransponder | 0.3937 | NA | NA |
| 91f_solo_nontransponder | 1.2073 | 1.0897 | 1.2116 |
| ETR_hov2_nontransponder | NA | NA | NA |
| 91f_hov2_nontransponder | 1.7398 | 3.4068 | NA |
| ETR_hov3_nontransponder | NA | NA | NA |
| 91f_hov3_nontransponder | NA | 0.8783 | NA |
| Note: NA=non-applicable (because the sample count in that category was zero) | |||
Table 5-XV. Summary of Choice Shares: Models of Mode, Route & Transponder Choicea
| Randomb | New Plates | Repeat | UCI | |||||
|---|---|---|---|---|---|---|---|---|
| AM | PM | AM | PM | AM | PM | AM | PM | |
| 1. Pass Choice | ||||||||
| Transponder | 0.5023 | 0.5116 | 0.6108 | 0.6176 | 0.8500 | 0.6053 | 0.8824 | 0.6923 |
| Non-transponder | 0.4977 | 0.4884 | 0.3892 | 0.3824 | 0.1500 | 0.3947 | 0.1176 | 0.3077 |
| 2. Route Choice | ||||||||
| 91X | 0.2673 | 0.2937 | 0.2167 | 0.3088 | 0.2667 | 0.2368 | 0.3529 | 0.4615 |
| ETR | 0.0645 | 0.0476 | 0.0887 | 0.1029 | 0.1167 | 0.0263 | 0.0588 | 0.0769 |
| 91F | 0.6682 | 0.6825 | 0.6946 | 0.5882 | 0.6167 | 0.7368 | 0.5882 | 0.4615 |
| 3. Mode Choice | ||||||||
| SOV | 0.7742 | 0.7597 | 0.6847 | 0.7500 | 0.6667 | 0.7632 | 0.7647 | 0.6923 |
| HOV2 | 0.1659 | 0.1860 | 0.2217 | 0.1765 | 0.2500 | 0.1842 | 0.2353 | 0.3077 |
| HOV3+ | 0.0599 | 0.0543 | 0.0936 | 0.0735 | 0.0833 | 0.0526 | 0.0000 | 0.0000 |
| a These are aggregations of the choice shares actually used to form weights, which are
shown in Table 5-XIV. b Because morning and afternoon shares in this sample are similar, they are averaged before computing the sampling weights used in estimation. |
||||||||
In the models that include time of day choice, there are 25 alternatives: 5 times of day, each with 5 combinations of transponder and route. With so much disaggregation, even the random sample had very few people choosing some alternatives. We therefore sought a more reliable source for estimating the population shares of people choosing 91X or ETR at various times of day. (For 91F, the cell counts were large enough to be reliable.) We found such a source in the traffic estimates from loop detectors (in Figure 2-8, Figure 2-9, Figure 2-29 and Figure 2-30). Loop detectors, of course, cannot detect the presence of transponders. We therefore measure the distribution across times of day (for these two routes) using the loop traffic estimates, and the distribution across transponder categories using the random sample. They are shown in Table 5-XVI. These two distributions are then combined assuming they are independent of each other. The resulting population shares are shown in Table 5-XVI; weights are then computed as before by comparing each of these shares with the corresponding share observed in a given non-random subsample. (Weights for the random sample are all set to one.) The information is summarized in a more aggregate form in Table 5-XVII.
Table 5-XVIII and Table 5-XIX present the joint-logit models corresponding to the nested logit models of Table 5-VI and Table 5-VII.
Table 5-XVI. Summary of Choice Shares by Time of Day: Used in Forming Weights for Model with Time of Day Choicea
| Random Sample (or Observed Countsb | New Plates Sample | |||
|---|---|---|---|---|
| Morning | Afternoon | Morning | Afternoon | |
| 91Xb | ||||
| T1 | 0.0643 | 0.1068 | 0.0476 | 0.0976 |
| T2 | 0.3524 | 0.4462 | 0.4762 | 0.3902 |
| T3 | 0.2233 | 0.2148 | 0.2143 | 0.2927 |
| T4 | 0.2121 | 0.1325 | 0.1667 | 0.1463 |
| T5 | 0.1519 | 0.0997 | 0.0952 | 0.0732 |
| ETRc | ||||
| T1 | 0.0712 | 0.1924 | 0.0556 | 0.0714 |
| T2 | 0.4635 | 0.4938 | 0.4444 | 0.4286 |
| T3 | 0.2415 | 0.1740 | 0.2778 | 0.0714 |
| T4 | 0.1373 | 0.0889 | 0.1667 | 0.3571 |
| T5 | 0.0865 | 0.0509 | 0.0556 | 0.0714 |
| 91Fc | ||||
| T1 | 0.1586 | 0.1861 | 0.1348 | 0.1266 |
| T2 | 0.4069 | 0.4302 | 0.4752 | 0.4177 |
| T3 | 0.2069 | 0.2209 | 0.1915 | 0.1772 |
| T4 | 0.1103 | 0.1047 | 0.1489 | 0.2278 |
| T5 | 0.1172 | 0.0581 | 0.0496 | 0.0506 |
| a For convenience, we do not show the Repeat and UCI sample,
which are much smaller than the New Plates Sample. b The figures shown for 91F are random-sample counts. c The figures shown for 91X and ETR are observed traffic volumes, based on loop detector data from July 1999. |
||||
Table 5-XVII. Detailed Population Shares for Models of Time of Day, Transponder, and Route Choicea
| Morning | Afternoon | |
|---|---|---|
| 91X_T1_Transponder | 0.0177 | 0.0293 |
| ETR_T1_Transponder | 0.0035 | 0.0094 |
| 91F_T1_Transponder | 0.0289 | 0.0339 |
| 91X_T2_Transponder | 0.0968 | 0.1225 |
| ETR_T2_Transponder | 0.0228 | 0.0242 |
| 91F_T2_Transponder | 0.0741 | 0.0783 |
| 91X_T3_Transponder | 0.0613 | 0.059 |
| ETR_T3_Transponder | 0.0119 | 0.0085 |
| 91F_T3_Transponder | 0.0377 | 0.0402 |
| 91X_T4_Transponder | 0.0582 | 0.0364 |
| ETR_T4_Transponder | 0.0067 | 0.0044 |
| 91F_T4_Transponder | 0.0201 | 0.0191 |
| 91X_T5_Transponder | 0.0417 | 0.0274 |
| ETR_T5_Transponder | 0.0042 | 0.0025 |
| 91F_T5_Transponder | 0.0213 | 0.0106 |
| ETR_T1_Notransponder | 0.0006 | 0.0017 |
| 91F_T1_Notransponder | 0.077 | 0.0904 |
| ETR_T2_Notransponder | 0.0031 | 0.0043 |
| 91F_T2_Notransponder | 0.1975 | 0.2089 |
| ETR_T3_Notransponder | 0.0019 | 0.0015 |
| 91F_T3_Notransponder | 0.1004 | 0.1072 |
| ETR_T4_Notransponder | 0.0018 | 0.0008 |
| 91F_T4_Notransponder | 0.0536 | 0.0508 |
| ETR_T5_Notransponder | 0.0013 | 0.0004 |
| 91F_T5_Notransponder | 0.0569 | 0.0282 |
| a These are the assumed population shares for all the alternatives, which were aggregated in Table 5-V, first two rows. For 91F, all observations are taken from the random sample. For 91X and ETR, the distribution across time of day is from traffic counts (as in Table 5-V), but the distribution across transponder and route choices is from the random sample. These two distributions are assumed to be independent. | ||
Table 5-XVIII. Joint Logit Model of Mode, Transponder, and Route Choice
| Variable | Unweighted | Weighted |
|---|---|---|
| Generic Variables | ||
| Time | -0.0706 (-0.0100) | -0.0655 (-0.0118) |
| Toll/Person | -0.3994 (-0.0769) | -0.3174 (-0.0900) |
| Variables with Transponder Choice | ||
| Transponder | -1.2539 (-0.3433) | -1.7261 (-0.3617) |
| (Income-Median Income) * Transponder | 0.0202 (-0.0032) | 0.0206 (-0.0033) |
| Female * Transponder | 0.5405 (-0.1974) | 0.4502 (-0.1911) |
| Educ * Transponder | 0.4276 (-0.1750) | 0.3651 (-0.1878) |
| Age30-50 * Transponder | 0.4766 (-0.2310) | 0.5508 (-0.2560) |
| Commute * Transponder | 0.5747 (-0.2764) | 0.4833 (-0.2949) |
| Variables with Route Choice | ||
| DT | 0.3559 (-0.2199) | 0.5398 (-0.2518) |
| (Income-Median Income) * DT | 0.0071 (-0.0031) | 0.0081 (-0.0030) |
| Female * DT | 0.3609 (-0.1948) | 0.5356 (-0.1737) |
| (Distance-Median Distance) * DT | 0.183 (-0.0940) | 0.151 (-0.0910) |
| (Distance-Median Distance)2 * DT | -0.0698 (-0.0356) | -0.0638 (-0.0370) |
| ETR | -0.5621 (-0.1727) | -1.2792 (-0.1857) |
| Variables with Mode Choice | ||
| HOV | -2.582 (-0.2045) | -2.6348 (-0.2580) |
| Female * HOV | 0.7923 (-0.1853) | 0.8348 (-0.2232) |
| Educ * HOV | -0.4223 (-0.1853) | -0.503 (-0.2297) |
| (Distance-Median Distance) * HOV | -0.156 (-0.0710) | -0.287 (-0.0760) |
| HOV3 | -1.5044 (-0.5270) | -1.6518 (-0.8914) |
| Commute * HOV3 | -1.3416 (-0.4174) | -1.1348 (-0.6002) |
| Program * Commute * HOV3 | 0.5844 (-0.3373) | 0.8611 (-0.3700) |
| Child * HOV3 | 1.4146 (-0.3988) | 1.1384 (-0.5619) |
| Prof * HOV3 | 0.5967 (-0.3111) | 0.4954 (-0.3493) |
| Summary Statistics | ||
| Log-Likelihood | -1328.12 | -1193.75 |
| Pseudo R2 | 0.2341 | 0.2954 |
| Implied VOT | $10.61 | $12.38 |
| # of Observations | 739 | 731 |
| The numbers in parentheses are standard errors, corrected in the case of the weighted model as shown in equation 5-6. | ||
Table 5-XIX. Joint Logit Model of Time of Day, Transponder, and Route Choice
| Variable | Un-Weighted (Commuters Only) |
Un-Weighted (Full Sample) |
Weighted (Full Sample) |
|---|---|---|---|
| Time | -0.0638 (0.0109) |
-0.0607 (0.0103) |
-0.0481 (0.0144) |
| Toll/Person | -0.3853 (0.0848) |
-0.3896 (0.0810) |
-0.3887 (0.0920) |
| Transponder | -0.6714 (0.2522) |
-1.3336 (0.3474) |
-1.7256 (1.4170) |
| (Income-Median Income)*Transponder | 0.0202 (0.0034) |
0.0203 (0.0032) |
0.0203 (0.0033) |
| Female*Transponder | 0.4215 (0.2076) |
0.5262 (0.1983) |
0.4361 (0.3101) |
| Educ*Transponder | 0.5241 (0.2076) |
0.4201 (0.1753) |
0.4052 (0.2224) |
| Age30-50*Transponder | 0.4753 (0.2482) |
0.4978 (0.2331) |
0.5785 (0.5494) |
| Commute*Transponder | 0.6449 (0.2798) |
0.4952 (0.9258) |
|
| DT | 0.3567 (0.2401) |
0.3828 (0.2294) |
0.7416 (0.2572) |
| (Income-Median Income)*DT | 0.0087 (0.0033) |
0.0074 (0.0031) |
0.0097 (0.0043) |
| Female*DT | 0.4008 (0.2050) |
0.3931 (0.1955) |
0.5129 (0.2240) |
| (Distance-Median Distance)*DT | 0.2350 (0.1020) |
0.1750 (0.096) |
0.095 (0.127) |
| (Distance-Median Distance)2*DT | -0.0086 (0.0039) |
-0.0066 (0.0036) |
-0.0037 (0.0046) |
| ETR | -0.5578 (0.1790) |
-0.5572 (0.1729) |
-1.1805 (0.2592) |
| am*T1 | -2.3116 (0.3330) |
-2.3637 (0.3241) |
-1.8391 (0.6368) |
| am*T2 | 0.5849 (0.1592) |
0.5660 (0.1524) |
0.4281 (0.2385) |
| am*T4 | -1.0721 (0.2727) |
0.7631 (0.4465) |
0.4484 (0.9919) |
| am*Commute*T4 | -1.8868 (0.4819) |
-1.7919 (1.1014) |
|
| am*T5 | -2.7755 (0.4064) |
0.5139 (0.4242) |
0.6619 (1.5401) |
| am*Commute*T5 | -3.3090 (0.5166) |
-2.8095 (1.4031) |
|
| pm*T1 | -1.3470 (0.4068) |
-1.1670 (0.3651) |
-0.6133 (0.6107) |
| pm*T2 | 0.5275 (0.2454) |
0.5674 (0.2304) |
0.7976 (0.4416) |
| pm*T4 | -1.2142 (0.3071) |
-1.1802 (0.2801) |
-1.4598 (0.3914) |
| pm*T5 | -3.1127 (0.4574) |
-3.0167 (0.4232) |
-2.9210 (0.5557) |
| am*Flex*Commute*T1 | 1.2964 (0.3936) |
1.4196 (0.3904) |
1.3478 (0.6707) |
| am*Flex*Commute*T2 | 0.5188 (0.2951) |
0.5376 (0.2922) |
0.5900 (0.3960) |
| am*Flex*Commute*T4 | 1.3838 (0.3736) |
1.4022 (0.3720) |
1.4590 (0.5603) |
| am*Flex*Commute*T5 | 1.3368 (0.5156) |
1.3546 (0.5141) |
0.9070 (0.6664) |
| pm*Flex*Commute*T1 | -0.6670 (0.3993) |
-0.7717 (0.3783) |
-0.6879 (0.4662) |
| pm*Flex*Commute*AP | 0.5507 (0.3333) |
0.5537 (0.3136) |
0.5810 (0.5013) |
| am*Home*Commute*BP | -0.5394 (0.3701) |
-0.5053 (0.3684) |
-0.6349 (0.7998) |
| am*Home*Commute*AP | 0.9140 (0.3992) |
0.9280 (0.3977) |
0.9926 (0.6691) |
| pm*Home*Commute*BP | 0.7142 (0.3476) |
0.6763 (0.3446) |
0.4942 (0.4072) |
| pm*Home*Commute*T5 | 1.2934 (0.6023) |
1.2409 (0.5928) |
0.9332 (0.8179) |
| am*(Distance-Median Distance)*T1 | 0.4000 (0.1090) |
0.4100 (0.1050) |
0.3530 (0.1330) |
| pm*(Distance-Median Distance)*T5 | -0.0890 (0.1860) |
-0.0820 (0.1820) |
-0.0880 (0.1910) |
| pm*Child*BP | -0.5531 (0.2685) |
-0.5416 (0.2540) |
-0.5994 (0.6054) |
| am*Prof*AP | -0.4698
(0.2695) |
-0.3961 (0.2504) |
-0.3128 (0.3069) |
| Log-Likelihood | -1628.80 | -1792.22 | -1698.03 |
| Pseudo R2 | 0.1469 | 0.1440 | 0.1568 |
| Implied VOT | $9.94 | $9.35 | $7.42 |
| # of Observation | 666 | 732 | 732 |
| Note: The numbers in parentheses are standard errors, corrected in the case of the weighted model as shown in equation 5-6. | |||
5.11 Methodology Appendix 5-B: Network Modeling and Travel Time
Estimating travel choice models usually requires the development of a network model of the pertinent study area transportation system. The network model provides consistent estimates of travel times and costs for trips reported in the calibration data set, as well as consistent time and cost estimates for the choice alternatives which were rejected by the travelers. On this basis, model parameters are able to quantify the impacts of the differences in times and costs among the travel choices made and the alternative choices not made. This permits estimation of such behavioral properties as travelers' values of time and travelers' time and cost elasticities.
In support of the travel choice modeling reported in this chapter, a network model was developed using the TP+/VIPER package of transportation planning software. Numerous variations on the basic model were needed to represent travel conditions for eleven different time periods in the day, as well as for different modes (SOV v. HOV) and toll-paying decisions (91X, ETR, or no-toll).
This section documents the process of network-building and network analysis which provided the travel time and cost data used in the choice modeling. The discussion covers the following steps of this process:
- Defining traffic analysis zones and centroids;
- Coding highway network geometry;
- Coding time-dependent link speeds;
- Calculating time and toll skim matrices.
5.11.1 Defining traffic analysis zones and centroids
The first step of the process was to identify and mark the boundaries of the model‘s traffic analysis zones. Traffic analysis zones are portions of a study area that contain approximately the same number of trips in close proximity to each other. Zones are fairly easy to choose since trip ends tend to form clusters. Zones vary in size although the rule applies that traffic zones should be as large as possible, but small enough that almost all trips of interest in the network are inter-zonal. For this work, the origin and destination locations of commute trips reported in our 1996 travel survey were marked by dots on a regional map. The extent of the region included in the model was determined on this basis. The result appears in Figure 5-3.
Traffic analysis zone boundaries were then drawn directly onto the map to enclose manageable size trip clusters. This resulted in defining 99 zones. Each zone is represented in the network by a centroid node, which is a single point where all trips to and from a zone are assumed to enter or leave the network. Each centroid was established at the center of the cluster of actual trip ends within the traffic analysis zone. Each centroid received a unique node number in the range 1 through 99.
Zone coverage of the network model extends from the Pacific Ocean on the west, between Long Beach and San Juan Capistrano, eastward to Beaumont and Hemet in Riverside County, northward roughly to Interstate 105 (the Century Freeway) in L.A. County and to Victorville in San Bernardino County, and southward to San Juan Capistrano in Orange County and Temecula in Riverside County. A correspondence table between cities and centroid numbers appears in Table 5-XX.
Figure 5-3
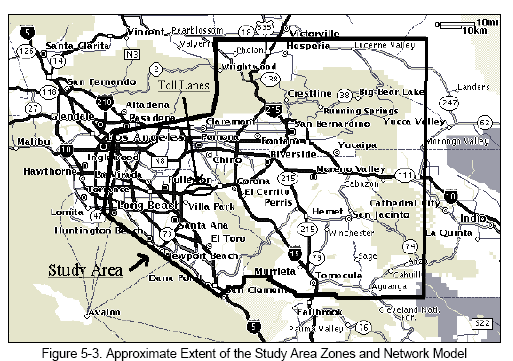
Table 5-XX. Correspondence Between Cities and Network Centroids
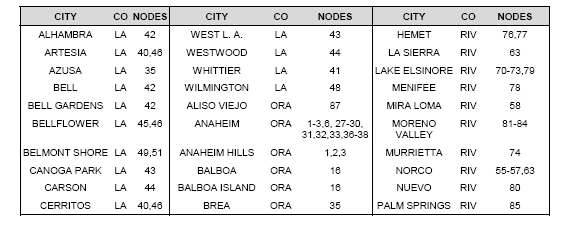
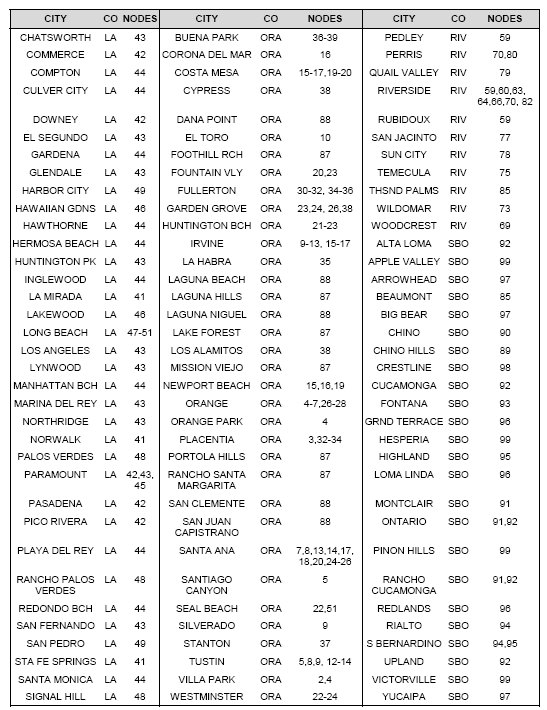

5.11.2 Coding highway network geometry
This step determined the physical features of the network model. It involved selecting which highways and local roads would be included. First, all State Highways and Interstates within the model's zone coverage area were automatically chosen. Then, local streets needed to hook up to the centroid nodes and additional local arterials needed to provide connectivity to state highways were included. Finally, if there existed likely alternate arterial routes for important centroid pairs, these arterial links were also included.
Link Data -- Lane Configurations. This part of the work involved checking two things: locations of special lane types (e.g., HOV lanes) and determining which arterials have direct connections to freeways (on-ramps and off-ramps). The first task was accomplished using Figure 5-4, obtained from the Southern California Association of Government's web page.
The second part of the exercise involved using the Thomas Brothers Guide for each county. These guides have figures in the first few pages called —Freeway Access Maps.“ These show all the freeways in the area and their on- and off-ramp locations.
Figure 5-5
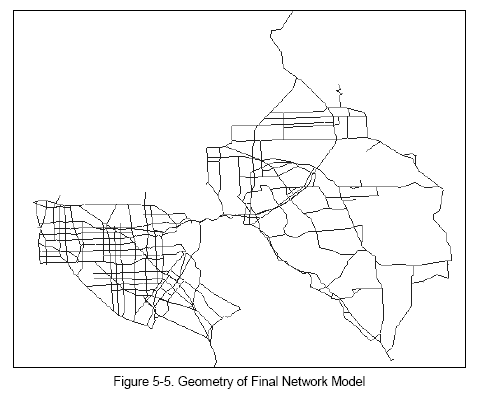
Link Data -- Overall Geometry. The geometry of selected links was determined by scanning a mosaic of maps into the Viper computer program to use as an overlay for locating links. These maps came from tracing pages of the Thomas Bros. Guides, chosen because they included not only the freeways but almost all of the arterials needed in the final model. After the individual traced maps were scanned into the computer and manipulated together like a puzzle using a paint program, the final diagramed map was saved as a bitmap image (the only type of image file that VIPER can handle).
The bitmap image file was displayed in VIPER as a background template. Using the mouse, links and nodes representing all necessary features of the network were located by tracing the features on the background. The most difficult part of this work was to ensure that all connections between highways, especially at interchanges, were represented properly by nodes. The next step was to add additional links to represent the 91X toll lanes on SR 91 and HOV lanes next to the appropriate freeway sections. These additional links were entered immediately adjacent to the regular freeway links with appropriate connections to the nodes already existing on the regular freeway section. For the 91X links, the only connections were at the extreme ends of the facility. As the final step, centroids were added as nodes in the proper places, assigned numbers 1 though 99, and properly hooked up to the actual intersection nodes on the background map.
Link Data -- Coded Attributes. After the network geometry was complete, each link had to be coded with certain attributes. For our network model, these were:
- highway/street name,
- link length (miles)
- link type,
- speeds (mph) for eleven different peak time periods (see Table 5-XXII)
VIPER automatically estimated link lengths in miles based on the X-Y coordinates of the nodes and the specified map scale. The link types coded for this model are listed in Table 5-XXI.
Table 5-XXI. Network Link Type Codes
| Link Type Description | Link Type Code |
|---|---|
| Normal freeway section - no managed lanes | 1 |
| Freeway section next to HOV lane | 2 |
| SR 91 section next to toll lanes (east of SR 241) | 3 |
| SR 91 section next to toll lanes (west of SR 241) | 4 |
| Eastern/Foothill Toll Roads (SR 241) | 5 |
| Arterial | 6 |
| Centroid Connector | 7 |
| HOV lane | 8 |
| SR 91X toll lane | 9 |
| SR 73 toll road (San Joaquin Hills Corridor) | 10 |
| Shared Fastrak/HOV lanes at 91X termini | 11 |
In addition to the above, two special versions of the base network were created to represent tolls. In one, the link variable IS91X was set to 1 for links representing the 91X toll lanes and 0 otherwise. In the other, the link variable TOLL was used to represent the toll paid on each segment of the Foothill and Eastern Toll Roads. These networks and variables were used to accumulate toll costs for paths through the networks including either of the toll facilities (as discussed further in Section 5.11.4.)
The completed network model appears in Figure 5-5.
Figure 5-5

5.11.3 Coding time-dependent link speeds
Obtaining suitable speeds to code into the network was the most labor-intensive part of the model preparation. Road conditions change frequently during the day and from week to week, and recording truly accurate speeds is impossible. Only reasonably accurate approximations to typical conditions can be established. With this in mind, the link speeds used in the network were obtained from a variety of sources.
After some deliberation, it was decided that only estimates of peak period weekday speeds would be included in the model, and that the AM and PM periods would be broken down into the eleven time intervals shown in Table 5-XXII.
Table 5-XXII. Time Periods Represented in the Network for Choice Modeling
| AM Time Periods | PM Time Periods |
|---|---|
| 4-5 AM | 2-3 PM |
| 5-7 AM | 3-4 PM |
| 7-8 AM | 4-5 PM |
| 8-9 AM | 5-6 PM |
| 9-10 AM | 6-7 PM |
| 7-8 PM |
These breakdowns were determined by the variations in delay at different peak times, and by the fact that tolls change on the hour.
Initial freeway speeds for fall, 1999, the time frame matching our travel survey data, were obtained from two sources. The first was the Freeway Performance Measurement Project website, which provides on-line loop data for many of the highways included in the model. 55 In looking at these data, however, it was found that many of the loops were not functioning or data were no longer available. In these cases, average speeds were directly monitored during peak periods for three days using the L.A. Real Time Traffic web site, which reports the speeds of all major freeways in the Los Angeles and Orange County area, updated on a constant basis.56
In the case of the SR 91 free lanes and all major highways in Riverside and San Bernardino Counties, where loops were not yet operational, the on-line speed data were supplemented by data from floating car speed runs conducted in fall, 1999, as part of the Caltrans District 8 and District 12 congestion monitoring programs. In the case of SR 91, the speed run data were compared to available loop data and, where necessary, network speeds were usually corrected to be consistent with the speed runs. In a few cases, loops speeds seemed more typical, and were used instead of the speed runs.
Representative speeds for arterials were determined by floating car runs conducted by Cal Poly staff on two days in February, 2000. Before the data were collected, it was decided that since the arterials were generally congested, the representative speeds from one pass of the vehicle would be used for all time intervals of the peak. To gather these data, each arterial to be included in the model was driven for a few miles and the time was recorded. Each distance was then divided by the driving time to obtain the average speed. Table 5-XXIII and Table 5-XXIV show the arterials included, the times and distances recorded, and the resulting speeds. In some instances, arterial speeds were not actually observed, in which case speeds were estimated by analogy to similar locations.
Table 5-XXIII. Network Speeds for Los Angeles and Orange County Arterials

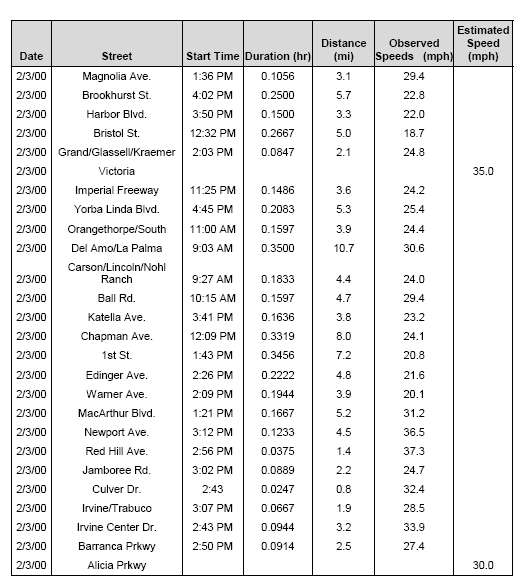
Table 5-XXIV. Network Speeds for Los Angeles and Riverside County Arterials

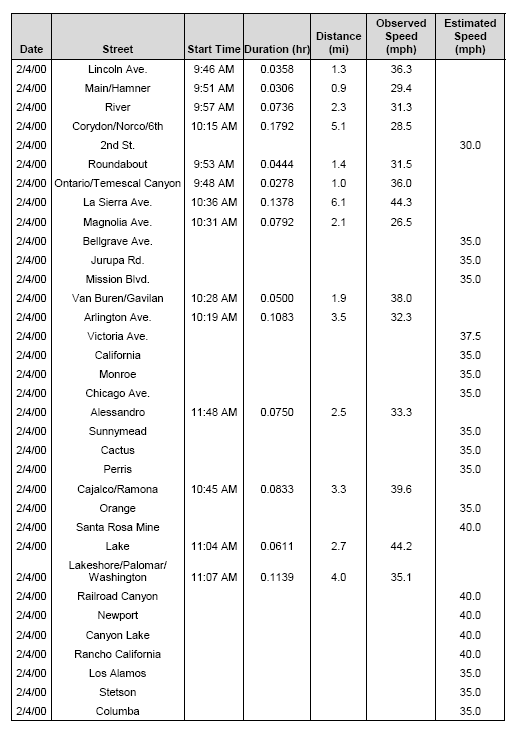

5.11.4 Calculating time and toll skim matrices
The choice modeling requires matrices containing the travel times and tolls between all combinations of origin and destination zone numbers, for all modes and for all the route choices under consideration. These matrices are often called "skims" or "skim trees" in transportation modeling work.
The necessary skim matrices were created by the TP+ software, using as input the base network containing link lengths and the speeds for eleven different time periods for which skim calculations were needed (Table 5-XXII). The steps followed in calculating each skim matrix were the following:
- Calculate the proper link impedance parameter for the temporary network variable TIME. This was usually the link length divided by whichever speed value applied to the time period of concern. In developing the distance and toll skim matrices, TIME was set equal to the link toll and the link length variables.
- Temporarily "exclude" links from the network that are not applicable to the current travel mode or route of concern. This was done by setting the corresponding link TIME to a prohibitively high value (generally 40 minutes). For example, when skims for SOV trips not using toll facilities were calculated, link types 5, 8, and 9 (see Table 5-XXI) were "excluded" in order to force the shortest paths to use non-toll, non-HOV facilities. A summary of how links were excluded to create the various skim matrices appears in Table 5-XXV.
- Run the TP+ program to calculate the shortest path origin-destination impedance matrix for trips through the modified network.
Using this procedure, 66 shortest time skim matrices were created, for all combinations of eleven time periods, three routing options (91X, ETR, and free highways), and two modes (SOV and HOV). Three additional matrices were created for the shortest distance paths, and for toll costs on routes using the 91X lanes or the ETR. Note that most HOV and toll links were coded using the uncongested freeway speed of 65 mph. An exception is the section of the ETR closest to SR 91, where a lower speed was used to reflect congested conditions at certain times of the day.
Table 5-XXV. Link Adjustments to Create Paths for Different Modes and Toll Routes
| Mode or Route Used | Network Link Adjustments |
|---|---|
| SOV | HOV links are eliminated |
| HOV | All links are available |
| 91X | ETR links are eliminated |
| ETR | 91X links are eliminated |
| No-Toll | 91X and ETR links are eliminated |
6. Collision Trends and Characteristics
6.1 Introduction
This part of the study involved two distinct activities:
- Analysis of observed accident rates and collisions characteristics as captured in the Caltrans TASAS data base, for the period between January 1994 and July 1999.57Collision data were examined for both SR 91 and SR 57, the latter used as a basis for comparison.
- Collection and review of records describing a small number of selected major incidents occurring in the section of SR 91 containing the 91X lanes, to see if there were features related to the unusual nature of this facility (over ten miles of dual high speed express lanes, separated from the adjacent freeway by painted buffer strip and plastic pylons).
The detailed review of weaving operations which was documented in our May, 1998, report was not extended by this study due to resource limitations.
The principal conclusions from this part of the study appear in the next section. Succeeding sections present the details.
6.2 What We Learned about Collision Trends and Characteristics
The following are the principal findings from this portion of the study. The location in the text containing the supporting data for each finding is indicated.
- For the Orange County section of SR 91 containing the 91X lanes, data show a reduction in fatal & injury (F&I) and total accident rates immediately after opening of the toll lanes. However, it should be noted that the observation period prior to the opening includes the period when the 91X lanes were being constructed. This condition is not usually considered in traffic safety analysis due to the typically unrepresentative traffic behavior patterns during construction. (Section 6.3, Figure 6-1 and Figure 6-2.)
- By late 1997, visual evidence suggests that accident rates on the Orange County SR 91 section had returned to near their 1995 levels, although only an increase in the weekday average F&I rate tests significant. These changes are consistent with past studies which have shown that higher accident rates usually follow increased levels of congestion. (Figure 6-1 and Figure 6-2.)
- For a two-mile section of the SR 91 freeway in Riverside County, between the terminus of the 91X lanes and SR 71, the total accident rate increased for weekdays and for peak periods in the peak direction following the opening of the 91X lanes. The F&I rate for the peak period in the peak direction also increased, but the overall weekday F&I rate did not. These changes are probably due to increased congestion in this section. Recent (1998) increases in the concentration of collisions just west of Green River Road warrant additional detailed consideration. (Figure 6-3 through Figure 6-6.)
- A longer 7.5-mile section of SR 91 in Riverside County, between the Orange County line and Interstate 15, shows a significant upward trend in total peak period, peak direction collisions throughout our entire period of observation. However, no corresponding trend exists for F&I collisions in this section. (Figure 6-8.)
- The overall pattern of accident rate changes on SR 57 for the peak period, peak direction shows no clear changes. This suggests that the peak period differences observed on SR 91 do not reflect a region wide trend. (Figure 6-9.)
- During our observation period, there were generally no systematic changes in peak period collision types in the Orange County section of SR 91 containing the 91X lanes. (Section 6.4, Figure 6-11.)
- After the 91X lanes opened, the percentages of peak period rear end collisions and vehicles reporting slowing/stopping movements increased significantly in the 2-mile section in Riverside County between the county line and SR 71. This suggests the influence of increased congestion in this section. (Figure 6-12 and Figure 6-15.)
- Overall, the available evidence suggests that the 91X facility is operating at an acceptable level of safety.
6.3 Analysis of Accident rates and Locations
With the assistance of staff at Caltrans' Sacramento Headquarters Office, collision records for selected highway sections were obtained from the Caltrans TASAS data system. The data cover a four and one half year period, January, 1995, through June, 1999. The highway sections and the total number of TASAS collision records obtained for each are:
- SR 91, in Orange County, post miles 8.0 to 18.9, from about a half-mile west of Tustin Ave, just west of the 91X terminus, to the Riverside County line, 3535 collisions.
- SR 91, Riverside County, post miles 0.0 to 7.5, from the county line, just east of the 91X terminus, to the I-15 interchange, 3137 collisions.
- A subset of the above, post miles 0.0 to 2.1, between the county line and the SR 71 interchange, 869 collisions.
- SR 57, Orange County, post miles 15.6 to 22.5, between the SR 91 interchange and the Los Angeles County line, 2895 collisions.
Quarterly accident rates were estimated by combining the collision data with the data on weekday average daily traffic (ADT) for SR 91 and SR 57, which are presented in Chapter 2. Peak period, peak direction ADTs were estimated by examining the hourly traffic distributions for SR 91 over the 1995-98 time period. It was found that 37% of average weekday traffic occurs during the hours 4-10 AM (westbound) and 2-8 PM (eastbound), and that this percentage remained essentially constant through the four year period. For convenience, it was assumed that the same peak period percentage (37%) applied to SR 57.
Probably the most arguable assumptions involved in estimating accident rates are in the ADT values used. All SR 91 ADTs are from traffic counting loops located near the Imperial Highway (SR 90) interchange at post mile 11.54.58 Those values were assumed to apply along the entire SR 91 section. Due to the lack of loop data in Riverside County, the Orange County ADT for SR 91 was also assumed to apply to the entire Riverside County section, although for the period after October 1998 the SR 91 ADT in Riverside County was taken as the sum of the Imperial Highway observations and the corresponding ETR counts. Since no SR 91 loop data were available after January, 1999, and since the data show no systematic seasonal variations in SR 91 traffic (Figure 2-22), the average ADT for the last available calendar quarter was used for the first six months of 1999.
These limitations in the available ADT values obviously introduce inaccuracies in the estimated accident rates. In particular, we note that the accident rates after October 1998 for SR 91 in Riverside County are probably systematically underestimated, since the ADT values are probably overestimated. Systematic overestimation especially applies to the rates calculated for SR 91 east of SR 71 (through Corona to I-15), since unknown volumes of traffic leave SR 91 to the SR 71 and local streets.
In addition, caution is necessary in interpreting the accident rates estimated for the Orange County SR 91 section containing the 91X lanes, for the period prior to the opening of the toll lanes in December, 1995. This observation period includes the time when the 91X lanes were being constructed. This condition is not usually considered in traffic safety analysis due to the typically unrepresentative traffic behavior patterns that occur during construction.
The total weekday accident rates and the weekday peak period, peak direction accident rates for the Orange County section of SR 91 which contains the 91X lanes are shown in Figure 6-1 and Figure 6-2.59 In both cases, separate rate trends are shown for fatal and injury collisions, and for all reported collisions.
For weekday collisions, as noted in Figure 6-1, the apparent decreases in the annual average total accident rate and in the annual average F&I rate between 1995 and 1996 are statistically significant, the total rate at the 1% level and the F&I rate at the 5% level. This is based on a test of the difference in annual rates assuming equal variance for the four and one-half year period.60
Figure 6-1
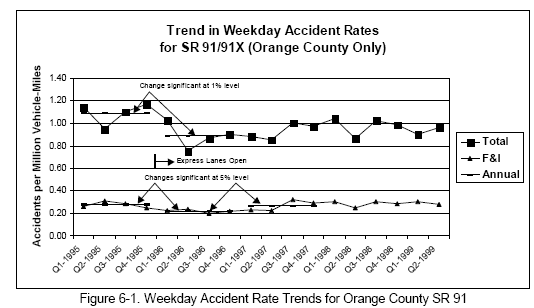
The annual average weekday F&I rate increase between 1996 and 1997, noted in Figure 6-1, is also statistically significant at the 5% level; however the apparent corresponding increase in the total accident rate is not. No other year to year differences are statistically significant, nor are the differences in annual rates statistically significant between 1995 and 1998/99.
Figure 6-2
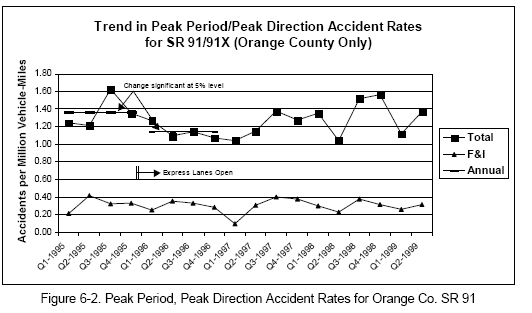
For peak period, peak direction collisions, as noted in Figure 6-2, the apparent decrease in the annual average total accident rate between 1995 and 1996 is significant at the 5% level, but not the 1% level. None of the other year-to-year comparisons test significant at the 5% level, including the visually apparent increase in the total rate between 1996 and 1998-99. A regression line fit to the trend in the total accident rate from 1996 through 1999 has a slope which is not significantly different from zero at the 5% level.61
To sum up the findings for the Orange County section of SR 91, the data show a temporary improvement in accident rates immediately after opening the 91X toll lanes. This improvement is consistent with past studies which have shown that lower accident rates usually accompany decreased congestion.62 The improvement is also consistent with the conclusion of highway construction at about the same time.
From 1996 on, there are visual indications that some of the rates have returned to near 1995 levels, as would be expected with increased congestion. However, only the increase in the overall weekday F&I rate tests significant. In particular, none of the increases in the peak period, peak direction accident rates test significant. All in all, within the restrictions of the limited loop data, there is no evidence of unusual changes in accident rates in this Orange County section due to the presence of the 91X lanes.
The corresponding accident rates for the Riverside County portion of SR 91 just east of the 91X lanes appear in Figure 6-3 and Figure 6-4. These rates were estimated for the two-mile section between the county line and SR 71. Because it is such a short section, rates are more variable. The unusually short section is used for the analysis because it coincides with an important transition weaving section between the express lanes and the HOV lanes in Riverside County. Figure 6-3 shows the trend in overall weekday accident rates while Figure 6-4 shows rates for the peak period, peak direction.
Exhibit 6-A
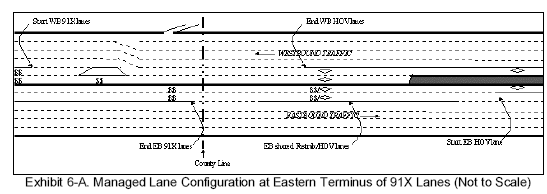
Exhibit 6-A shows the schematic layout of the transition weaving section straddling the west portion of the 2.1-mile Riverside County section and the county line. Icons shows the locations of the managed lanes ($$ - Fastrak only; ◊ - HOV only; and $$/◊managed lanes open to both Fastrak and HOV). Note that westbound weaving occurs both in Riverside and Orange Counties, while eastbound weaving occurs almost exclusively in Riverside County.63
The weekday collision data in Figure 6-3 show a significant increase at the 5% level between the average rate for total collisions in 1995 and the 1996-98 average. There are no significant changes in the F&I average rates through the entire period. The unusually high first quarter rate in 1998 causes the increase from 1997 to 1998 (1st three quarters) to test significant at the 5% level. However, the slope of a regression line fit to the total rate data for 1996-99 is not significantly different from zero at the 5% level. This suggests that, after the initial increase in the total accident rate at this location at the time the 91X lanes opened, the accident rates have remained the same.
Figure 6-3
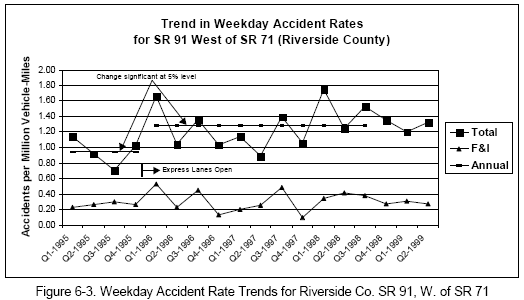
The findings for the peak period, peak direction data (Figure 6-4) from the short Riverside County section are similar to those for the weekday, but show stronger comparisons. The data show a significant increase at the 1% level between the total accident rate averaged for 1995 and the 1996-98 (through the 3rd quarter) average, with the corresponding increase in the F&I rate also significant at the 5% level. The same significance levels apply to comparisons between the 1995 and 1998 average rates. The increase between the 1995 and 1996 average rates for total collisions is significant at the 5% level, although the apparent F&I rate increase is not significant. The slope of a regression line fit to all the total rate data for 1996-99 is not significantly different from zero at the 5% level; however, a regression fit to all the data for 1995-99 has a significant positive slope at the 5% level, but an R2 of only 0.22.
Figure 6-4
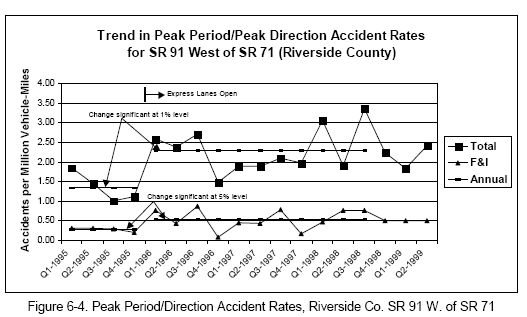
The magnitudes of the estimated peak period in the peak direction accident rates in Figure 6-4 are about twice those of the corresponding rates for the Orange County section (Figure 6-2) and for weekdays at the same location (Figure 6-3). It is possible that this difference is related in part or entirely to inaccuracies in the ADT values and in the peak period percentage value, discussed at the beginning of this section.
We see no evidence in the data that accident rates changed after the Eastern Toll Road (ETR) opened in October 1998. However, this should be interpreted with caution because, as noted previously, the ADT values used to estimate accident rates after October 1998 in Riverside County are probably overestimated. This would result in the accident rates being underestimated. Unfortunately, the amount of this probable underestimation is unknown. Furthermore, the length of the observation period (8 months) is rather short for meaningful changes in trends to become evident.
Despite the high variability in these data, related to the short section length, we conclude that the accident rates for total collisions did increase significantly in this two-mile section in Riverside County after the 91X lanes opened. The change in F&I rates is counter-intuitive, with peak period rates increasing but overall weekday rates not increasing significantly. This increase in accident rates is probably related to the increased congestion in this highway section after the 91X lanes opened.
To investigate further, the locations of collisions were plotted year-by-year to see if anything stood out which might suggest a systematic relationship. Collisions each year were clustered in half-mile segments and reported by mid-point post miles. Figure 6-5 shows the result for all weekday collisions and Figure 6-6 shows the pattern for weekday collisions in the peak period, peak direction. About 40% of weekday collisions in 1995 and about 60% of weekday collisions after 1995 occurred in the peak period, peak direction. Consequently, the patterns in the two figures are similar. They also show that considerable variability exists in the data.
Of particular interest in the location patterns is the apparently strong upwards trend in the proportion of collisions occurring in the half-mile section straddling post mile (P.M.) 0.75, which is just west of the interchange at Green River Road, a very busy access point to Corona. Statistical analysis shows that the increase between 1995 and 1996-97 is not statistically significant at the 5% level, although the increase between 1995 and 1997-98 is significant at the 5% level in the case of all weekday collisions (Figure 6-5). Although the patterns appear similar, the increases are not statistically significant for peak period collisions, probably due to the smaller number of observations. However, the increasing trend in collisions near P.M. 0.75 is of sufficient concern to warrant additional detailed investigation.
Figure 6-5
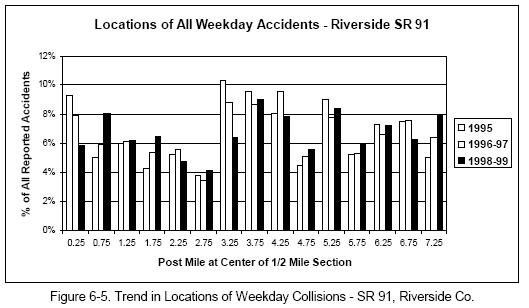
Another interesting trend appears in the half-mile section straddling P.M. 3.25, which is about midway between SR 71 and the Serfas Club Drive interchange. Why the decrease in the share of collisions in this area is almost a reverse mirror image of the increasing trend just west of Green River Rd. is unclear.
We note that the location trend for off-peak and weekend collisions, shown in Figure 6-7, contains no evidence of increasing collisions near Green River Road, P.M. 0.5-1.0, but it does show a fairly similar pattern of decreasing collisions near Serfas Club.
Figure 6-6
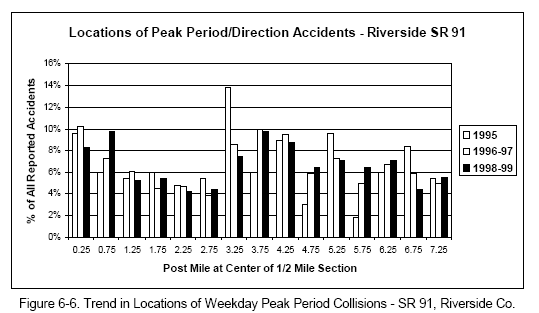
Figure 6-7
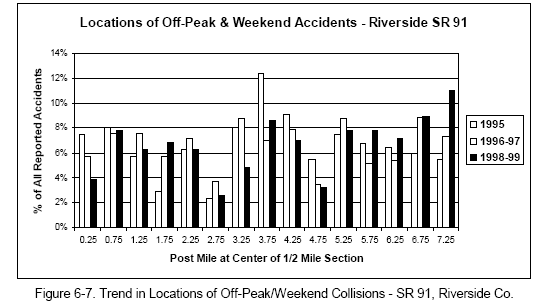
Figure 6-8 shows the trends in peak period, peak direction accident rates for the entire 7.5 mile section of SR 91 in Riverside County, between the county line and Interstate 15. The results are very similar to those for the shorter included two-mile section discussed previously. There exists an increase significant at the 1% level between the total accident rate for 1995 and the 1996-98 average, although in this case the corresponding increase for the F&I rate is not significant at the 5% level. The same conclusions apply to comparisons between the 1995 and 1998 average rates. The slope of a regression line fit to the total accident rate data for 1996-99 is significantly different from zero at the 5% level (R2=0.42), and a regression fit to the total accident rate data for 1995-99 has a significant positive slope at the 1% level, with R2=0.64. Although the evidence clearly suggests that the peak period, peak direction rate for total collisions on the 7.5-mile section of SR 91 in Riverside County has been increasing, probably reflecting worsening congestion, the F&I data do not reveal a significant increasing trend. Findings are similar for the Riverside County 7.5-mile and 2-mile sections in the case of all weekday collisions.
Figure 6-8
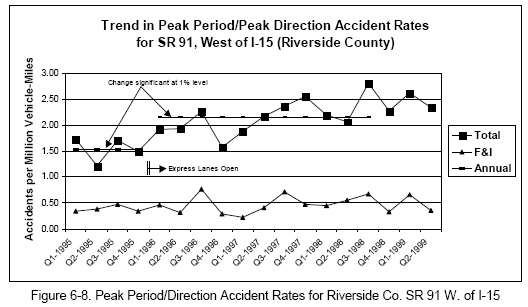
For comparison, Figure 6-9 shows the quarterly peak period, peak direction accident rates for SR 57 between SR 91 and the Los Angeles County line. Recognizing that traffic on this section was not measurably affected by opening the express lanes, the SR 57 section can be regarded as an experimental control. Although a few of the year-to-year differences in the trends are statistically significant, an increase in one year is followed by a decrease in the next. Also, the slopes of the overall trend lines are not significant. We conclude that the overall pattern for the peak period, peak direction on SR 57 shows no meaningful changes, suggesting that the peak period differences observed on SR 91 do not reflect a region wide trend.
On the other hand, the trends for all weekday collisions on SR 57 in Figure 6-10 show increases in both the total and F&I accident rates between 1995 and later years. The increases after 1995 are significant at the 1% level for the total accident rate and at the 5% level for the F&I rate. This suggests a possible region wide effect, since the speed limit on California freeways increased from 55 to 65 mph near the end of 1995. If the increase in the speed limit were to have an effect, it would be expected to occur outside the peak and influence both the total and F&I rates, as is the case here. Note, however, that the increased accident rates observed on SR 91 in Riverside County occurred more predominantly in the peak period and therefore are unlikely to be an effect of the increased speed limit. Also, the fact that the weekly F&I rate did not also increase after 1995 on SR 91 suggests that the effect observed on SR 57 might be an anomaly.
Figure 6-9
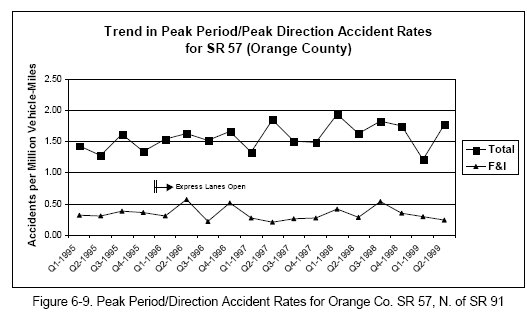
Figure 6-10
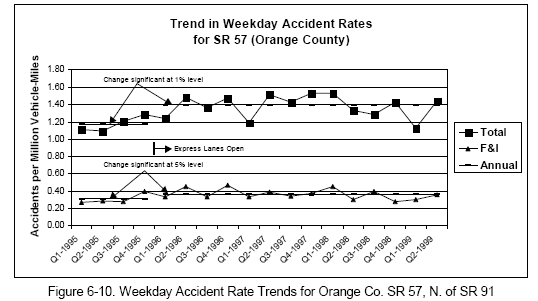
To sum up this section of the report, comparisons for the Orange County section of SR 91 containing the 91X lanes reveal decreased accident rates coinciding with the opening of the toll lanes. These changes may be related to decreased congestion or to the cessation of construction activity on the highway, or both. There exists some evidence of the rates in this section increasing after 1996, but statistical test are inconclusive.
In contrast, comparisons for the Riverside County section of SR 91 east of the terminus of the 91X lanes reveal increased accident rates coinciding with the opening of the toll lanes, including an increase in the peak period in the peak direction F&I rate just east of the county line. There exists some evidence of further rate increases in this section after 1996, but, again, statistical tests are inconclusive.
Table 6-I presents an overall statistical summary of the accident rate comparisons which were made.
Table 6-I. Summary of Statistically Significant Changes in Accident Rates64
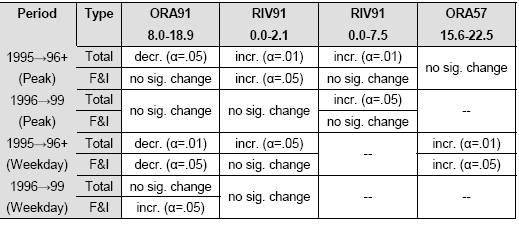
6.4 Comparison of Collision Characteristics
This section takes a closer look at the characteristics of reported collisions on SR 91, since changes in collision characteristics may indicate changes in driving conditions, which may be related to the unusual operating characteristics of the 91X toll lanes.
Figure 6-11 and Figure 6-12 show the annual breakdown in peak period, peak direction reported collision types on SR 91 in both the Orange County section containing the 91X lanes, and the two-mile Riverside County section just past the county line. Of the two sections, the Riverside County section is of particular concern due to the increased accident rates discussed previously. To simplify the display, TASAS collision type codes other than "rear end" and "sideswipe" are grouped as "other."
The data in Figure 6-11 show no systematic changes in the collision type distribution in the Orange County section containing the 91X lanes. Neither the difference in the proportion of rear-enders nor the difference in the proportion of sideswipes between 1995 and 1996 (or between any other pair of years) tests significant at the 5% level.
Figure 6-11
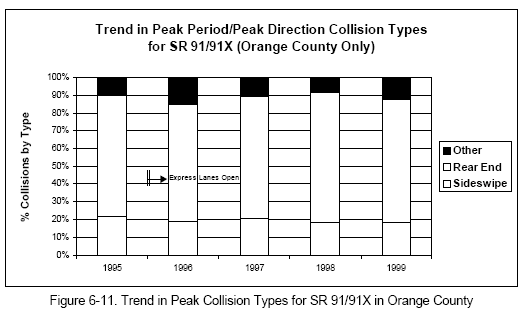
Figure 6-12
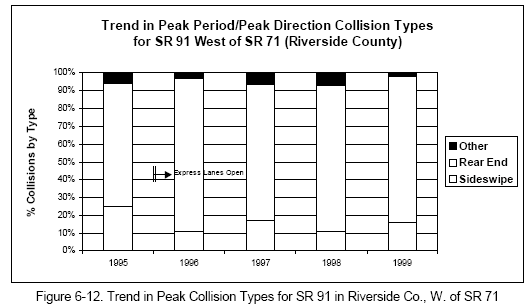
Figure 6-12 show an increase from 70% to 86% in the proportion of rear-enders between 1995 and 1996, a difference which is significant at the 1% level. 65 Between 1996 and 1997, rear-enders drop from 86% to 76%, a change not significant at the 5% level, and then increase again to 82% in 1998 and 1999. These results are consistent with the hypothesis that increased congestion in this section should be accompanied by an increase in the proportion of rear end collisions characteristic of increased congestion.
As a basis for comparison, Figure 6-13 shows, for the Orange County section, the breakdown of collision types for weekend collisions and weekday collisions that are not peak period, peak direction. The proportions of rear-enders, as expected, are much less than in the peak period results, while the proportions of sideswipes are similar.
Figure 6-13
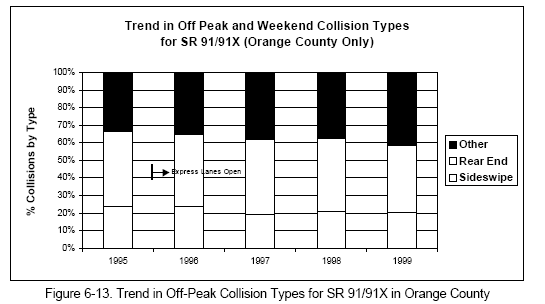
In an attempt to explore further the relationship between changes in congestion and collision characteristics, reported vehicle movements before collisions were examined. The results for the peak period, peak direction appear in Figure 6-14 and Figure 6-15. It was expected that the proportion of collision-involved vehicles slowing or stopped would reflect the changing congestion, much like the proportions of rear end collisions discussed previously. Indeed, the findings are very similar to those for collision type.
For the section in Orange County, between 1995 and 1997 a small reduction in the percentage of involved vehicles slowing or stopped is visually evident, however, none of the year to year changes are statistically significant. In the case of the Riverside County section, the percentage of slowing/stopped vehicles increases from 60% to the 70-80% range, a change which is significant at the 1% level for the increases from 1995 to 1996, and from 1995 to 1996-99 combined.
Figure 6-14
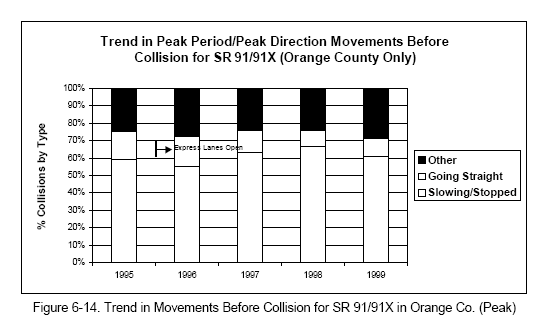
Figure 6-15
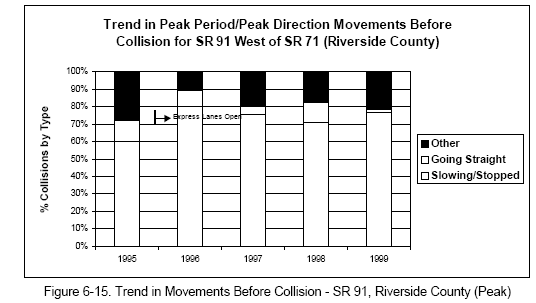
In summary, we conclude that the data on collision characteristics are consistent with the findings of the analysis of accident rates, that there occurred a temporary reduction in congestion-related collisions in the Orange County section of SR 91 containing the 91X lanes. At the same time, congestion-related collisions increased in the section of SR 91 in Riverside County, between the county line and SR 71. There is no evidence that the operating characteristics of the 91X toll lanes result in any systematic differences in collision characteristics, aside from the congestion effects cited.
6.5 Review of Selected Major Incidents
Although analyzing coded historical collision data provides useful insights, some aspects of possible importance may be overlooked because the computer-coded data do not capture many details of the human behavior involved. Therefore, it was decided to examine the detailed collision reports for a selected sample of major incidents on the Orange County section of SR 91 containing the toll lanes. We wanted to see if the narratives and sketches provide more insights into possible issues related to the unusual operating characteristics of the 91X toll lanes. A schematic drawing of the typical cross-section in the vicinity of these incidents appears in Exhibit 6-B.
Exhibit 6-B
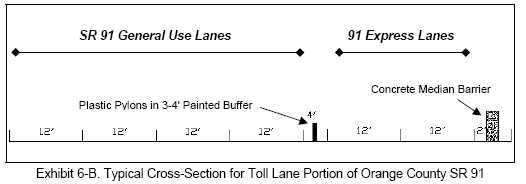
About a dozen major incidents were identified through conversations with personnel at the Caltrans District 12 Traffic Management Center (TMC). Our goal was to identify especially noteworthy incidents of all types (not just collisions) which might reveal problems unique to operating an express toll lane in the median of a busy urban freeway, as well as give insights on how major incidents are handled in such situations. After identifying a group of suitable incidents, TMC records describing the responses and the complete collision reports were obtained. These reports include the investigating officers' narratives although, to safeguard confidentiality, District personnel screened the records to eliminate information identifying the individuals involved. After eliminating cases for which adequate records were unavailable, the nine incidents listed in Table 6-II were examined in detail.
Note that all the incidents examined in detail occurred in Orange County on the portion of SR 91 containing the toll lanes, illustrated in the typical cross-section. We did not examine in detail any incidents east of the Riverside County line.
Table 6-II. Major Incidents Reviewed in Detail

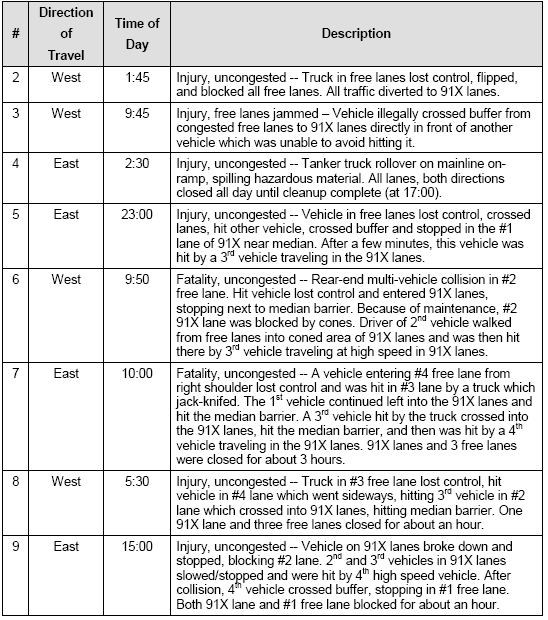
Our review of this information produces the following observations and conclusions:
- CHP and Caltrans responses to major incidents involving the 91X lanes appear to operate smoothly. Normal implementation of the necessary lane closures and traffic control occurred despite the presence of the barrier between the free lanes and 91X lanes. Upstream changeable message signs provided clear traveler information related to the 91X lanes (e.g., "COLLISION AT XXX - FASTRAK CLOSED," "FREEWAY CLOSED, USE TOLL LANES")
- The "soft" barriers between the free and 91X lanes (paint and pylons) are easily crossed by out-of-control vehicles involved in collisions. This was a characteristic in many of the incidents examined (#1, 5, 6, 7, 8, 9). In two of these cases (#5, 6), serious secondary collisions involving high speed 91X traffic occurred.
- Of the nine incidents examined, only one (#3, involving illegal buffer-crossing) would clearly have been prevented by the presence of a hard barrier.
- High speeds and driving behavior suggesting that some 91X users feel insulated from possible breakdown of traffic appear to be causal or contributing factors in a number of the incidents (#3, 5, 6, 7, and 9).
Despite the concerns identified above, the trends in the F&I accident rates in this section, illustrated in Figure 6-1 and Figure 6-2, show no increase in collision severity after the 91X lanes opened. On the contrary, the estimated accident rates in this section improved and still compare favorably to the other road sections investigated.
7. Analysis of Emissions66
7.1 Introduction
This chapter documents our investigation of air pollution emissions in the SR 91 corridor, considering a typical evening commute. Estimated emissions for current conditions are compared with emissions predicted for three hypothesized alternative scenarios. The alternative scenarios are:
- If HOV lanes were constructed rather than the toll lanes.
- If two additional general use lanes were constructed rather than the toll lanes.
- If no capacity improvements were made.
Calculations are based on the California Air Resources Board computer model EMFAC combined with local volume and speed data. EMFAC is a well established, practical emissions model for analyzing air quality, based on aggregate vehicle test cycles. It was developed for addressing air quality consequences of transportation system changes over large areas. Although sometimes applied, as here, to estimate emission impacts of operational and physical changes on individual highway sections, we must acknowledge the difficulty of applying such a model to address traffic operational differences which are more detailed and localized than the data on which the emissions model is calibrated.
The next section summarizes the principal findings. Succeeding sections present the detailed results of emissions modeling for the current 91X highway configuration (Scenario 1) and for the three alternative scenarios. Methodology Appendix 7-A (Section 7.8) describes the characteristics of the emissions model and how it was calibrated to local conditions.
7.2 What We Learned about Emissions in the SR 91 Corridor
The following are the principal findings from this part of the study. The location in the text containing the supporting data for each finding is indicated.
- If dual HOV lanes had been constructed instead of the 91X toll lanes, and assuming no change in vehicle-miles of travel (VMT), the overall modeled emissions for March 1998 conditions would be approximately the same as with the existing 91X facility. (Section 7.4, Table 7-V.)
- If general use lanes had been constructed instead of the 91X toll lanes, the modeled emissions for March 1998 would be approximately the same, assuming that induced traffic produced a 7% traffic (VMT) increase. For other assumptions on induced VMT, ranging from 0% to 10%, overall modeled emissions would vary from 6% less to 3.7% more than the values estimated for the existing 91X facility. (Section 7.5, Table 7-X through Table 7-XIII.)
- If no additional capacity had been built, our best estimate is that VMT would be about 8% less and overall modeled emissions in March 1998 would be 18% less than the values for the existing 91X facility. This analysis is based on very limited data. (Section 7.6, Table 7-XV.)
7.3 Emissions Analysis for the Existing 91X Highway Configuration
An accurate assessment of the existing conditions on SR 91 is the most important part of this exercise. The existing scenario exists as the benchmark against which the other hypothetical scenarios are compared. For the existing scenario, no operational assumptions were made. The emissions data correspond to four days, Tuesday through Friday for a week in March, 1998 (before the opening of the Eastern Toll Road, SR 241). These days were characterized by freeway loop data obtained from the Freeway Performance Monitoring System developed at the University of California, Berkeley.67
For the study section of SR 91, mainline loop detectors are present at roughly half-mile spacing (Figure 7-1). Loop data were summarized at 12 half-hour intervals (2:30 to 8:30 PM) over the 16 half-mile segments. These data provided two essential inputs: the number of vehicles for each half hour period, and the average speed for each period. The average speeds are rounded to 10 mile per hour increments and each is assumed to be representative of a distance 0.25 miles both upstream and downstream of the loop detector. The emission factors generated for each pollutant (Figure 7-10 through Figure 7-13) are applied depending on the average speed. Emissions for each half-mile section are calculated by multiplying the number of vehicles by the emission factors per mile and by the section length.
Figure 7-1
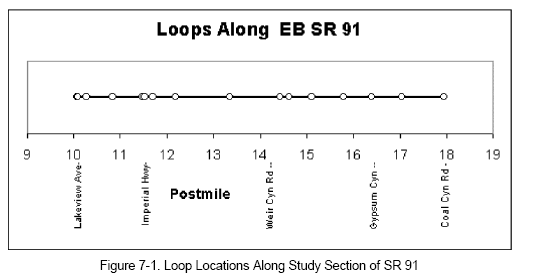
An illustration appears in Table 7-I and Table 7-II. For example, the particulate emissions between post miles 10 and 10.5 from 14:30 to 15:00 in the afternoon are estimated as align="justify" 82.41 grams (= 0.5 mi. x 3500 vehicles x 0.0471 g/veh.-mi.).
Table 7-I. Sample Emissions Factor

Table 7-II. Emissions Calculated From Table 7-I

This procedure was used for both the eastbound and westbound directions to produce total emissions for the section and time interval. Values were then converted to kilograms for convenience. Note that westbound conditions are at free flow during the evening peak period, while the eastbound commute can be quite congested.
Also needed were the emissions produced on the toll lanes. The toll lanes are different in many ways from the mainline. First, the toll lanes cater to light-duty autos and light-duty trucks (LDAs and LDTs - see Table 7-XVII). The traffic composition on the toll lanes was determined by viewing video taken of the facility, just as was done for the mainline. A special set of emission factors were generated for the 91X vehicle mix. Because the toll lanes are never congested, speed was assumed to always be 60 miles per hour. Traffic data were obtained from Caltrans District 12 in the form of daily spreadsheets providing hourly counts in both directions. These counts were applied to the emission factors to get the total emissions contribution by the toll lanes. These were added to the eastbound and westbound mainline estimates to produce total values for each pollutant for the study period.
The emission estimates are shown in Table 7-III and Figure 7-2. These estimates should be regarded as approximate amounts that can be expected from typical evening commutes. These results will be compared to those of the other scenarios.
Table 7-III. PM Peak Period Emissions for Scenario 1 (Kilograms)

Figure 7-2
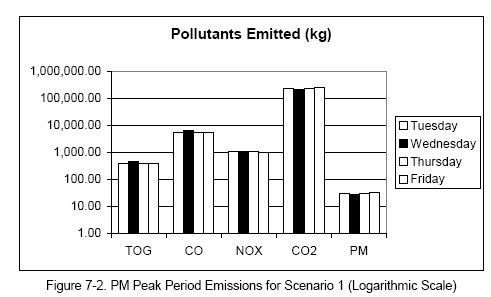
In comparing the days studied against each other it is interesting to note several things. First, the amounts of particulates from tire and brake wear do not change much with speed. For this reason the particulate emissions can be a rough indicator of total vehicle-miles of travel (VMT). Also important to consider is the speed-dependent nature of each pollutant. Wednesday, which had the lowest VMT, also had the highest emissions of TOG, CO, and NOx. This is due to the fact that Wednesday had a larger portion of the time period with free flow conditions of 65 miles per hour. As seen in the appendix (Section 7.8), the emissions for these three pollutants are higher at 65 miles per hour than at other speeds (with the exception of very slow speeds under 10 miles per hour). Similarly, Friday, which had the highest VMT, had the highest emissions of CO2 and particulates. This is because these two pollutants are less sensitive to speed.
7.4 Emissions Analysis for the HOV Lane Alternate Scenario
In the early 1990s, it was planned to construct HOV lanes in the median of SR 91. However, due to competition for project funding, these HOV lanes could not be constructed until about the year 2000. By allowing the CPTC to finance and construct toll lanes, the capacity of SR 91 could be increased five years sooner. HOV lanes currently exist both east and west of the 91X lanes and extensive HOV lane mileage exists throughout the Southern California freeway system. During peak hours, HOV lanes usually operate faster and more reliably than general use mainline lanes. It has been shown that in many locations HOV lanes improve the throughput of freeway corridors by increasing the average number of persons per vehicle. In most corridors of Southern California, HOV lanes can be used by vehicles with two or more occupants, vanpools, buses and motorcycles.
In many respects, HOV lanes operate similarly to the 91X toll lanes. Both accommodate mainly small vehicles and have fairly stable speeds. For this reason, we assumed that if HOV lanes had been built, they would carry a similar vehicle composition and have the same emissions factors which were generated for the existing scenario described in Section 7.3. This assumption may overestimate emissions slightly, because building a dual-lane HOV facility in lieu of the toll lanes might encourage greater HOV use, and therefore reduce VMT. However, since the facility serves a small portion of most trip lengths and since the 91X toll lanes provide HOV-incentive toll discounts, the magnitude of the potential mode shift is probably quite small.
Regarding traffic volumes, it was assumed, of course, that single occupancy vehicles (SOVs) would be excluded from the HOV lanes and would add to the traffic in the regular lanes. HOV2 and HOV3+ vehicles already using the toll lanes were assumed to be part of the traffic using the HOV lanes. Finally, it was assumed that a percentage of the HOV2 and HOV3+ traffic in the general use lanes would divert to use HOV lanes.
In Scenario 1 (the existing situation), the toll lanes carried between 13,419 and 20,037 vehicles during the six hour study period, depending on the day of the week. Using mainline vehicle occupancy observations from 3/10/98 through 6/15/99, it was determined that nearly 79% of the mainline traffic was composed of SOVs, with HOV2 and HOV3+ traffic making up 17% and 4% of the volume respectively. Similar data from the toll lanes showed that 68% of the toll lane users were SOVs while HOV2 and HOV3+ made up 22% and 10%. Findings from our 1998 study of SR 91 showed that, on average, 60% of HOV2 vehicles and 80% of HOV3+ vehicles use a carpool lane when it is provided. Combining these data, it becomes apparent that almost 32% of existing toll lane traffic would become HOV traffic, while 68% would revert to the mainline. Similarly, 13.5% of the mainline traffic would elect to use the HOV lanes if provided.
Figure 7-3

Of interest in this scenario is how the hypothesized conversion of the toll lanes to HOV lanes affects the mainline volumes. The high percentage of SOV commuters in the toll lanes during peak hours are shifted to the mainline, adding as much as 1700 vehicles per hour at 5:00 PM. It is also interesting to note that approaching or following the peak, the HOV lanes receive up to 750 vehicles per hour from the mainline. This occurs because as the volume in the toll lanes increases during the peak, an increasing number of SOV vehicles are shifted to the mainline while being replaced by a smaller number of HOV2 and HOV3+ vehicles. During free flow periods, the volume in the toll lanes is lower; so fewer SOV drivers would shift to the mainline, although however a greater number of HOV2 and HOV3+ vehicles previously in the mainline would switch to the HOV lanes. The magnitudes of these shifts are illustrated in Figure 7-4.
Figure 7-4
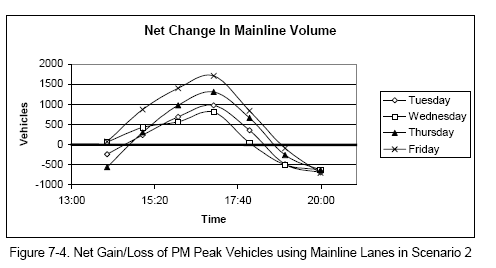
The emissions calculations for this scenario are similar to Scenario 1. The counts obtained from the loop data were modified for each time period depending on the net gain or loss of vehicles determined above. Average speeds were modified only if there was a significant increase or decrease in the volume added or taken away from the mainline in a given time interval. This was done using the data in Figure 7-5, which shows the relationship between volumes and speed along SR 91. Once this adjustment was made, the same emission factors used in Scenario 1 were applied as before and emissions were calculated.
Figure 7-5
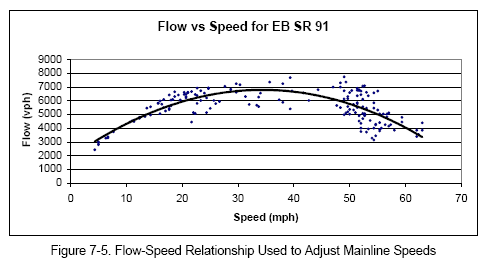
Because vehicles were simply shifted between the mainline and the assumed HOV lanes, the total VMT did not change. From the results of this scenario, which are shown in Table 7-IV, the emissions consequences of building HOV lanes instead of toll lanes are basically negligible. In most cases the differences, shown in Table 7-V, are less than one percent.
Many of the comparisons are only a small fraction of a percent. These small differences between the scenarios are a result of changes in volumes between the mainline and the HOV lanes and the speed-based emissions factors associated with them. These results directly reflect the nature of the driving-cycle-based estimation methodology, as discussed in Section 7.7.
Table 7-IV. PM Peak Period Emissions for Scenario 2 (Kilograms)

Table 7-V. Differences in Emissions Between Scenarios 1 and 2

7.5 Emissions Analysis for the General Use Alternate Scenario
This scenario explored the hypothesis that the four lanes built in the median of SR 91 were not toll lanes or HOV lanes, but rather two additional general use mainline lanes. If the number of vehicles traveling the facility were to remain constant, the conversion of the toll lanes to —free“ lanes would undoubtedly, for a while, improve the mainline level of service experienced during peak hours. This is because the toll lanes operate comfortably below capacity. The 91X lanes typically carry about 1,400 vehicles per hour per lane maximum for short periods of time at good levels of service, while the mainline lanes reach about 2,000 vehicles per hour per lane at level of service F. It seems clear that if free lanes were constructed rather than toll lanes, the total traffic would distribute about evenly across the six available lanes, leading to a reduction in mainline congestion if no traffic increase is assumed.
However, numerous studies, including our own, clearly show that when capacity is added to a facility it is unlikely that peak traffic volumes remains unchanged. In principle, new capacity draws more vehicles to the peak period from three sources. Vehicles that were previously taking alternate routes may elect to use the added capacity. Vehicles that were traveling at different times of the day may use the facility at peak hours. Finally, new trips may be generated because of the perceived improvement in service. Added travel of this nature is known as —induced travel.“ A study conducted by Robert B. Noland, a former transportation analyst for the Environmental Protection Agency, using 15 years of data from several American cities, found that for every 10% of added capacity, on average there is a 2.8 percent increase in travel68. A similar study by Lewis M. Fulton, of the International Energy Agency in Paris, using 26 years of data from Maryland and Virginia, showed a 3.3% increase in traffic for every 10% increase in capacity.
The capacity of a mainline lane is assumed to be 2,200 vehicles per hour. The largest volume over the toll lanes is currently around 1,400 vehicles per hour per lane. Converting the toll lanes to mainline lanes would provide a 14% increase in capacity during peak periods (=(2 x 800)/(4 x 2200 + 2 x 1400). Based on the studies by Noland and Fulton, induced travel might therefore be expected to be in the range of 4-5%. Since this prediction is quite speculative, Scenario 3 will examine emissions under four different assumptions: assuming no induced travel, then assuming 3%, 7% and 10% induced travel, respectively.
For the evening peak period in the westbound direction, no significant congestion currently exists. It is therefore assumed that no induced travel would occur in this direction during the evening peak. Therefore, westbound volumes for Scenario 3 will simply incorporate the current hourly counts at free flow traffic conditions. In the eastbound direction, the added capacity would be expected to cause a more pronounced peak period between the hours of
4:00 PM and 7:00 PM. During these hours, the new free lanes were assumed to operate at the same speeds and volumes as the four original lanes did in Scenario 1. Similarly, the hours defined in the study observation period as not within this peak experienced a significant improvement in conditions. Speeds in these shoulder periods would become free flow, between 55 and 65 miles per hour.
These changes in speeds had a substantial effect on the emission factors assigned to them, and the total emissions produced during those time intervals. The volumes within the above main peak hours increased even though the vehicle speeds did not. Likewise, the volumes for the hours in the shoulders of the main peak were reduced to account for the higher demand during the main peak. This kept the total VMT consistent with the targeted
Figure 7-6
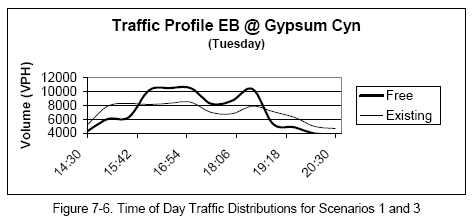
In accordance with Figure 7-6, under Scenario 3, evening commutes will experience a narrower, fairly congested peak with free-flow shoulder periods on both sides. This has the effect of keeping the majority of the VMT in a moderately congested speed range of 25-55 miles per hour between 4:00 PM and 7:00 PM with a smaller percentage of the total VMT occurring at free-flow conditions either before or after this main peak period.
Using the emissions factors illustrated in Figure 7-10 through Figure 7-13, these speed and volume adjustments produce significantly less emissions if there is no induced travel. As seen in Table 7-VI and Table 7-X, most pollutants are 3% to 10% lower than their corresponding values in Scenario 1. However, when induced travel is included, the emissions increase, as shown in Table 7-VII through Table 7-IX. With a 3% increase in VMT, the emissions rise to the range of 1% to almost 8% lower than Scenario 1 (Table 7-XI) . 7% induced VMT causes these emissions to increase to a range 3% above to 4% below Scenario 1 (Table 7-XII), depending on the pollutant. When induced travel is increased to 10%, emissions range from 8% above to 1% below Scenario 1 (Table 7-XIII). The Wednesday data, due to lower VMT and higher speeds, produce emissions that are slightly higher than the other days.
From this information it can be concluded that if two additional general use lanes had been constructed instead of the 91X lanes, the emissions during the evening commute would be either higher or lower, depending on one's assumptions regarding induced travel and depending on the pollutant. However, even a 10% increase in VMT would not increase emissions greatly above current levels.
Table 7-VI. PM Peak Period Emissions for Scenario 3 - No Induced Traffic (Kilograms)

Table 7-VII. PM Peak Period Emissions for Scenario 3 - 3% Induced Traffic (Kilograms)

Table 7-VIII. PM Peak Period Emissions for Scenario 3 - 7% Induced Traffic (Kilograms)

Table 7-IX. PM Peak Period Emissions for Scenario 3 - 10% Induced Traffic (Kilograms)

Table 7-X. Differences in Emissions Between Scenarios 1 and 3 - No Induced Traffic

Table 7-XI. Differences in Emissions Between Scenarios 1 and 3 - 3% Induced Traffic

Table 7-XII. Differences in Emissions Between Scenarios 1 and 3 - 7% Induced Traffic

Table 7-XIII. Differences in Emissions Between Scenarios 1 and 3 - 10% Induced Traffic

7.6 Emissions Analysis for the No-Build Alternate Scenario
In addition to the previous scenarios, one obvious alternative remains. This is to estimate the emissions that would be produced if no additional lanes, toll, HOV, or free had ever been constructed. If no additional lanes had been added, conditions would be considerably worse now than in 1995, when SR 91 was notorious for traffic delays. However, if capacity had not been increased, the traffic volumes using SR 91 would be expected to be considerably less than is present today. For this reason, this scenario should be seen not only as a comparison of emissions (which are lower than current amounts), but also as a comparison of functionality. Just because the emissions are lower does not indicate a desirable situation. If that were true, we should close the roadway altogether.
To estimate the 1998 emissions for SR 91 with eight total lanes of traffic, it seemed best to use data from late 1995 just before the opening of the 91X lanes. Our 1998 SR 91 study report observed trends in overall average daily traffic (ADT) both before and after the express lanes entered operation (Figure 7-7)69. Data from before the addition of the 91X lanes showed an average monthly growth trend of 450 vehicles per day per month. Extending this trend to 1998 would give an ADT 8% higher than in December 1995. This 8% increase was applied to the loop data to produce the estimated volumes expected in 1998 for this scenario. This resulted in an estimated vehicle-miles of travel (VMT) about 8% less than the existing 91X configuration (Scenario 1).
Figure 7-7
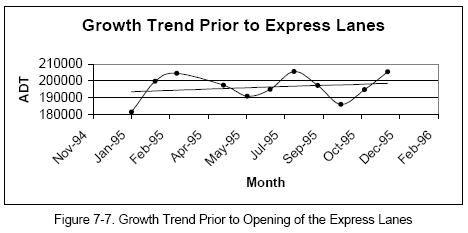
A major problem for this scenario is the lack of complete coverage of the loop data in 1995. Loop data recorded in Orange County before January 1998 were collected and managed differently. Mainline loop detectors existed (or could be accessed) only from the freeway exits such as Lakeview, Imperial, Weir Canyon, Gypsum Canyon, and Coal Canyon. At best, five loops could be called up in each direction to provide volume and speed data. What usable data there were in the archives included three to four loops in the eastbound direction and only one or two loops westbound (see Figure 7-8). This differs from the 14 loops available in each direction for the previous scenarios. This created a serious problem of consistency in the methods used for the four scenarios. Rather than each loop covering an average of a half-mile of freeway, in this scenario a single loop was assumed representative of distances between one and three miles. Due to the westbound data only containing Coal Canyon loops, it was decided that only the eastbound emissions volumes would be compared to Scenario 1, and due to poor Wednesday data, that only the Tuesday, Thursday, and Friday comparisons would be made. Because of incomplete data, this scenario is not considered equal in validity to the others.
After applying the 8% increase in VMT to the 1995 loop data, the emissions results, shown in Table 7-XIV and Table 7-XV are astonishingly low. Ranging from 1% to 45% below current levels (Scenario 1), the emissions demonstrate the effect of not having an additional four lanes along the length of the study section. The differences would be less dramatic if westbound traffic could have been included. Westbound traffic would have the effect of diluting the eastbound differences due to the fact that the westbound traffic would not be very different from current traffic, in volumes and, more importantly, in speeds. The low emissions are also due to the extreme congestion which would be present on SR 91 with only four lanes in each direction. Because of the lower capacity, speeds would rarely reach 65 miles per hour where the methodology causes emission production to rise significantly. See Section 7.7 for further discussion.
Figure 7-8
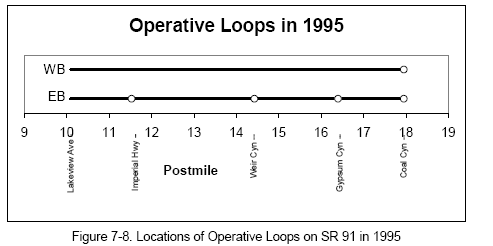
Table 7-XIV. PM Peak Period Emissions for Scenario 4 (Kilograms)

Figure 7-XV


Although these emission results may seem favorable compared to the other scenarios, the travel conditions that would exist would be terrible. In addition, the results for this scenario are most susceptible to estimation errors due to the inability of the emissions model to accurately capture the localized differences from stop-and-go driving conditions (see Section 7.7). For these reasons, it is inappropriate to seriously compare Scenario 4 to the other scenarios presented in this report.
7.7 Summary and Conclusions of the Analysis
The single most important conclusion that can be drawn from this experience is the obvious limitations of models like EMFAC for addressing issues of this nature. These results consistently show that more congested periods have lower emissions. This occurs due to the nature of the computer model‘s emission factors. These factors are derived from total emissions produced over a standard driving cycle and given in the convenient units of grams per mile at average free flow speeds of the driving cycles. Factors developed in this way cannot properly account for the local effects of accelerations and decelerations which exist in extreme levels of freeway congestion. Although a vehicle traveling at a constant 65 miles per hour produces much higher emissions than a vehicle traveling at a constant 25 miles per hour, it is difficult to accept that vehicles traveling at a constant 65 miles per hour produce several orders of magnitude more emissions than vehicles in stop-and-go 25 mile per hour congestion. Yet this is how EMFAC and similar models work.
Recognizing the limitations of EMFAC, the findings of this report are summarized in Table 15.
Scenario 2 produced no significant change in overall emissions. Scenario 3 produced some interesting differences. If no induced travel occurs, which is highly unlikely, the facility would operate with 6% lower emissions overall. 3% induced travel, probably on the low side, would result in emissions levels 3% below levels estimated for the 91X. With 7% induced travel, the section would produce about equal emissions levels to the 91X, and with 10% induced travel it would reach nearly 4% above 91X levels. Finally, the "no build" scenario results in emissions which are, on average, 18% below current levels. However, the corresponding congestion would be intolerable. Of the scenarios considered, all but the "no build" were analyzed based on comparable data. The latter is based on much more limited data and, as such, warrants less consideration.
Table 7-XVI. Summary of Emission Comparisons for All Scenarios
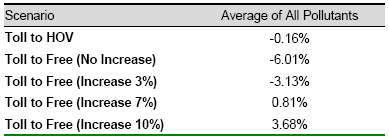

7.8 Methodology Appendix 7-A: Description of the Emissions Model
In calculating emissions, four types of pollutants are measured. These are total organic gasses (TOG), Carbon monoxide (CO), oxides of Nitrogen (NOx), and particulate matter (PM). Carbon dioxide (CO2) emissions can also be calculated. Total emissions are calculated by multiplying an emission factor by related measures of activity. The three measures of vehicle activity are the population of vehicles, the vehicle-miles traveled (VMT), and the number of vehicle starts. The emission factors for these activities are in grams per vehicle, grams per mile, and grams per start. Since this project concerns vehicles in motion along SR 91, only the emission factors pertaining to VMT were used.
California‘s highways carry a vast diversity of vehicles from motorcycles to heavy-duty trucks. Because of vehicle differences, it is necessary to form classifications based on vehicle and engine types. Eight different vehicle classes and three technology groups have been adopted. This provides for 17 different class/tech combinations (Table 7-XVII). The technology groups are non-catalyst (NCAT), catalyst-equipped (CAT), and diesel (DSL) fueled vehicles70
The computer model, EMFAC is one of four computer models developed by the California Air Resources Board and collectively known as the Motor Vehicle Emission Inventory models (MVEI). These models were developed to estimate emission inventories on the state, air basin and county levels. Air basins are geographic regions where meteorological and geographic conditions are similar. Included in these models are regulations that have already been adopted before the release of the software, not the regulations that have been proposed. Regulations include California smog requirements and gasoline additives. Due to the focus of the modeling software being basin or county wide, the package is normally used as a macro-scale model rather than applied to a short section of freeway.
Table 7-XVII. Vehicle Class/Technology Groups
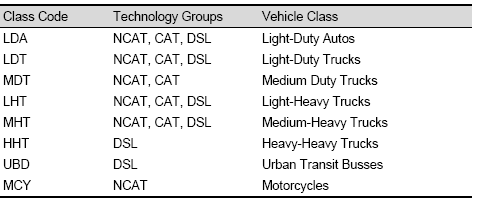
A brief summary description of the four MVEI models follows.
CALIMFAC. The first step in MVEI modeling is the CALifornia I/M (Inspection and Maintenance) Emission FACtors Model. CALIMFAC calculates basic emission rates (BERs) for different I/M (smog check program) scenarios. To develop CALIMFAC, vehicles are tested using the Federal Test Procedure (FTP). In the FTP, vehicles are attached to a dynamometer (basically a set of rollers attached to the drive wheels) and —driven“ through a pattern of idle, acceleration, cruise, and deceleration. These phases are called drive cycles and produce an emission factor specific to each cycle. Roughly 5,000 vehicles have been tested and incorporated into this model. Testing vehicle models of varying ages showed that vehicle emissions grow with use. For example, a vehicle that has driven 50,000 miles produces more emissions than a new vehicle. The ARB also found that older vehicles tend to be driven less.
WEIGHT. The Activity WEIGHTing model WEIGHT produces three types of data that can be combined with the results of CALIMFAC into EMFAC. WEIGHT produces cumulative mileage, travel fractions by model year, and travel fractions by technology group. WEIGHT can also be run by itself to produce data such as population travel fractions by model year, VMT fractions by model year, and travel fractions by technology group. Since this report considers a short segment of freeway that carries a unique vehicle mix, different from Orange County as a whole, this model was not used to obtain VMT inputs.
EMFAC. The Emission FACtor Model (EMFAC) takes the BERs by model year from CALIMFAC and applies various correction factors by model year, and the distribution of model years to produce composite fleet average emission factors for each vehicle class, technology group, pollutant, and emitting process. Results vary according to the input, which includes calendar year, model years, summer or winter inventory, speed range, temperature range, and I/M programs. These composite emission factors can be used with the WEIGHT model or applied to a specific vehicle mix (as in our analysis) to produce composite emissions factors that represent all vehicles.71
BURDEN. The last model in the MVEI series is BURDEN. It is named for the atmospheric emissions burden that it estimates. BURDEN uses the emission factors generated in EMFAC and applies them to county or basin wide activity data to produce emission inventories. BURDEN can also estimate fuel consumption and SOX and lead emissions from the fuel consumption data. Because SR 91 is a small highway section compared to Orange County as a whole, this model was not used.
Ideally, in order to estimate the emissions consequences of the 91X lanes, the entire roughly 10-mile length of the facility would be examined. However, the junction of SR 91 with SR 55 is rather complicated, with the express lanes splitting to both freeways. Applying mainline volume and speed data within this split would be questionable. More reliable freeway data are available from Lakeview Avenue (post mile 10.27) to Coal Canyon Road (post mile 18.16) in roughly half-mile segments. Consequently, the study section is defined as the eight-mile section between Lakeview and Coal Canyon Road. At most points along this section, there are four mainline and two toll lanes for the westbound and eastbound directions, 12 lanes in total. The time period of interest is defined as the six-hour evening commute period between 2:30 PM and 8:30 PM. This covers the main peak of the evening commute as well as the ascending and descending periods known as —shoulders“ (see Figure 7-9).
Figure 7-9
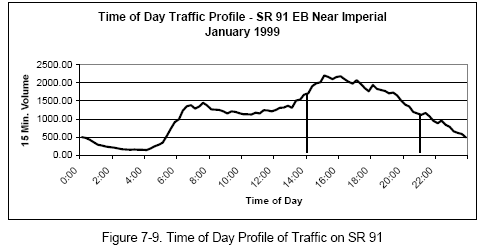
To estimate emissions produced along our SR 91 study section, quite a few processing steps are needed. The EMFAC computer model is a single step at the beginning of this process rather than its centerpiece. First, EMFAC is given running conditions specific to the area. The season is specified as —summer,“ which tells EMFAC what kind of gasoline additives are being used. The vehicle fleet is set to the 1998 model year. The operating temperature is given as 75 degrees Fahrenheit; which was assumed representative of the six-hour period. Finally, current I/M programs are turned on. EMFAC is run and the output files are generated. Using the information provided by CALIMFAC, EMFAC generates speed dependent tables for each type of pollutant by vehicle and technology group in units of grams per mile. These tables contain a large amount of information for each pollutant for speeds ranging from 5 to 65 miles per hour. Because of the quantity of information, it was necessary to compute a single speed-dependent emission factor for each pollutant. This emission factor was considered representative for the SR 91 mainline. If a county or basin study were needed, the models WEIGHT and BURDEN would be used. However, since this is a micro-scale setting, all that is needed are the emission factors from EMFAC.
Exhibit 7-A72
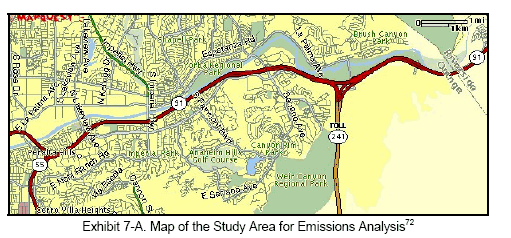
SR 91 has a different vehicle fleet composition than the area as a whole. For this reason it was necessary to develop a specific vehicle type distribution. Vehicle occupancy data which were obtained providing the numbers of vehicles, buses, vans, trucks, and motorcycles traveling the SR 91 mainline at different times of the day. These occupancy data allowed rough percentages to be estimated (Table 7-XVIII). This created a problem because the types of vehicles and trucks were not well distinguished, nor identified by technology type. To resolve this, videotapes were obtained for the mainline lanes and express lanes at different times of the day and days of the week. These tapes were viewed and the types of vehicles were tallied. This helped fill the gaps in the roadside occupancy data and provided detailed breakdowns of the types of vehicles and trucks (Table 7-XIX and Table 7-XX). It is important to note that the toll lanes only contain small vehicles (LDA + LDT). This provided the needed site-specific distribution of the vehicle mix.
Table 7-XVIII. Breakdown of SR 91 Vehicle Types from Roadside Observations

Table 7-XIX. Vehicle Types from Video Tapes Supplementing Roadside Observations

Table 7-XX. Observations From Video Tapes for the 91X Toll Lanes

Before this estimated vehicle mix could be applied to the emission factors generated by EMFAC, the technology types within each vehicle classification were necessary. For this, we used information obtained from the California Air Resources Board breaking down technology types by vehicle category for Orange County. By merging these data with that of the occupancy study and the video observations, a complete breakdown of vehicles on SR 91 could be made (Table 7-XXI).
Table 7-XI. Final Vehicle Composition by Technology Type (Mainline)
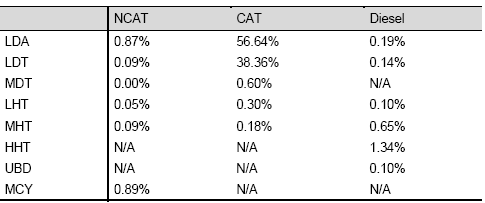
Using the percentages in Table 7-XXI, the emission factors generated by EMFAC were combined into a single representative emission factor for each pollutant by vehicle speed. This was accomplished by multiplying the emission factor generated by EMFAC for each vehicle classification and technology type by the vehicle composition percentages above. Because of their different vehicle types, separate factors were generated for the mainline and toll lanes. The mainline factors are shown in Figure 7-10 through Figure 7-13.These factors, in units of grams/mile, were multiplied by the number of vehicle-miles traveled (at their respective average speeds) to produce the total mass of pollutants emitted.
Figure 7-10
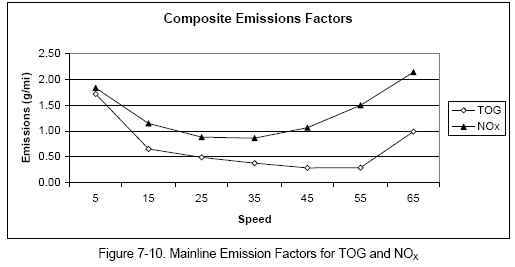
Figure 7-11
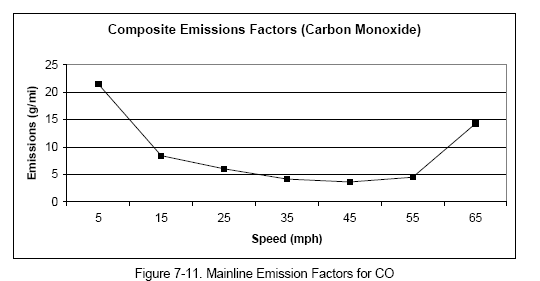
Figure 7-12
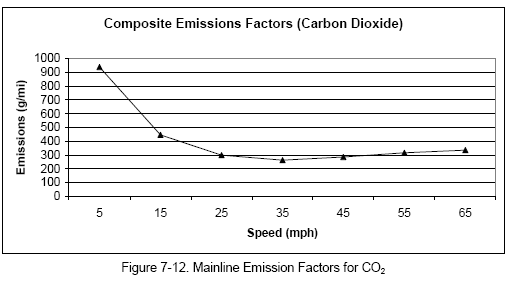
Figure 7-13
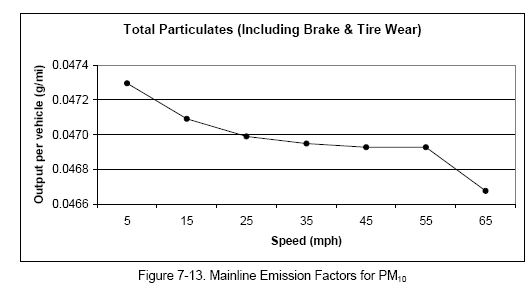
The trends in these emission factors are very important to understanding the results of the different scenarios. Toll lane emission factors were applied at 60 miles per hour on each graph. With the exception of the particulates and carbon dioxide, the emission factors for speeds above 55 miles per hour can be as high as those in the 5 to 15 mile per hour range. The methodology therefore indicates that traffic traveling at high speed can be just as polluting as congested traffic.
8. Conclusion
This chapter revisits what we believe are our most important findings, and presents some issues which warrant future consideration.
The continuing experience in Orange County shows that increasing numbers of commuters are willing to pay tolls to enjoy the tangible benefits of reduced travel time, improved driving comfort, and perception of improved safety. Although the majority of commuters do not find it worthwhile to pay the tolls every commute trip, with time and increasing congestion the percentage of toll lane users has increased. While toll lane use has continued to vary significantly with income, gender, age, and other characteristics, people from all demographic backgrounds make use of the facility. Our modeling work shows that being female is the factor most strongly associated with toll lane use, while high income, age, education, and traveling to work all influence travelers' likelihood of obtaining transponders.
During the height of the peak period, the 91X lanes accommodate 1400-1600 vehicles per hour per lane, about the same as the adjacent freeway and more than the freeway had previously accommodated when jammed with severe congestion before the 91X lanes existed. The presence of the value-priced by-pass lanes has resulted in an equilibrium under which the overall facility operates better than before. As a further benefit, commuters have the option to travel congestion-free on occasions when the value of doing so exceeds the toll.
Although the impacts of the 91X lanes on corridor traffic have been largely favorable, freeway congestion has steadily increased, and the recent opening of the ETR has worsened that congestion, especially in the eastbound direction where eight lanes of traffic must now merge into six lanes where SR 91 crosses the county line. Increased congestion has been accompanied by increased toll facility use and a decline in the proportion of non-work trip purposes during peak periods.
The opening of the 91X lanes in 1995 and the ETR in 1998 were both accompanied by substantial increases in new peak period traffic, in which the single occupant vehicle (SOV) component was the largest part. However, the opening of the 91X lanes in 1995 was accompanied by a one-time 40% increase in HOV3+ traffic in the corridor, probably related to the initial policy of allowing HOV3+ traffic to use the 91X lanes for free, and to the promotions surrounding that policy. Recent changes, including the inception in early 1998 of charging HOV3+ users 50% of the regular toll, did not change the increased level of HOV use which appeared soon after the 91X lanes opened. Although many HOV3+ commuters no longer use the 91X lanes as frequently, their overall numbers in the corridor have not significantly changed. Average vehicle occupancy (AVO) has remained stable following its initial decrease in 1996 following the large increase in new SOV traffic. HOVs in the corridor continue to use the 91X lanes more often than SOVs, although the frequency of use by HOV3+s no longer significantly exceeds HOV2s following the 50% toll charge.
Fears that the value-priced facility might cause erosion in ridesharing as well as in public transit use in the corridor clearly have not materialized. However, it must be recognized that the 91X serves a small part of the trip length for many commuters, and the extensive HOV network throughout Southern California continues to provide an over-arching incentive for ridesharing.
Value pricing continues to be associated with highly selective travel behavior. Although the proportion of commuters who use the lanes has increased, of those who use the facility, the proportion who use it for half or more of their peak trips has decreased. The "91 Express Club," which provides toll savings for persons making more than 20 toll lane trips per month, continues to attract only a small portion (about 12%) of transponder-holders.
The traveler's decision to use the toll lanes remains very closely related to hour-by-hour variations in traffic conditions. Our related multivariate modeling shows that peak period commuters on SR 91 value time at approximately $13-16 per hour, and their price elasticity of demand is about 0.7-0.8 for the overall peak period, and about 0.9-1.0 for the single peak hour. This demonstrates substantial scope for fine-tuning hourly demand through time-variable tolls.
New toll schedules first implemented in September 1997 introduce hour-by-hour toll differences within the peak periods. As yet, the fairly small differences in the hour-by-hour peak tolls have not been accompanied by much flattening of the peak period traffic distributions. However, diversion of traffic from the 91X lanes to the ETR after October 1998 did result in a flatter peak for the 91X, especially in the AM period.
Travelers who choose to pay tolls consistently overestimate their time savings by 5-30 minutes per trip. Drivers cite easier driving and perceived safety as the main two reasons for using the toll lanes beside time savings. Better reliability is cited a distant third. Toll lane users say that the 91X lanes are safer than the adjacent free lanes by a 4:1 margin.
Accident rates for the Orange County section of SR 91 containing the toll lanes decreased significantly after the toll lanes opened, an effect which may be due to decreased congestion or the conclusion of construction activities, or both. At the same time, accident rates increased in the Riverside County section of SR 91 just east of the toll lanes. There is visual evidence of rates increasing in both sections since 1996, but statistical tests are inconclusive. Overall estimated accident rates in the Orange County section containing the 91X lanes continue to compare favorably to the other road sections investigated.
An aggregate emissions analysis indicates that emissions associated with the 91X project are about the same as would have occurred if dual HOV lanes or dual general use lanes had been constructed instead.
Although financial performance was not directly investigated in this study, corporate reports indicate that a value-priced facility can clearly be financially successful in a carefully selected market. Even given the direct competition and congestion problems which accompanied the opening of the new Eastern Toll Road (ETR), the 91X project is reportedly maintaining acceptable financial performance, and the project appears poised to yield a favorable rate of return through the life of the project. On the other hand, it is rare for a new urban highway project to enjoy the 91X's unusual combination of modest capital requirements (less than $3.5 million per lane-mile), large demand, and a favorable institutional environment for quick implementation. While value-pricing can provide a significant financial boost for other proposed urban highway capacity enhancement projects, it is unlikely that numerous future projects can be fully financed through this means. Future projects will require new ways of thinking about highway finance and project prioritization, especially in cases where private investment may be involved.
Public controversies have recently surrounded CPTC's use of the "non-compete" franchise provision to limit corridor improvements by Caltrans, and the attempt to sell the project to a separate non-profit corporation. It seems likely that the recent significant decrease in commuters' approval of variable tolls reflects these controversies. Nevertheless, survey respondents are generally positive about innovative pricing, specifically high occupancy toll (HOT) lanes, for expanding travel opportunities.
The jury is still out with regard to the acceptability of public-private partnerships for accelerating the development of needed highway capacity. The non-compete provision between CPTC and the State has apparently led to an impasse in this public-private relationship, which must be resolved in order for the 91X facility to continue as a private sector enterprise. To participate in a project like this, it seems reasonable that a private investor would seek some form of assurance that the State will not arbitrarily build competing capacity which severely undercuts the business. Yet it is also essential for the State to be free to improve nearby highway sections to maintain an equitable level of service and traffic safety comparable to other heavily traveled sections of the regional highway network. Suitable criteria to balance these legitimate interests have not yet emerged.
The State Route 91 Express Lanes project remains unique in its particular combination of operational and institutional characteristics. The project is poised to undergo additional changes in years to come, in terms of project ownership and organization, in the nature of the competitive relationship with public highways, and in the project's interfaces with new transportation investments in the vicinity. How these changes play out will continue to provide useful lessons for innovative transportation projects in other settings.
End Notes
- Sullivan, Edward C. Evaluating the Impacts of the SR 91 Variable-Toll Express Lane Facility -- Final Report. Applied Research and Development Facility, Cal Poly State University, San Luis Obispo CA. May 1998.
- The Eastern Toll Road is part of a 67-mile network of public toll highways in Orange County, developed and operated by the Transportation Corridor Agencies. See Section 1.2 for further details and maps.
- The first three topics are related to traffic trends, for which the details are found in Chapter 2. The next five topics are related to travel behavior revealed in survey data, for which the details are found in Chapter 3. The remaining topics correspond on a one-to-one basis to Chapters 4 through 7, respectively.
- The multivariate choice modeling estimated values of time for the entire peak period at about $16/hour.
- Sullivan, Edward C. Evaluating the Impacts of the SR 91 Variable-Toll Express Lane Facility -- Final Report. Applied Research and Development Facility, Cal Poly State University, San Luis Obispo CA. May 1998.
- Throughout the report, the acronym "91X" refers to the 10-mile long variable toll express lane facility, while "SR 91" refers to the entire highway, both freeway and toll lanes.
- A cross-section sketch appears in Exhibit 6-B.
- Maps provided by www.mapquest.com. (© 2000 MapQuest.com, Inc.; © 2000 GDT, Inc.)
- Transportation Corridor Agencies. 1999 Annual Report (available at http://www.tcagencies.com/).
- For further technical details regarding transponders, see http://www.ettm.com/avi.html
- See http://www.sirit.com/body_main.html for more information on SIRIT transponders.
- See http://www.mfsdatanet.com/mfs-network-technologies/ for information about MFS Network Technologies.
- CPTC charges, promotions, and related matters can be seen at http://www.91expresslanes.com/
- In December, 2000, CPTC announced that, except for the minimum $0.75 rate, most tolls are being increased on January 2, 2000. The new maximum toll is $4.25. Details of the current toll schedules are posted on-line at http://www.91expresslanes.com.
- California Private Transportation Company. 1999 Annual Report.
- A price elasticity is a standard measure of the sensitivity of demand to changes in price. Specifically, it is the percent change in the measure of demand (e.g., toll lane patronage) divided by the percent change in price.
- The multivariate choice modeling reported in Chapter 5 estimated values of time at about $16/hour.
- Tests for serial auto-correlation were made for all the time-series regressions reported in this chapter. In all cases, no significant auto-correlation was found.
- Map provided by www.mapquest.com (© 2000 MapQuest.com, Inc.; © 2000 GDT, Inc.)
- To provide a smoother display, the 91X toll lane traffic, which is reported on an hourly basis, was smoothed to 15 minute time slices based on the underlying hourly time of day distribution.
- Friday tolls are higher, but they are not shown here since the traffic data being discussed contain only Tuesday-Thursday observations. See Exhibit 1-H.
- These peak hour values of time must be distinguished from the overall peak period values of time of about $16 per person per hour estimated in the choice modeling work of Chapter 5. Since the latter values apply to all peak period commuters and are derived through multivariate analysis, they are more robust than the spot peak hour estimates derived here.
- The total sample size of the 1996 survey of bus riders was 35. Of these, only one person was not commuting in the corridor the year before.
- After July 1997, the weekday midday observation and most weekend observations were eliminated.
- Site numbers correspond to locations shown in Exhibit 2-G and Exhibit 2-H. Sites numbered C1 through C5 are control sites used during the early part of the study to test for possible regionwide background changes, which were not found.
- Sites flagged by asterisks are locations of HOV lanes or toll lanes. Dates appear by special lanes which opened while the study was underway.
- Zone #s are defined by the "Modcomp" system of surveillance loops which cover the freeways throughout Orange and Los Angeles Counties. Postmiles are approximate. Nearby zones were often substituted for missing observations.
- The material in this chapter draws extensively on technical memos written by Kimberley Mastako, Dina Cadenazzi, and James Daly.
- The telephone surveys were conducted by our subcontractor, SCR (Strategic Consulting and Research), a survey research firm located in Irvine, California.
- Sullivan, Edward. Evaluating the Impacts of the SR 91 Variable-Toll Express Lane Facility -- Final Report. Applied Research and Development Facility. Cal Poly State University. San Luis Obispo CA. May, 1998. On-line at the address identified below:
- http://ceenve.calpoly.edu/sullivan/sr91/sr91.htm
- To clarify statements on significance at the 1% or 5% levels, the estimated a-values are shown. An a- value is the probability that the Chi-square statistic would have the value estimated if the data being compared are actually from the same distribution. The larger this value, the less likely a significant difference exists. Therefore, the 5% level, while generally regarded as significant, is not as strong a difference as the 1% level.
- Due to model shifts between 1996 and 1999, the panel members in each mode group are not all the same people.
- Our earlier study report published in May 1998 used 40% as the threshold for "frequent" use.
- In questions of this type, respondents were asked to give their reasons but were not prompted with specific choices. Whatever answers they gave were, where possible, fit into the predetermined categories shown. Some respondents gave multiple reasons and all were recorded.
- See Section 3.1 for descriptions of the four samples: the Random Dial, the Panel, the New License Plates, and the U.C. Irvine components of the survey.
- Unfortunately, since neither our Panel sample or the U.C. Irvine sample were originally intended to be matched with data collected in 1999, the number of "survivors" in each of these data sets was small. See Section 3.1.
- When drawing a sample from a small population, like the population of HOV3+ commuters on SR 91, the unadjusted sample size can be adjusted downward to take the small population size into account. This adjustment is described later in the section.
- As it turns out, 236, 78, and 35 Panel respondents were contacted, which theoretically reduces by about 300 the needed sample of new SOV commuters, so by approach the total target sample would be 1700, rather than 2000.
- The material in this chapter draws extensively on technical memos written by Kimberley Mastako, Dina Cadenazzi, and James Daly.
- http://ceenve.calpoly.edu/sullivan/sr91/sr91.htm
- All reported approval rates are obtained by dividing the number of respondents saying they think the concept is a good idea by the total number of persons who responded. Thus, roughly 10% of respondents who expressed no opinion are counted as opposed to the concept. The effect is that the reported approval rates are a few percentage points less than if we only counted persons who expressed positive and negative opinions.
- Unless otherwise noted, the significance levels reported in this chapter were determined using Chisquare tests. For these tests, the a-probabilities, which were calculated by the analysis software, are also shown, in the form "Pr. =a." See Section 2.15 for a detailed description of the statistical methods used.
- As with similar displays in Chapter 3, Figure 4-9 provides a breakdown of all answers given, which in some cases include multiple responses from the same individual. The question was asked in an openended manner, and responses were then fit into pre-coded categories to the extent possible.
- The original version of this section was written by Dina Cadenazzi.
- The body of this chapter was written by Jia Yan and Kenneth A. Small. Section 5.11, which deals with network development, is based on a senior project by Kari Blakely.
- This moderately price-inelastic response is similar to elasticities estimated for many other commuter traffic applications.
- The standard errors shown here are those provided by the program STATA, which does not account for all the subtleties of the WESMLE estimator. The correct formula for standard errors is presented in the appendix (Section 5.10). The formula used by STATA omits the last two matrices multiplied together in equation (5-4). Those two matrices are very close to inverses of each other when the weights are close to one, and we calculated them numerically for selected models to verify that they are in fact close. Therefore the difference they make to the standard errors is minor.
- That is, each individual in the enumeration sample is assigned the same weight as in the estimation process. The reason for this is that the weight reflects the (relative) number of individuals in the population for whom this sample member is representative.
- See Sections 3.1 and 3.14 for detailed descriptions of the survey sampling procedures.
- We could equivalently have used dummy variables HOV2 and HOV3, instead of HOV and HOV3; but the way we have done it makes it easier to specify one set of influences on all carpools and another specifically on larger carpools.
- Using the joint logit, we also estimated the entire model on commuters only, with little difference in results; see the Appendix Table 5-XVIII.
- These are very approximate statements because the coefficients of inclusive value enter the probability formula in a quite nonlinear manner (note they appear in both fractions in equation 5-3, and previous studies have shown that the distribution of the estimates of these parameters are likely to by highly skewed.
- In this model, k represents time of day rather than mode, and hence the sum in the denominator on the right has 5 rather than 3 terms.
- The FPMS web site address is: http://transacct.eecs.berkeley.edu/
- The real-time L.A./Orange County traffic web site address is: http://www.smartraveler.com/
- TASAS = "Traffic Accident Surveillance and Analysis System."
- Recent ADTs for SR 91 at the Weir Canyon Rd. interchange were compared to those at Imperial and found to be about 7% less, a difference viewed as tolerable.
- Accident rates are expressed in collisions per million vehicle-miles (MVM), obtained by dividing the quarterly count of reported weekday collisions in the section by the quarterly vehicle-miles, which is obtained by multiplying the quarterly ADT by the section length and the number of weekdays in the quarter (65). The resulting rates are multiplied by the scaling factor 1,000,000. Peak rates are found by dividing the number of collisions reported 4-10 AM westbound and 2-10 PM eastbound (respectively, southbound and northbound for SR 57) and dividing by 37% of the corresponding vehicle-miles.
- This section contains a number of findings regarding the statistical significance of differences in accident rates. Most of these use a one-tailed test for the difference between two independently estimated means. Some other findings are based on regression analysis, where noted in the text. Both statistical methods, as well as the meaning of statistical confidence tests generally, are described in detail in Section 2.15.
- Tests for serial autocorrelation were made in connection with all the time-series regressions reported in this chapter. In each case, no autocorrelation was found.
- For example, see Sullivan, E. Estimating Collision Benefits of Reduced Freeway Congestion. Journal of Transportation Engineering. Vol. 116, #2, March/April, 1990.
- Only the weaving section at the eastern terminus of the 91X lanes is shown. The sections at the western terminus (located on SR 91 and on SR 55) involve a single HOV lane and a single Fastrak lane, connected by a weaving section open to everyone.
- The highway sections are identified at the beginning of this section of the report. Where a difference is statistically significant, the significance level appears in the table in the form a=.01 or a=.05. The smaller the a-value, the less likely it is that the difference isn't significant but occurred due to random variation.
- This section reports a number of findings which are based on tests of the differences between estimated proportions. This statistical test is described in detail in Section 2.15.
- This chapter is taken from a senior project written by Joseph Gilpin.
- On-line at: http://transacct.eecs.berkeley.edu/
- Sirpress, Alan, Are More Lanes Better? Not Necessarily. Washington Post, January 13, 2000
- Sullivan, Edward. Evaluating the Impacts of the SR 91 Variable-Toll Express Lane Facility - Final Report. Applied Research and Development Facility, Cal Poly State University. May 1998.
- California Air Resources Board. Methodology for Estimating Emissions From On-Road Motor Vehicles. Volume I: Introduction and Overview. Technical Support Division, Mobile Source Emission Inventory Branch. November 1996.
- California Air Resources Board. Methodology for Estimating Emissions From On-Road Motor Vehicles. Volume II: EMFAC7G. Technical Support Division, Mobile Source Emission Inventory Branch. November 1996.
- Map provided by www.mapquest.com (© 1997 GeoSystems Global Corp.; © 1997 NavTech).
You may need the Adobe Acrobat Reader to view the PDFs on this page.
