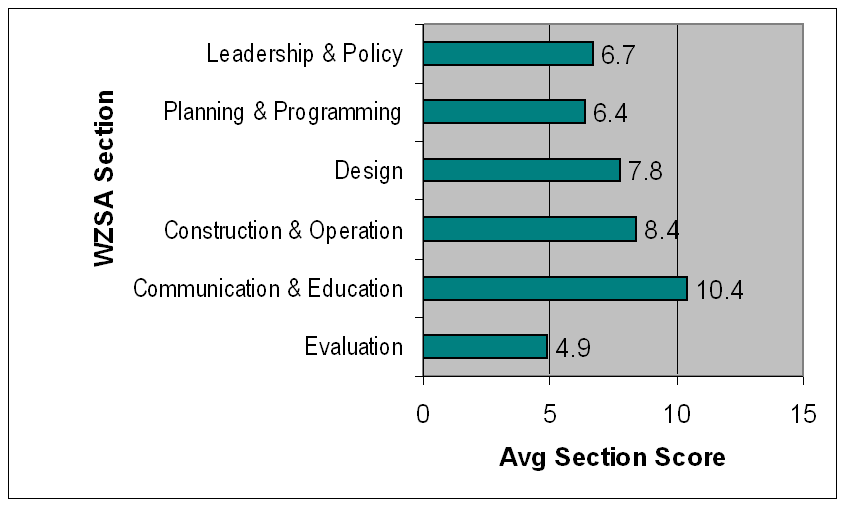
Description of 2004 Work Zone Self Assessment Results

Description
This bar graph shows the average section scores from 0 to 15 for various work zone self assessment sections:
- Leadership & Policy – 6.7
- Planning & Programming – 6.4
- Design – 7.8
- Construction & Operation – 8.4
- Communication & Education – 10/4
- Evaluation – 4.9
