Description of What Did the Public Notice?
Description
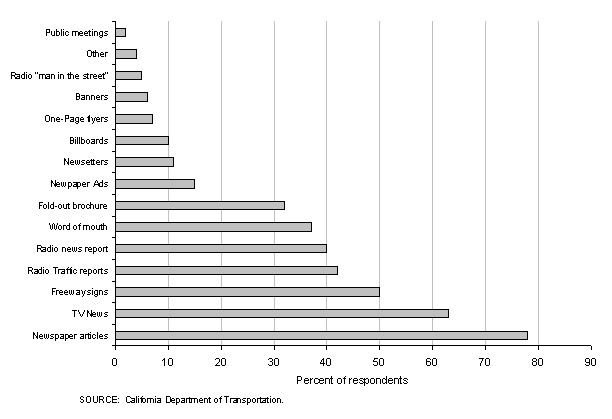
This bar graph shows the results of a public survey performed by the California Department of Transportation. Media categories and Communication outlets are listed vertically with percent of respondents running horizontally on the graph. The results of the survey are as follows:
- Public Meetings, 2 percent responding.
- Other, 3 percent responding.
- Radio "Man In The Street," 4 percent responding.
- Banners, 5 percent responding.
- One-Page Flyers, 7 percent responding.
- Billboards, 9 percent responding.
- Newsletters, 11 percent responding.
- Newspaper Ads, 14 percent responding.
- Fold-Out Brochure, 32 percent responding.
- Word of Mouth, 36 percent responding.
- Radio News Report, 40 percent responding.
- Radio Traffic Report, 42 percent responding.
- Freeway Signs, 50 percent responding.
- TV News, 63 percent responding.
- Newspaper Articles, 78 percent responding.