
|
|
||
|
|
Self-Assessment for TIM ProgramsThe purpose of the Traffic Incident Management Self-Assessment (TIMSA) is to provide a formal process for State and local transportation, public safety, and private sector partners to collaboratively assess their traffic incident management programs and identify opportunities for improvement. The TIMSA is now available year round, and it is now accessible online. Register here to complete the TIMSA. In 2003, the Federal Highway Administration (FHWA) facilitated the initial assessments of Traffic Incident Management (TIM) programs in the largest 75 urban areas of the United States. Representatives of key transportation and public safety agencies and private sector partners in each area conducted the assessments. In the year 2020, 100 State and regional TIM programs completed the TIMSA. 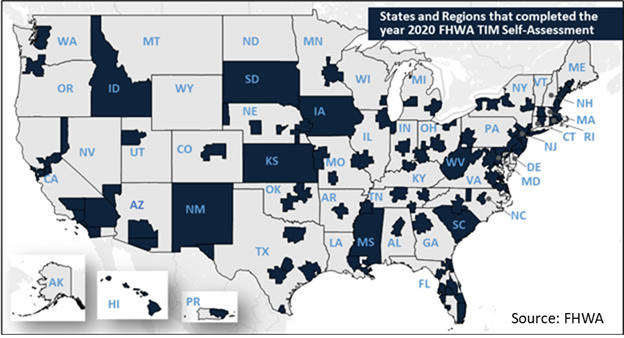
States and Regions that completed the year 2020 FHWA TIM Self-Assessment - States - Idaho, South Dakota, Iowa, New Mexico, Kansas, Mississippi, New Jersey, Hawaii and South Carolina. Regions within states that completed TIM Self-Assessment - Washington, Orgegon, California, Nevada, Utah, Arizona, Colorado, Nebraska, Minnesota, Missouri, Oklahoma, Texas, Arkansas, Illinois, Wisconsin, Michigan, Indiana, Ohio, Kentucky, Tennessee, Alabama Georgia, Florida, North Carolina, Virginia, Maryland, Delaware, Pennsylvania, New York, Connecticut, Massachusetts, New Hampshire, Maine, Alaska, and Puerto Rico.
The TIMSA annual assessments have enabled state and local program managers and practitioners to evaluate their TIM programs and identify strengths and weaknesses in their programs in order to prioritize program activities and initiatives. Each year, the new assessment is compared against the baseline established in initial assessments in the years 2003 and 2004 and against the previous year's assessment. At a national level the assessments enable FHWA to evaluate progress in traffic incident management and to identify national TIM program initiatives. In 2007, 2011, and 2015 the TIMSA was revised slightly to incorporate performance metrics, organize, and rephrase some of the questions to better align with the National Unified Goal (NUG) for TIM and the National Incident Management System (NIMS). The assessment consists of questions covering the three main TIM program areas. These are:
The graph below shows the number of programs completing the TIMSA and their average score. 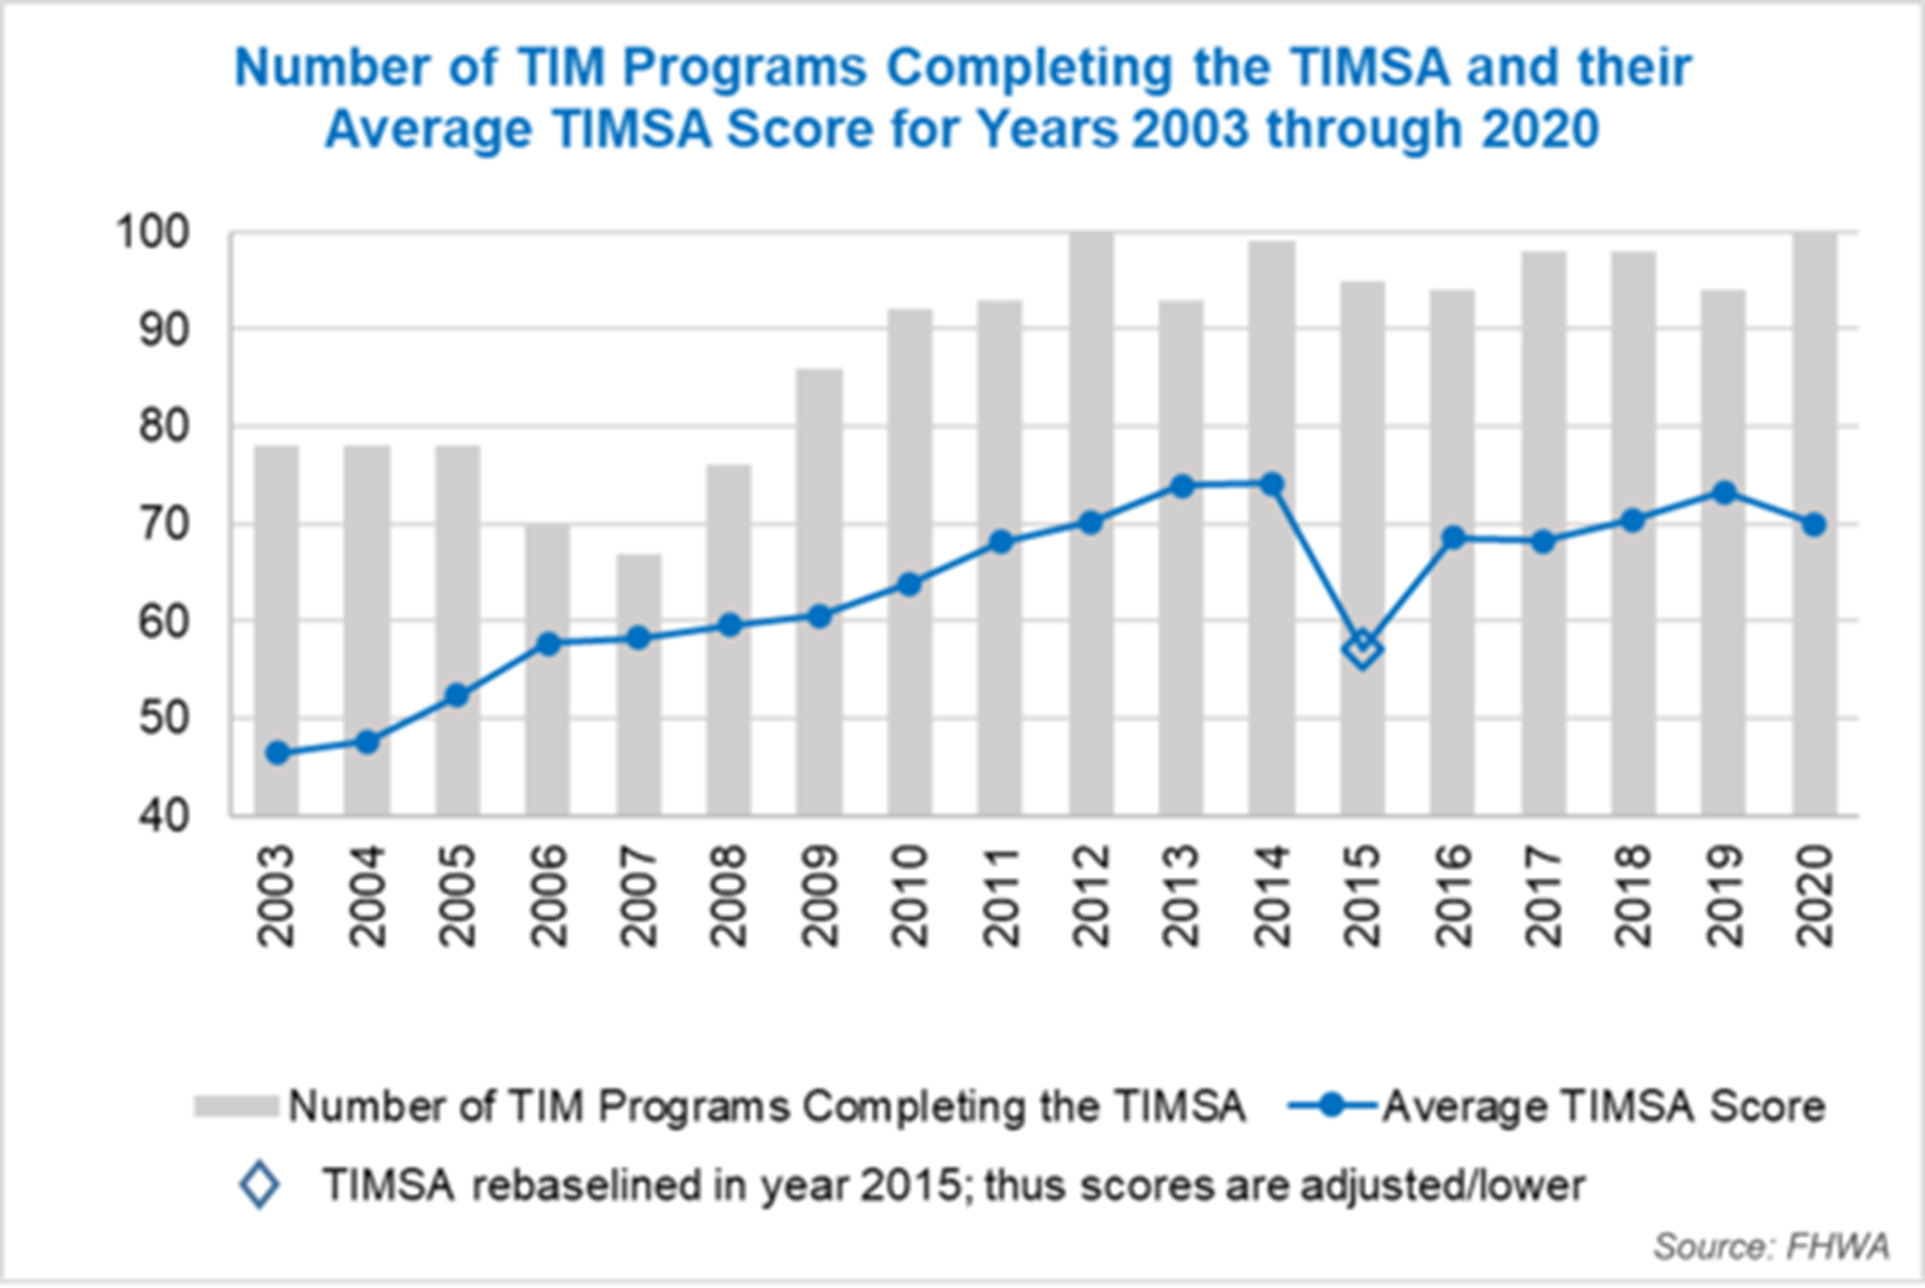
FHWA publishes an annual National Summary report on the TIMSA. The following table includes links to National Summary Reports for the TIMSA for 2003 through 2020.
*Minor revisions to the TIMSA implemented these years. |
|||||||||||||||||||||||||||||||||||||||||||||||||||||||||||||||||||||||||||||||||||||
| US DOT Home | FHWA Home | Emergency Transportation Operations Home | Operations Home | Privacy Policy | ||||||||||||||||||||||||||||||||||||||||||||||||||||||||||||||||||||||||||||||||||||||