2013 Traffic Incident Management National Analysis Report
| |||||||||||||||||||||||||||||||||||||||||||||||||||||||||||||||||||||||||||||||||||||||||||||||||||||||||||||||||||||||||||||||||||||||||||||||||||||||||||||||||||||||||||||||||||||||||||||||||||||||||||||||||||||||||||||||||||||||||||||||||||||||||||||||||||||||||||||||||||||||||||||||||||||||||||||||||||||||||||||||||||||||||||||||||||||||||||||
| Top 40 metros: | 79.4 percent |
| Top 75 metros: | 75.0 percent |
| Top 76-150 metros: | 70.3 percent |
| Overall: | 73.9 percent |
|---|
A listing of all 34 TIM SA questions, their respective Baseline and 2013 scores, and the percentage of programs scoring each question 3 or higher1 can be found in Appendix A.
| Section | # of Questions | Mean Score (percent) | High Score 2013 (possible) | Change in scores from Baseline (percent) | Section Weights (percent) | |
|---|---|---|---|---|---|---|
| Baseline | 2013 | |||||
| Strategic | 12 | 35 | 59.8 | 29.7 (30) | 70.8 | 30 |
| Tactical | 16 | 64.1 | 80.6 | 39.7 (40) | 25.8 | 40 |
| Support | 6 | 39.4 | 79 | 30.0 (30) | 100.4 | 30 |
| Overall | 34 | 48 | 73.9 | 97.4 (100) | 54 | 100 |
The questions in the Strategic section asked respondents to rate progress in how the TIM program is organized, resourced, supported and sustained. Key elements of this section include multi-agency coordination and TIM performance measures. While the strategic section had the lowest score of the three sections (59.8 percent), the strategic questions have realized a 70.8 percent increase compared to the Baseline, indicating improvement in this area.
Despite progress in the Strategic area, the five questions receiving the lowest mean score in the TIM SA were all in this section, with four out of five coming from the subsection on TIM Performance Measurement. The questions on TIM Performance Measurement have consistently been among the lowest scoring on the TIM SA. The TIM Performance Measurement subsection focused on three key metrics: Roadway Clearance Time (RCT), Incident Clearance Time (ICT), and reduction of secondary incidents. Of the three performance measures, reduction in secondary incidents (Question 4.1.3.5) had the lowest score (1.11). This low score is only a 7.5 percent improvement over the Baseline and is the lowest scoring individual question in the 2013 TIM SA. Almost half of respondents (46.2 percent) stated that there was "no activity" in this area. The comments indicate that several areas have recently begun to track secondary incidents or have started to develop a process for collecting the data. This suggests that scores should rise in the future; however, the improvement will likely be gradual. Continued improvement in scores would be furthered by focusing FHWA's education and outreach efforts on the importance of tracking and reducing secondary incidents.
Another important part of the TIM SA is the TIM Performance Measures (PM) Database. This database is populated annually based on responses to the TIM SA. Information on the three key PM metrics (RCT, ICT, and secondary incidents) is tracked annually and compared to a Baseline (2011) level. RCT increased to an average of 73.16 minutes in 2013 compared to 67.12 minutes in 2012 (9.0 percent increase). While the increase in RCT is worrisome, a comparison of locations that submitted data for both 2012 and 2013 revealed that average RCT actually declined for those locations (68.90 minutes in 2013 compared to 70.29 minutes in 2012, a 2.4 percent decline). The increase in overall RCT in 2013 is therefore due to new data from locations that previously did not report RCT data. As the TIM PM Database continues to grow, this type of issue should become less and less problematic.
In terms of ICT, the overall average time declined by 16.0 percent from 2012 to 2013 (67.32 minutes in 2012 versus 56.58 minutes in 2013). However, among repeat respondents from 2012, ICT increased by 1.2 percent (55.66 minutes in 2012 versus 56.34 minutes in 2013).
Due to the nascent state of secondary incident tracking, only 15 locations submitted data on secondary incidents in the 2013 TIM SA. In 2013, those locations reported that secondary incidents constituted 2.8 percent of all incidents, which was a decline compared to the 3.8 percent reported in 2012. However, an analysis of repeat respondents found that secondary incident share increased to 4.9 percent in 2013 from 3.8 percent in 2012. Again, the accuracy and precision of the TIM PM Database is expected to increase over time as more locations consistently report PM data through the TIM SA.
In addition to questions on performance measures, the Strategic section included other areas with room for improvement. Question 4.1.2.1 on the multi-agency agreements/MOUs used to structure TIM programs scored low (1.92) and provides guidance to FHWA on where added focus is needed. This question was divided into four composite questions to query specific elements of multi-agency coordination:
This question had the second lowest score (1.92) in the 2013 TIM SA, which was only a 12.6 percent increase compared to the Baseline. The lowest scoring of the four composite questions was Part C, regarding defined agency roles for planning and funding (1.45). The low scores in this question suggest that many TIM programs lack a formal structure for multiagency collaboration. Furthermore, even in locations that do have formal agreements, many do not have a process in place to systematically review and renew these agreements. Respondents were asked how frequently the agreements/MOUs were updated and "as needed" was the most frequently cited response. It is important to establish a planned, systematic review and update process for these agreements in order to promote program continuity. This is of particular importance when there is turnover in coordination contacts at participating agencies.
The highest score in the Strategic section was achieved in planning for special events (4.1.1.4) with a mean score of 3.47. Planning for special events was the eighth highest scoring question overall in the 2013 TIM SA. The score for this question was the composite average of individual scores in planning for the following types of events: Construction and Maintenance; Sporting Events, Concerts, Conventions; Weather-related Events and Catastrophic Events. Among those four categories, Weather-related events (4.1.1.4.c) and Construction and Maintenance (4.1.1.4.a) achieved the highest mean scores of 3.53 and 3.51, respectively. Catastrophic events received the lowest score of the four event types (3.39). While this is a relatively high score, areas that have not incorporated planning for catastrophic events in their TIM programs should consider doing so. Catastrophic events are by their very nature unpredictable and often create high levels of confusion in very serious situations, making planning for these scenarios all the more important.
The TIM programs that achieved the highest scores in the Strategic section are listed alphabetically in Table ES2. Jurisdictions with lower scores may wish to reach out to these locations for information on best practices.
| TIM Program |
|---|
| Alachua – Bradford Counties, FL |
| Jacksonville, FL |
| Kansas City, MO/KS |
| Miami – Dade, FL |
| Norfolk – Virginia Beach, VA |
The questions in Tactical focused on the policies and procedures used by TIM professionals when responding to incidents. This includes the policies and procedures in place to ensure motorist and responder safety. Collectively, these questions continue to score among the highest in the TIM SA which bodes well for improving safety at incident scenes. In 2013 this section achieved an overall score of 80.6 percent, making it the highest scoring of the three sections. Four of the five questions achieving the highest mean score in the 2013 TIM SA were in the Tactical section.
Safe, quick clearance (SQC) laws are a key element of the Tactical section. Question 4.2.2.1 on Move Over laws received the highest mean score (3.69) in the Tactical section, indicating a high degree of success in promulgating Move Over laws. Question 4.2.1.1 on Authority Removal had a mean score in 2013 of 3.38. The third SQC law, Driver Removal (4.2.1.2), scored 3.05 in 2013. Scores for all three laws continue to trend upward; however, Driver Removal had the smallest increase over the Baseline (1.3 percent) in the 2013 TIM SA, suggesting a need for education on the importance of enacting Driver Removal laws. Additionally, more work needs to be done on the implementation of each of the SQC laws. All three of these questions were composite scores that first asked if the law existed and then asked if the jurisdiction applied, communicated, or enforced the law (depending on the law in question). All three laws had lower scores in the execution element of the composite score. While passage of the laws is important, there will be no safety benefits if the laws are not applied. Specifically, Driver Removal laws had the lowest implementation score, which is likely one of the reasons this question had the lowest score of the three SQC law questions.
The lowest scoring question in the Tactical section dealt with equipment staging and lighting procedures that maximize traffic flow around the incident while also protecting responders (4.2.2.5). While the score for this question has increased 72.2 percent compared to the Baseline, the relatively low mean score of 2.38 suggests there is still work to be done toward reaching a consensus on how responder equipment should be utilized during incident response. This question queried respondents about four specific types of procedures and received the following scores:
As has been the case in the past, the use of PPE by responders received the highest score of the four procedures queried, while vehicle and equipment staging procedures received the second highest score. The comments suggest that many TIM programs lack training and formal procedures on how responder vehicles should be staged, which can lead to inefficient and dangerous situations. Light-shedding was the second-lowest scoring procedure, indicating the need for more outreach on proper light-shedding procedures. The comments indicate that light shedding is performed on an ad hoc basis and depends on the specific individual or agency assigned to the incident. Finally, signed accident investigation sites again scored the lowest of the four procedures. Research on the use of accident investigation sites, which quantifies their value for improving responder safety and reducing secondary incidents, may be necessary.
Continued dissemination of the (SHRP 2) National TIM Responder Training Course by FHWA should improve the scores for these four sub-questions. It should be noted that scores for this question increased by 11.3 percent compared to 2012. This was one of the largest year-over-year increases in the 2013 TIM SA and may be indicative of the success of the SHRP 2 training to date.
In the 2012 TIM SA, question 4.2.1.3 on the use of Safety Service Patrols (SSPs) for incident response was flagged as an area to monitor due to declining scores and poor performance relative to the Baseline. Fortunately, the trend of declining scores did not continue in 2013 as the mean score rose 3.8 percent to 2.78. However, this score is only slightly higher than the Baseline (2.0 percent), which indicates continued stagnation in the area of SSP promulgation. The good news is that only 8.6 percent of respondents have no SSP whatsoever, while 31.2 percent of respondents classified their SSP as "full function." The most room for growth in scores lies in those areas with some semblance of an SSP which could expand coverage to include more hours, more services, and longer routes.
The TIM programs that achieved the highest scores in the Tactical section are listed alphabetically in Table ES3. Jurisdictions with lower scores may wish to reach out to these locations for information on best practices.
| TIM Program |
|---|
| Chattanooga, TN |
| Cincinnati, OH |
| Lee – Charlotte Counties, FL |
| Miami – Dade, FL |
| Norfolk – Virginia Beach, VA |
| Salt Lake City, UT |
| Seattle, WA |
| West Palm Beach, FL |
The questions in the Support section focused on the tools and technologies enabling improved incident detection, response, and clearance. Without the infrastructure and back office support for incident information exchange, detection, verification, response, and clearance times are delayed and responder and motorist safety is jeopardized. As a result, one of the three key objectives of the National Unified Goal for Traffic Incident Management is prompt, reliable, interoperable communications.
The support section had the second highest overall score of 79.0 percent and had the largest increase compared to the Baseline of the three sections (100.4 percent). The rapid increase in scores indicates that technology and data analysis are becoming increasingly prevalent in TIM operations.
The use of a Traffic Management Center/Traffic Operations Center (TMC/TOC) to coordinate incident detection, notification, and response (4.3.1.1) again scored the highest of the questions in the Data subsection with a mean score of 3.61, representing an 82.5 percent increase compared to the Baseline. After declining in score between 2011 and 2012, the score for this question rebounded in 2013 by 5.5 percent. The increase in score was predicted this year as most respondents in the 2012 TIM SA indicated that TMC/TOC expansions and upgrades were in the planning stages.
Traveler information services have also seen a considerable increase in score compared to the Baseline as a result of technological advances. The provision of travel time estimates to motorists (4.3.2.2) achieved one of the highest percentage increases from the Baseline (217.1 percent). This was yet another question that saw a drop in score between 2011 and 2012 only to increase markedly in 2013. It appears the 2012 results were only a slight aberration in an otherwise upward trajectory.
While the Support section was filled with many high-scoring questions, a few questions suggest room for improvement. Specifically, question 4.3.1.3 on procedures for traffic management during incident response had the lowest score in the Support section (2.34) and the smallest change compared to the Baseline (50.9 percent) in the section. Scores for this question are derived from two composite questions on signal timing changes and pre-planned detour routes. Signal timing changes had the lower mean score of 2.01, compared to 2.67 for pre-planned detour routes. Even in locations where remote signal timing changes can be performed, the comments indicated that many locations lacked a partnership between TIM agencies and the entities with the authority to control the traffic signals. A similar lack of cross-agency and cross-jurisdictional coordination on detour route planning was also evident through an analysis of the comments.
Another area with room for improvement dealt with interoperable, interagency communications between responders (4.3.1.4). The mean score for this question was 2.91, which was an 81.0 percent increase compared to the Baseline. Each year the comments reveal that more locations are implementing programs to improve communication among responders. For the first time in 2013, zero respondents indicated absolutely no activity in this area, which means that all areas had at least some interagency communications. However, improvements still need to be made as only one-third (34.4 percent) indicated a high level of activity. The inability of responders to communicate on-scene is a significant obstacle to SQC.
The TIM programs that achieved the highest scores in the Support section are listed alphabetically in Table ES4. Jurisdictions with lower scores may wish to reach out to these locations for information on best practices.
| TIM Program |
|---|
| Alachua – Bradford Counties, FL |
| Brevard County, FL |
| Kansas City, MO/KS |
| Marion County, FL |
| Orlando, FL |
| Salt Lake City, UT |
| Seattle, WA |
| Sumter – Lake Counties, FL |
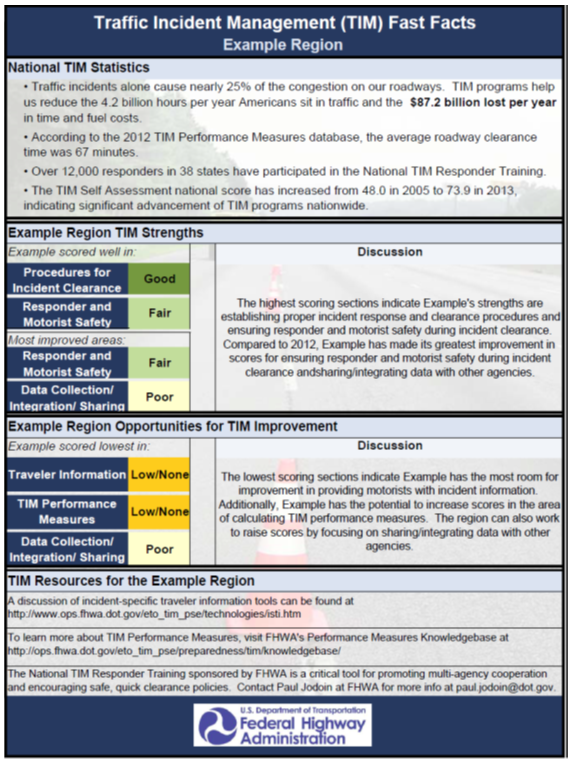
As an added function of the 2013 TIM SA, each location received a customized TIM Fast Facts report as part of their TIM SA submission. These reports are intended to provide TIM stakeholders in each location with a quick, one-page summary of what that location is doing well, areas in need of improvement, and resources to help advance TIM in the region. The content for this report is generated based on that location's highest scoring, lowest scoring, and most improved subsections. At the beginning of each report, a series of national TIM statistics is presented to show the importance of TIM and how TIM has advanced over the past decade. The next section discusses the areas where the location scored well by highlighting the subsections with the highest mean scores and largest year-over-year increases in score. Following that section, the focus shifts to areas in need of improvement by presenting the three subsections with the lowest mean scores. Finally, three resources are listed that could be used by TIM stakeholders in that location to improve TIM SA scores. These resources are customized based on the subsections with the lowest scores. An example fast facts report is included in Appendix B.
A total of 93 TIM SA were completed in 2013, with an average overall score of 73.9 percent (out of a possible 100 percent). Overall scores were up 54.0 percent compared to the Baseline scores. The TIM SA mean scores tended to be higher in larger metropolitan areas than in smaller localities. Specifically, mean scores were calculated by population for the top 40 largest metropolitan areas, the top 75 largest metropolitan areas, and the top 76-150 metropolitan areas:
| Top 40 metros: | 79.4 percent |
| Top 75 metros: | 75.0 percent |
| Top 76-150 metros: | 70.3 percent |
| Overall: | 73.9 percent |
The highest scores were achieved in Tactical (80.6 percent) and the largest percentage increase in scores from the Baseline was in Support (100.4 percent). Low-scoring questions and those with the least improvement over the Baseline indicate specific program areas where additional guidance from FHWA may be warranted. Specifically, the 2013 TIM SA scores highlight a need for special attention in the following areas:
Based on responses to the 2013 TIM SA, each location was provided with a customized TIM Fast Facts report that can be used to quickly identify TIM program strengths and opportunities for improvement. Additionally, a tailored list of TIM resources was included in the report to assist locations with advancing TIM in the region and improving scores in subsequent TIM SA submissions.
| Question Number | Question | Mean Score Range = 0 to 4 |
Percentage of Assessments Scoring 3 or Higher | Percentage Change in 2013 Mean Scores from Baseline | ||
|---|---|---|---|---|---|---|
| Baseline | 2013 | Baseline | 2013 | |||
| 4.1.1.1 | Have a TIM multi-agency team or task force which meets regularly to discuss and plan for TIM activities? | 1.9 | 2.96 | 28 | 67 | 55.6 |
| 4.1.1.2 | Is multi-agency training held at least once a year on TIM-specific topics?
|
1.26 | 2.7 | 9 | 70 | 114 |
| 4.1.1.3 | Conduct multi-agency post-incident debriefings? | 1.62 | 2.57 | 18 | 56 | 58.6 |
| 4.1.1.4 | Conduct planning for special events?
|
2.47 | 3.47 | 35 | 91 | 40.6 |
| 4.1.2.1 | Is the TIM program supported by multi-agency agreements/memoranda of understanding?
|
1.71 | 1.92 | 18 | 45 | 12.6 |
| 4.1.2.2 | Is planning to support the TIM activities done across and among participating agencies? | 1.35 | 2.43 | 12 | 53 | 80 |
| 4.1.2.3 | Is there someone from at least one of the participating agencies responsible for coordinating the TIM program as their primary job function? | 2.28 | 2.53 | 54 | 54 | 10.8 |
| 4.1.3.1 | Have multi-agency agreement on the two performance measures being tracked?
|
0.64 | 2.31 | 3 | 48 | 260.4 |
| 4.1.3.2 | Has the TIM program established methods to collect and analyze the data necessary to measure performance in reduced roadway clearance time and reduced incident clearance time? | 0.64 | 2.4 | 3 | 54 | 274.7 |
| 4.1.3.3 | Have targets (e.g. time goals) for performance of the two measures? | 1.16 | 2.24 | 4 | 47 | 92.8 |
| 4.1.3.4 | Routinely review whether progress is made in achieving the targets? | 0.74 | 2.06 | 3 | 48 | 179 |
| 4.1.3.5 | Track performance in reducing secondary incidents? | 1.03 | 1.11 | 8 | 17 | 7.5 |
| Question Number | Question | Mean Score Range = 0 to 4 |
Percentage of Assessments Scoring 3 or Higher | Percentage Change in 2013 from Baseline Scores | ||
|---|---|---|---|---|---|---|
| Baseline | 2013 | Baseline | 2013 | |||
| 4.2.1.1 | Have "authority removal" laws allowing pre-designated responders to remove disabled or wrecked vehicles and spilled cargo?
|
2.92 | 3.38 | 67 | 87 | 15.8 |
| 4.2.1.2 | Have "driver removal" laws which require drivers involved in minor crashes (not involving injuries) to move vehicles out of the travel lanes?
|
3.01 | 3.05 | 71 | 81 | 1.3 |
| 4.2.1.3 | Use a safety service patrol for incident and emergency response? | 2.73 | 2.78 | 67 | 74 | 2 |
| 4.2.1.4 | Utilize the Incident Command System on-scene? | 2.55 | 3.57 | 58 | 90 | 40 |
| 4.2.1.5 | Have response equipment pre-staged for timely response? | 2.21 | 3.04 | 41 | 78 | 37.7 |
| 4.2.1.6 | Identify and type resources so that a list of towing and recovery operators (including operator capabilities and special equipment) is available for incident response and clearance? | 2.86 | 3.44 | 67 | 85 | 20.3 |
| 4.2.1.7 | Identify and type resources so that a list of HazMat contractors (including capabilities and equipment) is available for incident response? | 2.89 | 3.45 | 69 | 85 | 19.4 |
| 4.2.1.8 | Does at least one responding agency have the authority to override the decision to utilize the responsible party's HazMat contractor and call in other resources? | 3.22 | 3.57 | 89 | 89 | 11 |
| 4.2.1.9 | In incidents involving fatalities, is the Medical Examiner response clearly defined and understood? | 2.53 | 3.16 | 55 | 78 | 25 |
| 4.2.1.10 | Are there procedures in place for expedited accident reconstruction/ investigation? | 2.59 | 2.98 | 72 | 72 | 14.9 |
| 4.2.1.11 | Is there a policy in place for removal of abandoned vehicles? | 3.47 | 3.59 | 91 | 91 | 3.4 |
| 4.2.2.1 | Have "move over" laws which require drivers to slow down and if possible move over to the adjacent lane when approaching workers or responders and equipment in the roadway?
|
3.2 | 3.69 | 85 | 96 | 15.3 |
| 4.2.2.2 | Train all responders in traffic control following MUTCD guidelines? | 1.97 | 3.06 | 28 | 81 | 55.6 |
| 4.2.2.3 | Routinely utilize transportation resources to conduct traffic control procedures for various levels of incidents in compliance with the MUTCD? | 1.93 | 3.48 | 27 | 85 | 80.5 |
| 4.2.2.4 | Routinely utilize traffic control procedures for the end of the incident traffic queue? | 1.56 | 2.96 | 17 | 63 | 89.6 |
| 4.2.2.5 | Have mutually understood equipment staging and emergency lighting procedures on-site to maximize traffic flow past an incident while providing responder safety?
|
1.38 | 2.38 | 14 | 63 | 72.2 |
| Question Number | Question | Mean Score Range = 0 to 4 |
Percentage of Assessments Scoring 3 or Higher | Percentage Change in 2013 from Baseline Scores | ||
|---|---|---|---|---|---|---|
| Baseline | 2013 | Baseline | 2013 | |||
| 4.3.1.1 | Does the TIM program use a Traffic Management Center/Traffic Operations Center to coordinate incident detection, notification and response? | 1.98 | 3.61 | 41 | 92 | 82.5 |
| 4.3.1.2 | Is there data/video sharing between agencies? | 1.43 | 3.41 | 10 | 82 | 138.4 |
| 4.3.1.3 | Does the TIM program have specific policies and procedures for traffic management during incident response?
|
1.55 | 2.34 | 18 | 55 | 50.9 |
| 4.3.1.4 | Does the TIM program provide for interoperable, interagency communications on-site between incident responders? | 1.61 | 2.91 | 17 | 69 | 81 |
| 4.3.2.1 | Have a real-time motorist information system providing incident-specific information?
|
1.9 | 3.54 | 27 | 91 | 86.6 |
| 4.3.2.2 | Are motorists provided with travel time estimates for route segments? | 0.99 | 3.14 | 12 | 76 | 217.1 |
Note: Statistics and text are for illustration only
1 TIM SA respondents are asked to rate their progress as Low, Medium or High, values which are then translated into a numeric score ranging from 0-4, with 4 being the highest score possible per question. [ Return to note 1. ]
2 Light-shedding refers to the timing and sequencing of incident responders turning off the emergency lights on their vehicles at an incident scene. [ Return to note 2. ]
|
United States Department of Transportation - Federal Highway Administration |
||