2017 Traffic Incident Management National Analysis ReportExecutive SummaryNovember 2017
Office of Operations
Printable version [PDF 291 KB] Notice This document is disseminated under the sponsorship of the U.S. Department of Transportation in the interest of information exchange. The U.S. Government assumes no liability for the use of the information contained in this document. The U.S. Government does not endorse products or manufacturers. Trademarks or manufacturers' names appear in this report only because they are considered essential to the objective of the document. The contents of this report reflect the views of the authors, who are responsible for the facts and accuracy of the data presented herein. The contents do not necessarily reflect the official policy of the U.S. Department of Transportation. This report does not constitute a standard, specification, or regulation. Quality Assurance Statement The Federal Highway Administration (FHWA) provides high-quality information to serve Government, industry, and the public in a manner that promotes public understanding. Standards and policies are used to ensure and maximize the quality, objectivity, utility, and integrity of its information. FHWA periodically reviews quality issues and adjusts its programs and processes to ensure continuous quality improvement. BackgroundThe Federal Highway Administration (FHWA) has used the Traffic Incident Management Capability Maturity Self-Assessment (TIM CM SA) for the past 15 years to evaluate the state of practice in traffic incident management across the country. Originally developed by FHWA in 2002, State and local TIM program managers use the TIM CM SA annually to benchmark and evaluate TIM program success and areas of improvement. The TIM CM SA has undergone a number of revisions over the years to reflect changes in TIM practice. The most significant and recent of these revisions occurred in 2015 to align the TIM SA with the Capability Maturity Framework (CMF).1 Due to the nature of the revisions completed in 2015, a recalibration of the baseline scores was necessary that year to protect the value of the TIM SA as a tool to measure national TIM progress over time. The combined impact of the numerous changes implemented in 2015 resulted in a slight decrease in the 2015 national TIM CM SA score from the 2014 score, but some of that decrease was regained in the 2016 TM CM SA. Figure 1 shows the overall national scores for the past decade, which include major revisions in 2007, 2011 and 2015. 2017 Traffic Incident Management Self-Assessment ResultsIn 2017 a total of 98 locations completed a TIM SA for inclusion in the national analysis, an increase of 4 from 2016. The 55 scored questions contained within the TIM SA were grouped into 3 sections: Strategic, Tactical, and Support. The initial assessments completed in 2003, 2004, and 2005 (78 in total) continue to be used as the baseline scores, although it should be noted that the baseline scores are recalibrated each year that a major revision to the TIM CM SA is completed (2007, 2011, and 2015). 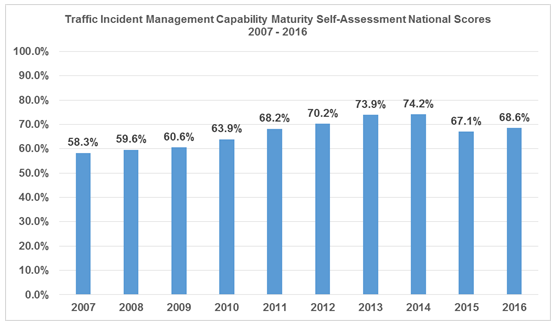 Figure 1. Chart. Traffic Incident Management Capability Maturity Self-Assessment national scores 2007 – 2016.
Table 1 shows the average score for each of the three TIM SA sections from the Baseline and 2016, along with the percentage change from the Baseline.
The 2016 overall TIM SA score was 68.6 percent (out of a possible 100 percent), representing a 35.3 percent increase over the Baseline. The TIM SA mean scores tended to be higher in larger metropolitan areas than in smaller areas. Specifically, mean scores were calculated for the top 40 metropolitan areas (by population), the top 75 metropolitan areas, and non-top 75 metropolitan areas:
As indicated above, the significant revisions implemented in 2015 resulted in an overall decrease in the national score from 2014 to 2015 (down 9.5 percent). The incremental change in the second year post revision was a slight decrease in the overall national score of 0.3 percentage points (-0.5 percent) from 68.6 to 68.3 percent. As will be described in this report, this is primarily attributed to changes made to the TIM Training questions which, while not requiring a recalibrating of baseline scores, did set higher thresholds in the scoring guidance for the TIM Training questions. The TIM CM SA is intended to represent the consensus opinion of the TIM stakeholders completing an annual assessment in each TIM program area (city/region/State). TIM CM SA participants were asked for the first time this year to identify which TIM stakeholders (by stakeholder type, not specific name or agency) were involved in completing the annual assessment. Figure 2 shows the percentage involvement of TIM stakeholder groups in completing this year's assessments 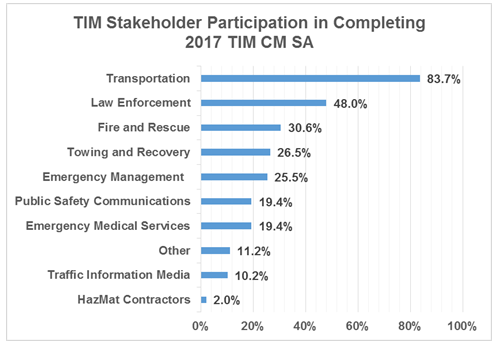 Figure 2. Chart. Traffic incident management stakeholder participation in completing 2017 Traffic Incident Management Capability Maturity Self-Assessment.
A listing of all 55 TIM SA questions, their respective Baseline and 2017 scores, and the percentage of programs scoring each question 3 or higher2 can be found in Appendix A.
StrategicThe 28 questions in the Strategic section are grouped into three subsections: Formal TIM Programs; TIM Training and After Action Reports; and TIM Performance Measures. The Strategic section typically receives the lowest score of the three sections; this has traditionally been the result of low scores on the TIM Performance Measures subsection. The 2017 TIM CM SA is no exception, with the Strategic section achieving a score of 62.4 percent compared to 73.3 percent in Tactical and 69.9 percent in Support. This year's Strategic score represents a 2.3 percent decrease from the 2016 score of 63.9 percent. Changes implemented to the scoring guidance provided for some of the questions in the Strategic section are responsible for this decrease. Question 13 in the TIM Training and After Action Reports subsection asks about the percentage of TIM responders completing the 4-Hour SHRP 2 TIM Responder Training. The scoring guidance for this question, shown in Table 2 below, has been updated each year since 2015 to reflect increased numbers of responders nationally completing the training. According to numbers from FHWA, as of October 2, 2017, over 284,000 individuals have received the training, which represents 24.7 percent of the total responders to be trained.3
As shown in Table 3 below, the average score for that question decreased 19 percent from 2016 and is down 16.8 percent from its baseline in 2015.4
Among locations that submitted a TIM CM SA in 2016 and 2017, the average decrease to the score on Question #13 was 1 point and the average score for new submissions in 2017 was 2.5. Combined, these lower scores corroborate the lower percentage of programs scoring Question #13 at 3 or higher, which was 42.9 percent in 2017 versus the Baseline of 57.9 percent (see Appendix A). Changes were also implemented to the TIM Performance Measures (TIM PM) questions in 2017. FHWA has a companion initiative underway as part of the Every Day Counts (EDC) program to increase "the amount, consistency and quality of TIM data collection" to support "performance measures for evaluating and improving traffic incident response."5 Working with FHWA's EDC team, the TIM PM questions were reworded and reordered to improve the granularity of data collected. As an example, in the 2016 TIM CM SA, questions 19 and 20 asked: 19. How is data for Roadway/Incident Clearance Time being collected? 20. Has the TIM program established TIM performance targets for Roadway/Incident Clearance Time? In 2017, separate questions were created asking how Roadway Clearance Time data and Incident Clearance Time data are collected. Deconstructing the TIM PM questions allows respondents to provide more detailed information (and accompanying score) on each individual TIM PM. Similarly, in the 2016 TIM CM SA there was one question (#24) on the use of TIM PM data to influence operations. In the 2017 TIM CM SA, that question was separated into three questions asking about each individual TIM PM. This change had a corresponding impact on scores as shown in Table 4 below.
Using the same baseline score for each (based on the baseline for the 2016 version of the question), respondents indicated higher scores for using RCT performance data to influence operations than for the other two performance measures. In previous years' TIM CM SA, these lower scores for ICT and Secondary Crash performance data presumably would be masked by a higher score assigned based on the use of RCT performance data to influence operations. Having three separate questions mitigates the impact of that masking and contributes to the lower score for the Strategic section in 2017. The TIM PM subsection is traditionally the lowest scoring of the TIM CM SA subsections each year, but scores have been improving over time, which corresponds with FHWA's increased leadership in this area. The evolution in the collection and use of TIM PM data is evident when looking across scores for the Top 40 metropolitan areas, the Top 75 and all other areas submitting a TIM CM SA. As shown in Table 5 below, where TIM programs are typically more advanced and have resources available for TIM PM collection and analysis, scores across those questions are, for the most part, higher.
Scores for Question #8 in the Strategic section corroborate that the top 40 metropolitan areas typically have better resourced TIM programs capable of collecting and analyzing TIM PM data.
The TIM programs that achieved the highest scores in the Strategic section are listed alphabetically in Table 7 text. Jurisdictions with low scores may wish to reach out to these locations for information on best practices.
TACTICALThe 22 questions in the Tactical section are focused on the following three areas:
The Tactical section continues as the highest scoring of the three TIM SA sections, achieving an overall score of 73.3 percent. Three of the five highest scoring questions on the 2017 TIM SA are in the Tactical section, as part of the Policies and Procedures subsection (Table 8).
High scores in this area can be attributed, in part, to the National TIM Responder Training which emphasizes the need for policies and procedures that provide for responder and motorist safety and quick clearance. Further evidence of where the National TIM Responder Training is making a difference is in the increase in score over the Baseline for questions #48, #49 and #50. 48. Is there a mutually understood procedure/guidance in place for safe vehicle positioning? 49. Are there mutually understood procedures/guidelines in place for use of emergency-vehicle lighting? 50. Are TIM responders following high-visibility safety apparel requirements as outlined in the MUTCD? Combined, these three questions had an average score of 2.96 in 2017, which is a 131.2 percent increase over the Baseline. Response vehicle positioning, emergency-vehicle lighting use and high-visibility safety apparel are part of the curriculum in Lesson 4 (Safe Vehicle Positioning) and Lesson 5 (Scene Safety) in the National TIM Responder Training Course. There are two questions in the TIM SA that query respondents on Safety Service Patrols (#32 and #33). The first asks about the existence of a Safety Service Patrol and the second asks respondents to score the Safety Service Patrol's level of coverage. Nearly 70 percent (69.4 percent) of respondents scored both questions 3 or 4 (with 29.6 percent scoring both questions 4) meaning that there are a large number of Safety Service Patrols across the country that range from mid-level to full-function Safety Service Patrols. Services provided by these Safety Service Patrols include motorist assistance to incident response and clearance, and emergency traffic control and scene management. Furthermore, these Safety Service Patrols range from medium fleets providing service on most major roadways to fleets large enough to provide ample coverage on all major roadways. Sixty-nine percent of the 2017 TIM SA respondents provided information on levels of coverage, with the combined Safety Service Patrol coverage extending over 4,917 centerline miles and 18,532 lane miles (some programs reported centerline, others lane miles). The median centerline miles coverage reported by 2017 TIM SA respondents was 110 miles and the median lane miles coverage was 141 miles. The TIM programs that achieved the highest scores in the Tactical section are listed alphabetically in Table 9. Jurisdictions with low scores may wish to reach out to these locations for information on best practices.
SupportThe Support section had the second highest overall score of 69.6 percent and had the largest increase over Baseline of the three sections (76.1 percent). The questions in Support focused on the tools and technologies enabling improved incident detection, response and clearance. The major revision completed in 2015 removed questions on traveler information, returning the emphasis to the infrastructure and activities that enable incident information exchange between TIM program stakeholders. This allows programs to rate their progress on items over which their TIM program has control. The five questions in the Support section all address TIM data sharing and integration among TIM stakeholders. The highest scoring question in the Support section was Question #51 (below), which scored an average of 3.34, the second highest scoring question on the 2017 TIM SA. 51. Are TIM stakeholders aware of and actively utilizing Traffic Management Center/Traffic Operations Center resources to coordinate incident detection, notification, and response? The questions on data and video sharing between agencies provide greater granularity on the level of data and video sharing. While the two questions achieved similar scores, the TIM data question (as opposed to video) had a higher percentage of TIM SA respondents scoring their program 3 or 4 on Question #48 (Table 10).
The lowest scoring of the five questions in the Support section asks respondents about policies or procedures in place for signal timing changes to support traffic management during incident response, which received an average score of 2.19 in 2017, with just over a third (35.7 percent) of the TIM CM SA scoring this question 3 or higher. A review of the comments submitted with this question indicates that scores may increase over the next several years as more Integrated Corridor Management (ICM) plans are implemented. Signal timing changes to facilitate traffic incident response and traffic management, particularly on routes parallel to those where an incident has occurred, is identified as a key component of a successful ICM plan in FHWA's ICM and TIM primer.6 The TIM programs that achieved the highest scores in the Support section are listed alphabetically in Table 11. Jurisdictions with low scores may wish to reach out to these locations for information on best practices.
SummaryA total of 98 TIM CM SA were completed in 2017, with an average overall score of 68.3 percent (out of a possible 100 percent). Overall scores were up 34.6 percent over the Baseline scores. The TIM SA mean scores tended to be higher in larger metropolitan areas than in smaller areas. Specifically, mean scores were calculated for the top 40 metropolitan areas (by population), the top 75 metropolitan areas, and non-top 75 metropolitan areas:
The highest scores were achieved in Tactical (73.3 percent) and the largest percentage increase in scores from the Baseline was in Support (76.1 percent). Low-scoring questions and those with the least improvement over Baseline indicate specific program areas where additional guidance from FHWA may be warranted The lowest scoring questions on this year's TIM CM SA, were in the TIM Performance Measures subsection and include questions on collection and use of secondary crash data. Data on secondary crashes and for the larger suite of TIM Performance Measures is a key focus of FHWA's Every Day Counts (EDC-4) initiative for 2017-2018. As such, scores in this area should increase in the coming years. Another indicator of potential focus areas for FHWA is on those questions that achieve scores below their Baseline score. In the 2017 TIM CM SA, there were six questions which received an average score below Baseline (Table 12).
As described earlier in this report, the decrease in score from the Baseline on question 13 is the result of changes made to the scoring guidance on percentages of responders trained. Similarly, the three TIM PM questions (20, 24 and 28) were described in the Strategic section of this report and are the result of deconstructing several questions in the TIM PM subsection, which brings more granularity to the scoring for each TIM PM. The decrease in average score below Baseline for question 30 on Driver Removal Laws is the result of additional non-Top 75 locations completing the TIM SA this year. Among the Top 40 Metropolitan areas, the average score for question 30 was 3.1. For the top 75 Metropolitan areas the average score was 3.0. For the 31 non-Top 75 locations submitting a 2017 TIM CM SA, the average score on question 30 was a 2.4. As the National TIM Training course continues to be offered in the non-Top 75 locations, the importance of safe, quick clearance policies and procedures should reverse this trend for questions 30 and 44. APPENDIX A. Summary of 2017 Traffic Incident Management (TIM) Self-Assessment (SA) Results
1 This revision included a renaming of the annual assessment to the TIM Capability Maturity Self-Assessment or TIM CM SA as referred to throughout this report. [ Return to note 1. ] 2 Scores of 3 and 4 indicate the highest levels of progress for a particular question. [ Return to note 2. ] 3 P. Jodoin, "National TIM Responder Training Program Implementation Progress." Unpublished presentation obtained on October 2, 2017. [ Return to note 3. ] 4 Prior to the 2015 TIM CM SA revision, the question on percentage of responders trained was a non-scored supplemental question. [ Return to note 4. ] 5 Federal Highway Administration, Office of Innovative Program Delivery, Center for Accelerating Innovation. EDC-4, Using Data to Improve Traffic Incident Management. Available online at: https://www.fhwa.dot.gov/innovation/everydaycounts/edc_4/timdata.cfm [ Return to note 5. ] 6R. Brewster, J. Bachman, R. Hurtado, and D. Newton. Integrated Corridor Management and Traffic Incident Management: A Primer. Federal Highway Administration, FHWA-HOP-16-035. January 2016. [ Return to note 6. ] | |||||||||||||||||||||||||||||||||||||||||||||||||||||||||||||||||||||||||||||||||||||||||||||||||||||||||||||||||||||||||||||||||||||||||||||||||||||||||||||||||||||||||||||||||||||||||||||||||||||||||||||||||||||||||||||||||||||||||||||||||||||||||||||||||||||||||||||||||||||||||||||||||||||||||||||||||||||||||||||||||||||||||||||||||||||||||||||||||||||||||||||||||||||||||||||||||||||||||||||||||||||||||||||||||||||||||||||||||||||||||||||||||||||||||||||||||||||||||||||||||||||||||||||||||||||||||||||||||||||||||||||||
|
United States Department of Transportation - Federal Highway Administration |
||