2018 Traffic Incident Management Capability Maturity Self-Assessment National Analysis Report
Printable version [PDF 249 KB]
You may need the Adobe® Reader® to view the PDFs on this page.
Contact Information: Operations Feedback at OperationsFeedback@dot.gov

U.S. Department of Transportation
Federal Highway Administration
Office of Operations
1200 New Jersey Avenue, SE
Washington, DC 20590
ops.fhwa.dot.gov
FHWA-HOP-19-007
November 2018
Table of Contents
[ Notice and Quality Assurance Statement ] [ Technical Report Documentation Page ] [ SI* (Modern Metric) Conversion Factors ]
- Executive Summary
- Chapter 1. Introduction
- Chapter 2. Overview
- Chapter 3. Strategic
- Chapter 4. Tactical
- Chapter 5. Support
- Chapter 6. Results Summary
- Appendix. Summary of 2018 Traffic Incident Management Capability Maturity Self-Assessment Results
List of Figures
- Figure 1. Graph. Traffic incident management stakeholder participation in completing 2017-2018 Traffic Incident Management Capability Maturity Self-Assessment.
- Figure 2. Graph. Traffic Incident Management Capability Maturity Self-Assessment national scores 2008 – 2017.
List of Tables
- Table 1. Mean score for each section (Baseline and 2018)
- Table 2. Scoring guidance for traffic incident management training question #13
- Table 3. Traffic incident management training question #13
- Table 4. Traffic incident management performance measures (PM) questions on using PM data to influence operations
- Table 5. Top 40 major metropolitan area scores versus top 75 and non-top 75
- Table 6. Traffic incident management program funding
- Table 7. Lowest scoring questions on 2018 Traffic Incident Management Capability Maturity Self-Assessment
- Table 8. Highest scoring – Strategic
- Table 9. Traffic incident management policies and procedures – highest scoring in 2018
- Table 10. Highest scoring – Tactical
- Table 11. Traffic incident management data and video collection and use
- Table 12. Highest scoring – Support
- Table 13. Low scoring questions realize increase over 2017 average scores
- Table 14. Scores below Baseline
- Table 15. 2018 Traffic Incident Management Capability Maturity Self-Assessment Scores
Executive Summary
The Federal Highway Administration (FHWA) has used the Traffic Incident Management Capability Maturity Self-Assessment (TIM CM SA) for more than 15 years to evaluate the state of the practice in traffic incident management across the country. Originally developed by FHWA in 2002, State and local TIM program managers use the TIM CM SA annually to benchmark and evaluate TIM program success and areas of improvement.
In 2018, a total of 98 locations completed a TIM CM SA for inclusion in the national analysis, matching the number of participating locations from 2017. The 55 scored questions contained within the TIM CM SA were grouped into three sections: Strategic, Tactical, and Support. The initial assessments completed in 2003, 2004, and 2005 (78 in total) continue to be used as the Baseline scores, although it should be noted that the Baseline scores are recalibrated each year that a major revision to the TIM CM SA is completed (2007, 2011, and 2015).
Table 1 shows the average score for each of the three TIM CM SA sections from the Baseline and 2018, along with the percentage change from the Baseline.
| Section | # of Questions | Mean Score (percent) | High Score 2018 (possible) | Percent Change in scores from Baseline | Section Weights (percent) | |
|---|---|---|---|---|---|---|
| Baseline | 2018 | |||||
| Strategic | 28 | 42.4 | 65.0 | 36.5 (40) | 53.4 | 40 |
| Tactical | 22 | 64.6 | 75.0 | 39.4 (40) | 16.1 | 40 |
| Support | 5 | 39.7 | 72.0 | 19.0 (20) | 81.5 | 20 |
| Overall | 55 | 50.7 | 70.4% | 90.4 (100) | 38.9 | 100 |
The 2018 overall TIM CM SA score was 70.4 percent (out of a possible 100 percent), representing a 38.9 percent increase over the Baseline. The TIM CM SA mean scores tended to be higher in larger metropolitan areas than in smaller areas. Specifically, mean scores were calculated for the top 40 metropolitan areas (by population), the top 75 metropolitan areas, and non-top 75 metropolitan areas:
- Top 40 metro areas:75.2 percent.
- Top 75 metro areas:73.3 percent.
- Non-top 75:64.3 percent.
- Overall:70.4 percent.
The significant revisions implemented in 2015 resulted in an overall decrease in the national score from 2014 to 2015 (down 9.5 percent). At 70.4 percent, the 2018 score is now the highest since that revision in 2015.
The TIM CM SA is intended to represent the consensus opinion of the TIM stakeholders completing an annual assessment in each TIM program area (city/region/State). Starting with the 2017 TIM CM SA, participants were asked to identify which TIM stakeholders (by stakeholder type, not specific name or agency) were involved in completing the annual assessment. Figure 1 shows the percentage involvement of TIM stakeholder groups in completing the assessments in 2017 and 2018. All but one stakeholder group, emergency medical services, saw increased participation in the TIM CM SA process in 2018 over 2017.
However, it should be noted that providing this information is optional in the current TIM CM SA, and in 2018 only 13.3 percent of TIM CM SA submittals included information on the stakeholder groups participating in the assessment.
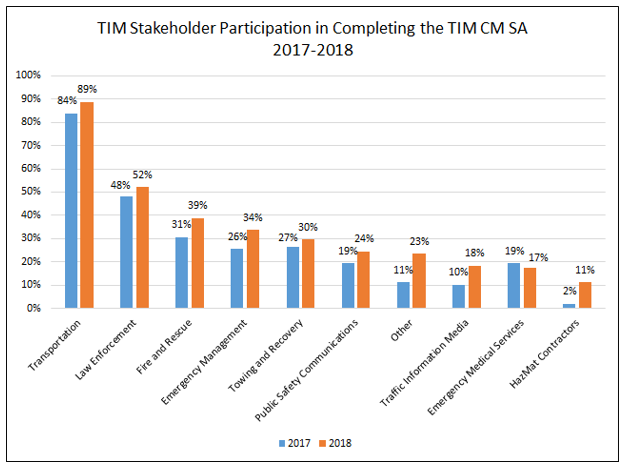
Figure 1. Graph. Traffic incident management stakeholder participation in completing 2017-2018 Traffic Incident Management Capability Maturity Self-Assessment.
A listing of all 55 TIM CM SA questions, their respective Baseline and 2018 scores, and the percentage of programs scoring each question 3 or higher1 can be found in the appendix.
[ Return to Table of Contents ]
Chapter 1. Introduction
The Federal Highway Administration (FHWA) has used the Traffic Incident Management Capability Maturity Self-Assessment (TIM CM SA) for more than 15 years to evaluate the state of the practice in traffic incident management across the country. Originally developed by FHWA in 2002, State and local TIM program managers use the TIM CM SA annually to benchmark and evaluate TIM program success and areas of improvement.
The TIM CM SA has undergone a number of revisions over the years to reflect changes in TIM practices. The most significant and recent of these revisions occurred in 2015 to align the TIM CM SA with the Capability Maturity Framework (CMF).2 Due to the nature of the revisions completed in 2015, a recalibration of the Baseline scores was necessary that year to protect the value of the TIM CM SA as a tool to measure national TIM progress over time.
The combined impact of the numerous changes implemented in 2015 resulted in a slight decrease in the 2015 national TIM CM SA score from the 2014 score, but some of that decrease reversed in 2016. Figure 2 shows the overall national scores for the past decade, which include major revisions in 2011 and 2015.
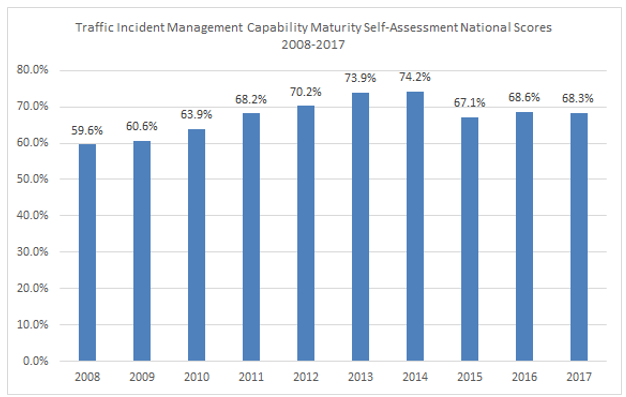
Figure 2. Graph. Traffic Incident Management Capability Maturity Self-Assessment national scores 2008 – 2017.
[ Return to Table of Contents ]
Chapter 2. Overview
In 2018, a total of 98 locations completed a Traffic Incident Management Capability Maturity Self-Assessment (TIM CM SA) for inclusion in the national analysis, matching the number of participating locations from 2017. The 55 scored questions contained within the TIM CM SA were grouped into 3 sections: Strategic, Tactical, and Support. The initial assessments completed in 2003, 2004, and 2005 (78 in total) continue to be used as the Baseline scores, although it should be noted that the Baseline scores are recalibrated each year that a major revision to the TIM CM SA is completed (2007, 2011, and 2015).
The 2018 overall TIM CM SA score was 70.4 percent (out of a possible 100 percent), representing a 38.9 percent increase over the Baseline. The TIM CM SA mean scores tended to be higher in larger metropolitan areas than in smaller areas. Specifically, mean scores were calculated for the top 40 metropolitan areas (by population), the top 75 metropolitan areas, and all other metropolitan areas that responded but were not in either of these groups:
- Top 40 metro areas:75.2 percent.
- Top 75 metro areas:73.3 percent.
- Non-top 75:64.3 percent.
- Overall:70.4 percent.
As indicated above, the significant revisions implemented in 2015 resulted in an overall decrease in the national score from 2014 to 2015 (down 9.5 percent). At 70.4 percent, the 2018 score is now the highest since that revision in 2015.
[ Return to Table of Contents ]
Chapter 3. Strategic
The 28 questions in the Strategic section are grouped into three subsections:
- Formal Traffic Incident Management (TIM) Programs.
- TIM Training and After Action Reports.
- TIM Performance Measures.
The Strategic section typically receives the lowest score of the three sections; this has traditionally been the result of low scores on the TIM Performance Measures subsection. The 2018 Traffic Incident Management Capability Maturity Self-Assessment (TIM CM SA) is no exception, with the Strategic section achieving a score of 65.0 percent compared to 75.0 percent in Tactical and 72.0 percent in Support.
This year's Strategic score represents a 4.2 percent increase from the 2017 score of 62.4 percent and reverses the decrease in Strategic scores experienced in the 2017 TIM CM SA.
Question 13 in the TIM Training and After Action Reports subsection asks about the percentage of TIM responders completing the 4-Hour TIM Responder Training provided through the second Strategic Highway Research Program (SHRP2). The scoring guidance for this question, shown in table 2, has been updated each year since 2015 to reflect the increasing numbers of responders completing the training nationally. According to Federal Highway Administration (FHWA) data, as of October 3, 2018, nearly 363,000 individuals have received the training, which represents 31.5 percent of the total responders to be trained.3
| Scoring Guidance | 2015 | 2016 | 2017 | 2018 |
|---|---|---|---|---|
| Score 1 if: | Less than 5% | Less than 10% | Less than 15% | Less than 25% |
| Score 2 if: | Between 6-7% | Between 11-15% | Between 16-30% | Between 36-35% |
| Score 3 if: | Between 8-9% | Between 16-19% | Between 31-45% | Between 36-45% |
| Score 4 if: | Over 10% | Over 20% | Over 45% | Over 45% |
As shown in table 3, the average score for Question #13 experienced an increase from 2017 of 11.1 percent and is now just 7.4 percent down from its Baseline in 2015.4 Between 2017 and 2018, the number of programs scoring Question #13 at a 4, indicating that more than 45 percent of responders had received the training—nearly doubled from 15 to 26.
Among locations that submitted a TIM CM SA in 2017 and 2018 (95 of 98 submittals), the average score on Question #13 was 2.64, a 12.8 percent increase over the average score in 2017 (2.34). Similarly, the percentage of programs scoring Question #13 a 3 or higher, which was 42.9 percent in 2017, is now at 50 percent, an increase of 16.6 percent over 2017 (see appendix).
| Question | 2015 Average Score | 2016 Average Score | 2017 Average Score | 2018 Average Score |
|---|---|---|---|---|
| 13. What percentage (estimated) of TIM responders in the region identified as needing training have received the 4-Hour SHRP2 TIM Responder Training (in-person or via Web-Based Training), or equivalent? | 2.82 | 2.90 | 2.35 | 2.61 |
TIM = Traffic Incident Management. SHRP2 = second Strategic Highway Research Program
Changes were also implemented to the TIM Performance Measures (TIM PM) questions in 2017 to provide more detailed and granular TIM PM data in support of FHWA's companion Every Day Counts (EDC) program. The goal of the TIM PM EDC initiative is to increase "the amount, consistency and quality of TIM data collection" to support "performance measures for evaluating and improving traffic incident response."5
The changes implemented in 2017 were to separate questions on the three TIM PM—Roadway Clearance Time (RCT), Incident Clearance Time (ICT) and Secondary Crashes—into individual questions that only asked about one of the three TIM PM per question.
The deconstructing of the TIM PM questions in 2017 resulted in scores below Baseline for all three TIM PM when asked if the data was used to influence operations (questions 20, 24, and 28). However, questions about the use of the RCT, ICT, and Secondary Crash performance data to influence operations all experienced score increases in 2018, with use of the RCT to influence operations now above its Baseline of 2.21 (table 4).
| Question | 2017 Average Score | 2018 Average Score | 2018 Change from Baseline |
|---|---|---|---|
| 20. How does your agency use RCT performance data to influence your operations? | 2.13 | 2.31 | 4.5 percent |
| 24. How does your agency use ICT performance data to influence your operations? | 1.99 | 2.14 | -3.0 percent |
| 28. How does your agency use Secondary Crash performance data to influence your TIM operations? | 1.67 | 1.85 | -16.4 percent |
ICT = Incident Clearance Time. RCT = Roadway Clearance Time. TIM = Traffic Incident Management.
Bolstered by FHWA's TIM PM EDC initiative, the evolution in the collection and use of TIM PM data is evident when looking across scores for the top 40 and the top 75 metropolitan areas as well as all other areas submitting a TIM CM SA.
As shown in table 5, where TIM programs are typically more advanced and have resources available for TIM PM collection and analysis, scores across those questions are, for the most part, higher.
| Question | Top 40 Metropolitan Area Average Score | Top 75 Metropolitan Area Average Score | Non-Top 75 Average Score |
|---|---|---|---|
| 20. How does your agency use RCT performance data to influence your operations? | 2.7 | 2.5 | 1.9 |
| 24. How does your agency use ICT performance data to influence your operations? | 2.5 | 2.4 | 1.7 |
| 28. How does your agency use Secondary Crash performance data to influence your TIM operations? | 2.0 | 2.0 | 1.6 |
ICT = Incident Clearance Time. RCT = Roadway Clearance Time. TIM = Traffic Incident Management.
Scores for Question #8 in the Strategic section corroborate that the top 40 metropolitan areas typically have better resourced TIM programs capable of collecting and analyzing TIM PM data (table 6).
| Question | Top 40 Metropolitan Area Average Score | Top 75 Metropolitan Area Average Score | Non-Top 75 Average Score |
|---|---|---|---|
| 8. Are funds available for TIM activities? | 3.2 | 23.0 | 2.4 |
TIM = Traffic Incident Management.
Scores on the TIM PM questions have traditionally been among the lowest in each year's TIM CM SA, and 2018 is no exception. As shown in table 7, the five lowest scoring questions in the 2018 TIM CM SA are all in the TIM PM subsection.
| Question | Baseline | 2018 Average Score | Percent Change from Baseline |
|---|---|---|---|
| 27. Has the TIM program established performance targets for a reduction in the number of Secondary Crashes? | 1.16 | 1.41 | 21.4 |
| 28. How does your agency use Secondary Crash performance data to influence your TIM operations? | 2.21 | 1.85 | -16.4 |
| 23. Has the TIM program established performance targets for ICT? | 1.16 | 1.86 | 60.1 |
| 26. How is data for the number of Secondary Crashes collected? | 1.88 | 2.12 | 12.9 |
| 24. How does your agency use ICT performance data to influence your TIM operations? | 2.21 | 2.14 | -3.0 |
ICT = Incident Clearance Time. RCT = Roadway Clearance Time. TIM = Traffic Incident Management.
Given the low Baseline scores overall in the TIM PM subsection combined with FHWA's 10+ year focus on advancing TIM PM, this is also where the largest percentage change from Baseline has occurred in the TIM CM SA. Five of the 12 TIM PM questions have more than doubled their score over Baseline (see the appendix).
Table 8 lists alphabetically the TIM programs that achieved the highest scores in the Strategic section.
| Traffic Incident Management (TIM) Program |
|---|
| Buffalo, NY |
| Columbus, OH |
| Louisville, KY |
| Miami – Dade, FL |
| Phoenix, AZ |
[ Return to Table of Contents ]
Chapter 4. Tactical
The 22 questions in the Tactical section are focused on the following three areas:
- Traffic Incident Management (TIM) Laws.
- Policies and Procedures for Incident Response and Clearance.
- Responder and Motorist Safety.
The Tactical section continues as the highest scoring of the three Traffic Incident Management Capability Maturity Self-Assessment (TIM CM SA) sections, achieving an overall score of 75.0 percent. Three of the five highest scoring questions on the 2018 TIM CM SA are in the Tactical section, as part of the Policies and Procedures subsection (table 9).
| Question | 2018 Average Score | Percent of TIM CM SA Scoring 3 or Higher |
|---|---|---|
| 39. Is there a policy in place that clearly identifies reportable types and quantities, and appropriate Hazmat response? | 3.26 | 85.7 |
| 40. Does at least one responding agency have the authority to override the decision to utilize the responsible party’s Hazmat contractor and call in other resources? | 3.41 | 90.8 |
| 44. Is there a procedure in place for removal of abandoned vehicles? | 3.44 | 82.7 |
TIM CM SA = Traffic Incident Management Capability Maturity Self-Assessment.
High scores in this area can be attributed, in part, to the National TIM Responder Training that emphasizes the need for policies and procedures that provide for responder and motorist safety and quick clearance. Further evidence of where the National TIM Responder Training is making a difference is in the increase in score over the Baseline for questions 48, 49 and 50.
- Is there a mutually understood procedure/guidance in place for safe vehicle positioning?
- Are there mutually understood procedures/guidelines in place for use of emergency-vehicle lighting?
- Are TIM responders following high-visibility safety apparel requirements as outlined in the MUTCD [Manual on Uniform Traffic Control Devices]?
Combined, these three questions had an average score of 3.02 in 2018, which is a 135.7 percent increase over the Baseline. Response vehicle positioning, emergency vehicle lighting use, and high-visibility safety apparel are part of the curriculum in Lesson 4 (Safe Vehicle Positioning) and Lesson 5 (Scene Safety) in the National TIM Responder Training Course.
Two questions in the TIM CM SA query respondents on Safety Service Patrols (questions 32 and 33). The first asks about the existence of a Safety Service Patrol and the second asks respondents to score the Safety Service Patrol's level of coverage.
Over 71 percent of respondents scored both questions 3 or 4 (with 34.7 percent scoring both questions 4), meaning a large number of Safety Service Patrols across the country range from mid-level to full-functionality.
Services provided by these Safety Service Patrols include motorist assistance, incident response and clearance, emergency traffic control, and scene management. Furthermore, these Safety Service Patrols range from medium-sized fleets providing service on most major roadways to fleets large enough to provide ample coverage on all major roadways. For those that provided operating hours for their programs, the majority operate during morning and afternoon peak periods Monday through Friday, although some operate 24/7 on a year-round basis.
Seventy-five percent of the 2018 TIM CM SA respondents provided information on levels of coverage, with the combined Safety Service Patrol coverage extending over 4,396 centerline miles and 9,404 lane miles (some programs reported centerline, others lane miles). The median centerline miles coverage reported by 2018 TIM CM SA respondents was 117 miles and the median lane miles coverage was 148 miles.
The continued high scores in the Tactical section of the TIM CM SA indicate that TIM programs have successfully institutionalized Driver Removal and Authority Removal laws, policies and procedures for incident response and clearance and have put into place the processes necessary for responder and motorist safety. With initially high Baseline scores, the Tactical questions have only experienced a combined 16.2 percent increase over Baseline, and the average percentage of programs scoring these questions a 3 or higher is 73.8 percent.
As further evidence of the overall high scores in the Tactical section, the question that scored the lowest, Question 31, received an average score of 2.69 in 2018. Focused on the activities in place to reach out to and educate the public and elected officials about TIM, there may be some opportunity to bring this score up in future years. The scoring guidance for Question 31 indicates that a program can achieve a score of 4 if a "comprehensive, consistent TIM public outreach and education program is in place. The program provides education on specific laws as well as the overall goals and benefits of TIM. Outreach efforts cover all age ranges, starting with driver's education programs and including experienced drivers." A number of the higher scoring programs on Question 31 cite consistent use of social media and changeable message signs as venues for public outreach and education about traffic incidents, and the Move Over and Driver Removal laws.
Communicating the value of the TIM program to elected officials could be enhanced through data on the number of responder struck-by injuries and fatalities. One of the non-scored supplemental questions included in Question 31 queries the existence of internal agency-specific reporting on responder struck-by injuries and fatalities, and in 2018, just 30 percent of programs indicated that this data was being recorded. This may be an area for TIM programs to focus on in subsequent years to raise their score on Question 31.
Table 10 lists alphabetically the TIM programs that achieved the highest scores in the Tactical section.
| Traffic Incident Management Program |
|---|
| Atlanta, Georgia |
| Milwaukee, WI |
| San Diego, CA |
| Seattle, Washington |
| Virginia – Northern VA/Suburban D.C. |
[ Return to Table of Contents ]
Chapter 5. Support
The Support section had the second highest overall score of 72.0 percent and the largest increase over Baseline of the three sections (81.5 percent).
The questions in the Support section focused on the tools and technologies enabling improved incident detection, response and clearance. The major revision completed in 2015 removed questions on traveler information, returning the emphasis to the infrastructure and activities that enable incident information exchange between Traffic Incident Management (TIM) program stakeholders. This allows programs to rate their progress on items over which their TIM program has control.
The five questions in the Support section all address TIM data sharing and integration among TIM stakeholders. The highest scoring question in the Support section was question 51 (below), which scored an average of 3.40, the third highest scoring question on the 2018 Traffic Incident Management Capability Maturity Self-Assessment (TIM CM SA).
- Are TIM stakeholders aware of and actively utilizing Traffic Management Center/Traffic Operations Center resources to coordinate incident detection, notification, and response?
A review of the comments submitted for question 51 reveals several themes. Among higher scoring locations, co-location of public safety and transportation personnel in the traffic management center/traffic operations center (TMC/TOC) is a key feature of the success. Others point to the success of the national TIM training course in bringing greater awareness to the use of TMC/TOC resources for incident detection, notification, and response.
Questions 52 and 53 query respondents on the use of data and video sharing between agencies. While question 52 (on data sharing) scored slightly higher than question 53 (video sharing), both questions saw their scores increase from 2017 and both questions have a high percentage of programs scoring each a 3 or higher (table 11).
| Question | 2017 Average Score | 2018 Average Score | Percent of TIM CM SA Scoring 3 or Higher |
|---|---|---|---|
| 52. What TIM data (i.e., number of involved vehicles, number of lanes blocked, length of queue, etc.) is captured via TMCs and/or public safety CAD systems and is it shared with other disciplines for real-time operational purposes? | 2.93 | 3.03 | 82.7 |
| 53. Is TIM video captured via TMCs and/or public safety CAD systems and is it shared with other disciplines for real-time operational purposes? | 2.82 | 2.90 | 75.5 |
CAD = computer-aided dispatch. TIM CM = Traffic Incident Management Capability Maturity. TMC= traffic management center.
The lowest scoring of the five questions in the Support section asks respondents about policies or procedures in place for signal timing changes to support traffic management during incident response, which received an average score of 2.34. Just over a third (39.87 percent) of the TIM CM SA scored this question 3 or higher. While this represents a 6.8 percent increase over the 2017 average score, a review of the comments indicates that this is an area where additional outreach may be warranted. Ownership of the signals by entities other than the DOT was cited in a number of comments as a reason why scores are not higher for this question. Some respondents did indicate that coordination with the cities and municipalities that own the signals was beginning but coordination with local entities could be emphasized in the national TIM training course as an important traffic management feature.
Table 12 lists alphabetically the TIM programs that achieved the highest scores in the Support section.
| Traffic Incident Management Program |
|---|
| Alachua – Bradford, FL |
| Atlanta, GA |
| Boston, MA |
| Cincinnati, OH |
| Columbus, OH |
| Louisville, KY |
| Philadelphia, PA |
| Phoenix, AZ |
| San Bernardino, California |
| San Diego, California |
| Springfield, MA |
[ Return to Table of Contents ]
Chapter 6. Results Summary
A total of 98 Traffic Incident Management Capability Maturity Self-Assessments (TIM CM SA) were completed in 2018, with an average overall score of 70.4 percent (out of a possible 100 percent). Overall scores were up 38.9 percent over the Baseline scores. The TIM CM SA mean scores tended to be higher in larger metropolitan areas than in smaller areas. Specifically, mean scores were calculated for the top 40 metropolitan areas (by population), the top 75 metropolitan areas, and all other metropolitan areas that responded but were not in either of these groups:
- Top 40 metro areas:75.2 percent.
- Top 75 metro areas:73.3 percent.
- Non-top 75:64.3 percent.
- Overall:70.4 percent.
The highest scores were achieved in Tactical (75.0 percent) and the largest percentage increase in scores from the Baseline was in Support (81.5 percent). Low-scoring questions and those with the least improvement over Baseline indicate specific program areas where additional guidance from FHWA may be warranted.
The five lowest scoring questions on this year's TIM CM SA were in the TIM Performance Measures (TIM PM) subsection and focused on two of the three TIM PM: Incident Clearance Time (ICT) and Secondary Crashes. Despite the low scores, four of the five questions did realize an increase over the 2017 average score (table 13).
| Question | 2018 Average Score | Percent Change from 2017 Average Score |
|---|---|---|
| 27. Has the TIM program established performance targets for a reduction in the number of Secondary Crashes? | 1.41 | 7.6 |
| 28. How does your agency use Secondary Crash performance data to influence your TIM operations? | 1.85 | 10.8 |
| 23. Has the TIM program established performance targets for ICT? | 1.86 | -0.5 |
| 26. How is data for the number of Secondary Crashes collected? | 2.12 | 7.6 |
| 24. How does your agency use ICT performance data to influence your TIM operations? | 2.14 | 7.5 |
ICT = Incident Clearance Time. TIM = Traffic Incident Management.
Another indicator of potential focus areas for the Federal Highway Administration (FHWA) is on those questions that achieve scores below their Baseline score. In the 2018 TIM CM SA, five questions received an average score below Baseline (table 14). Despite earning scores below Baseline, four of the five did realize an increase in average score over the 2017 average score, indicating that these areas are receiving focus by TIM program managers.
| Question | 2018 Average Score | Percent Change from 2017 Average Score | 2018 Percent Change from Baseline |
|---|---|---|---|
| 28. How does your agency use Secondary Crash performance data to influence your TIM operations? | 1.85 | 10.8 | -16.4 |
| 13. What percentage (estimated) of TIM responders in the region identified as needing training have received the 4-hour SHRP 2 TIM Responder Training (in-person or via web-based training), or equivalent? | 2.61 | 11.1 | -7.4 |
| 30. Is a Driver Removal Law in place and understood by TIM stakeholders? | 2.83 | 0 | -6.1 |
| 24. How does your agency use ICT performance data to influence your TIM operations? | 2.14 | 7.5 | -3 |
| 44. Is there a procedure in place for removal of abandoned vehicles? | 3.44 | 2.4 | -0.9 |
ICT = Incident Clearance Time. TIM = Traffic Incident Management.
The 2018 TIM CM SA scores indicate continued advancement by TIM programs across the country. The overall score and the individual Strategic, Tactical, and Support scores are up over 2017 scores. Program areas that were identified as needing additional attention in the 2017 national analysis report are benefitting from that increased focus, and higher scores are being achieved.
[ Return to Table of Contents ]
Appendix. Summary of 2018 Traffic Incident Management Capability Maturity Self-Assessment Results
| Question | Mean Score | Percent Change from Baseline | Percent Scoring 3 or Higher | ||
|---|---|---|---|---|---|
| Baseline | 2018 | Baseline | 2018 | ||
| Strategic | |||||
| 1. Is there a formal Traffic Incident Management (TIM) program that is supported by a multidiscipline, multi-agency team or task force, which meets regularly to discuss and plan for TIM activities? | 1.9 | 3.09 | 62.5 | 28.0 | 79.6 |
| 2. Are all disciplines and agencies participating in on-going TIM enhancement activities/efforts? | 1.9 | 3.09 | 62.5 | 28.0 | 79.6 |
| 3. Is the importance of TIM understood by all TIM stakeholders and supported by multidiscipline, multi-agency agreements or memorandums of understanding (MOUs)? | 1.71 | 2.73 | 59.9 | 18.0 | 63.3 |
| 4. Is agency leadership actively involved in program-level TIM decisions (i.e., policy establishment, training, funding, legislation, etc.)? | 1.71 | 2.91 | 70.1 | 18.0 | 74.5 |
| 5. Is there a full-time position within at least one of the participating agencies with responsibility for coordinating the TIM program as their primary job function? | 2.28 | 3.0 | 31.6 | 54.0 | 63.3 |
| 6. Are the TIM response roles and responsibilities of public and private sector TIM stakeholders mutually understood? | 1.71 | 3.08 | 80.2 | 18.0 | 86.7 |
| 7. Is planning to support TIM activities, including regular needs assessments, done across and among participating agencies? | 1.35 | 2.92 | 116.2 | 12.0 | 73.5 |
| 8. Are funds available for TIM activities? | 1.71 | 2.83 | 65.3 | 18.0 | 64.3 |
| 9. Is TIM considered and incorporated into planning efforts for construction and work zones? | 2.47 | 3.26 | 31.9 | 35.0 | 82.0 |
| 10. Is TIM considered and incorporated into planning efforts for special events such as sporting events, concerts, conventions, etc.? | 2.47 | 3.26 | 31.9 | 35.0 | 82.0 |
| 11. Is TIM considered and incorporated into planning efforts for weather-related events? | 2.47 | 3.26 | 31.9 | 35.0 | 82.0 |
| 12. Have stakeholders in the region participated in a second Strategic Highway Research Program (SHRP2) National TIM Responder Training Program, or equivalent, Train-the-Trainer (TtT) session and are they actively training others? | 1.26 | 2.8 | 121.9 | 9.0 | 67.3 |
| 13. What percentage (estimated) of TIM responders in the region identified as needing training have received the 4-Hour SHRP2 TIM Responder Training (in-person or via Web-Based Training), or equivalent? | 2.82 | 2.61 | -7.4 | 57.9 | 50.0 |
| 14. Is the SHRP2 TIM Responder Training being conducted in a multidiscipline setting? | 2.97 | 3.05 | 2.8 | 66.3 | 62.2 |
| 15. Has the SHRP2 TIM Responder Training, or equivalent, been incorporated into the local academy and/or technical college curriculums? | 1.77 | 2.27 | 28.1 | 10.5 | 31.6 |
| 16. Does the TIM program conduct multidiscipline, multi-agency after-action reviews (AARs)? | 1.62 | 2.74 | 69.4 | 18.0 | 58.2 |
| 17. Is Roadway Clearance Time (RCT) being measured utilizing the Federal Highway Administration (FHWA) standard definition time between first recordable awareness of an incident by a responsible agency and first confirmation that all lanes are available for traffic flow? | 0.64 | 2.68 | 319.3 | 3.0 | 61.2 |
| 18. Which of the following data collection and analysis practices best align with your region for RCT? | 0.64 | 2.36 | 268.3 | 3.0 | 45.9 |
| 19. Has the TIM program established performance targets for RCT? | 1.16 | 2.32 | 99.7 | 4.0 | 44.9 |
| 20. How does your agency use RCT performance data to influence your TIM operations? | 2.21 | 2.31 | 4.5 | 35.8 | 51.0 |
| 21. Is Incident Clearance Time (ICT) measured and used by your agency? FHWA defines ICT as the "time between the first recordable awareness of the incident and the time at which the last responder has left the scene." | 0.64 | 2.48 | 287.4 | 3.0 | 54.1 |
| 22. Which of the following data collection and analysis practice best aligns with your region for ICT? | 0.64 | 2.27 | 254.0 | 3.0 | 41.8 |
| 23. Has the TIM program established performance targets for ICT? | 1.16 | 1.86 | 60.1 | 4.0 | 27.6 |
| 24. How does your agency use ICT performance data to influence your TIM operations? | 2.21 | 2.14 | -3.0 | 35.8 | 39.8 |
| 25. Is the number of Secondary Crashes being measured and used? FHWA defines Secondary Crashes as the number of unplanned crashes beginning with the time of detection of the primary crash where a collision occurs either a) within the incident scene or b) within the queue, including the opposite direction, resulting from the original incident? | 1.03 | 2.16 | 110.0 | 8.0 | 46.9 |
| 26. How is data for the number of Secondary Crashes collected? | 1.88 | 2.12 | 12.9 | 29.5 | 37.8 |
| 27. Has the TIM program established performance targets for a reduction in the number of Secondary Crashes? | 1.16 | 1.41 | 21.4 | 4.0 | 8.2 |
| 28. How does your agency use Secondary Crash performance data to influence your TIM operations? | 2.21 | 1.85 | -16.4 | 35.8 | 26.5 |
| Tactical | |||||
| 29. Is an Authority Removal Law in place and understood by TIM stakeholders? | 2.92 | 3.03 | 3.8 | 67.0 | 74.5 |
| 30. Is a Driver Removal Law in place and understood by TIM stakeholders? | 3.01 | 2.83 | -6.1 | 71.0 | 75.5 |
| 31. What activities are in place to outreach to and educate the public and elected officials about TIM? | 2.38 | 2.69 | 13.2 | 46.3 | 67.3 |
| 32. Is there a Safety Service Patrol program in place for incident and emergency response? | 2.73 | 3.12 | 14.2 | 67.0 | 76.5 |
| 33. What level of coverage does the Safety Service Patrol program provide? | 2.73 | 3.12 | 14.2 | 67.0 | 76.5 |
| 34. Do TIM responders routinely utilize the Incident Command System (ICS), specifically Unified Command (UC), while on scene? | 2.55 | 3.22 | 26.5 | 58.0 | 89.8 |
| 35. Are temporary traffic control (TTC) devices (e.g., cones, advanced warning signs, etc.) pre-staged in the region to facilitate timely response? | 2.21 | 2.81 | 27.0 | 41.0 | 65.3 |
| 36. Do towing and recovery procedures/rotation list policies deploy resources based on type/severity of incident? | 3.14 | 3.17 | 1.2 | 74.7 | 81.6 |
| 37. Do towing and recovery procedures/rotation list policies include company/operator qualifications, equipment requirements, and/or training requirements? | 2.86 | 2.96 | 3.5 | 67.0 | 69.4 |
| 38. Do towing and recovery procedures/rotation list policies include penalties for non-compliance of response criteria? | 2.49 | 2.76 | 10.4 | 55.8 | 67.3 |
| 39. Is there a policy in place that clearly identifies reportable types and quantities, and appropriate Hazmat response? | 2.89 | 3.26 | 12.6 | 69.0 | 85.7 |
| 40. Does at least one responding agency have the authority to override the decision to utilize the responsible party's Hazmat contractor and call in other resources? | 3.22 | 3.41 | 5.8 | 9.0 | 90.8 |
| 41. For incidents involving a fatality, is there a procedure in place for early notification and timely response of the Medical Examiner? | 2.53 | 2.77 | 9.5 | 55.0 | 60.7 |
| 42. For incidents involving a fatality, is there a procedure for the removal of the deceased prior to Medical Examiner arrival? | 2.53 | 2.77 | 9.5 | 55.0 | 60.7 |
| 43. Are there procedures in place for expedited crash investigations? | 2.59 | 2.82 | 8.7 | 72.0 | 60.2 |
| 44. Is there a procedure in place for removal of abandoned vehicles? | 3.47 | 3.44 | -0.9 | 91.0 | 82.7 |
| 45. Do standardized, documented TIM response procedures/guidelines exist? | 2.73 | 2.73 | 0.3 | 61.1 | 65.3 |
| 46. Do TIM responders routinely utilize temporary traffic control devices to provide traffic control for the three incident classifications (minor, intermediate, major) in compliance with the Manual on Uniform Traffic Control Devices (MUTCD)? | 1.93 | 3.07 | 59.1 | 27.0 | 79.6 |
| 47. Do TIM responders routinely utilize traffic control procedures to provide back of traffic queue warning to approaching motorists? | 1.56 | 2.91 | 86.4 | 17.0 | 73.5 |
| 48. Is there a mutually understood procedure/guideline in place for safe vehicle positioning? | 1.28 | 3.02 | 135.7 | 14.0 | 73.5 |
| 49. Are there mutually understood procedures/guidelines in place for use of emergency-vehicle lighting? | 1.28 | 3.02 | 135.7 | 14.0 | 73.5 |
| 50. Are TIM responders following high-visibility safety apparel requirements as outlined in the MUTCD? | 1.28 | 3.02 | 135.7 | 14.0 | 73.5 |
| Support | |||||
| 51. Are TIM stakeholders aware of and actively utilizing Traffic Management Center/Traffic Operations Center resources to coordinate incident detection, notification and response? | 1.98 | 3.4 | 71.6 | 41.0 | 90.8 |
| 52. What TIM data (i.e., number of involved vehicles, number of lanes blocked, length of queue, etc.) is captured via TMCs and/or public safety computer-aided dispatch (CAD) systems and is it shared with other disciplines for real-time operational purposes? | 1.43 | 3.03 | 111.9 | 10.0 | 82.7 |
| 53. Is TIM video captured via TMCs and/or public safety CAD systems and is it shared with other disciplines for real-time operational purposes? | 1.43 | 2.9 | 102.7 | 10.0 | 75.5 |
| 54. Are there policies or procedures in place for signal timing changes to support traffic management during incident response? | 1.55 | 2.34 | 50.8 | 18.0 | 39.8 |
| 55. Are there pre-planned detour and/or alternate routes identified and shared between TIM stakeholders? | 1.55 | 2.74 | 77.1 | 18.0 | 61.2 |
[ Return to Table of Contents ]
1 Scores of 3 and 4 indicate the highest levels of progress for a particular question. [ Return to note 1. ]
2 This revision included a renaming of the annual assessment to the TIM Capability Maturity Self-Assessment or TIM CM SA as referred to throughout this report. [ Return to note 2. ]
3 P. Jodoin, "National TIM Responder Training Program Implementation Progress." Unpublished presentation obtained on October 3, 2018. [ Return to note 3. ]
4 Prior to the 2015 TIM CM SA revision, the question on percentage of responders trained was a non-scored supplemental question. [ Return to note 4. ]
5 Federal Highway Administration, Office of Innovative Program Delivery, Center for Accelerating Innovation. EDC-4, Using Data to Improve Traffic Incident Management. Available online: https://www.fhwa.dot.gov/innovation/everydaycounts/edc_4/timdata.cfm. [ Return to note 5. ]