Freight Mobility Trends Report 2019SECTION 1: INTRODUCTIONThe Nation’s highways serve a vital role in moving both people and goods. Highways are an integral element of the national, multimodal freight transportation system. With projected growth in passenger and freight travel, the Nation’s highways will continue to experience even greater demand. This increase in demand calls for transportation decision makers at all levels of government to ensure that increasingly limited public funding is being allocated toward projects that provide the maximum benefit. To do this, decision makers need information on the performance of the transportation system so that they can optimize investments and operational strategies. Decision makers also need to understand the outcome of improvements to identify whether the investment or operational strategy is working as expected. For decision makers to be able to plan for, improve, and operate the transportation system, there need to be ways to comprehensively monitor and assess transportation performance and mobility trends. The Federal Highway Administration’s (FHWA’s) Freight Mobility Trends (FMT) program provides high-level, national trends in freight mobility. This program uses a newly developed FMT dashboard tool that processes a suite of indicators to assess freight movement over a range of locations based on truck travel data. Specifically, it uses the National Performance Management Research Data Set (NPMRDS) truck probe data, as well as the Highway Performance Monitoring System (HPMS), to visualize performance at the national level and provide indicators that help tell the freight story with the functionality to focus on different geographies and locations in order to gain insight into observations. This report presents the results of national freight mobility trends from 2017 to 2019. The goal of the FMT is to provide a sense of freight performance for a range of locations significant for national freight movement. Freight in the United StatesFreight moves over a multimodal network of highways, railroads, waterways, pipelines, and airways. This network supports a daily average of approximately 51 million tons of freight valued at more than $51.8 billion in 2018. Most goods movement occurs by truck at nearly 12 billion tons in 2018, followed by pipeline at 3 billion tons and rail at nearly 2 billion tons. Goods movement by truck represents 67 percent of the total domestic tonnage and 69 percent of value in 2018.4 According to the U.S. Department of Transportation (USDOT) Bureau of Transportation Statistics (BTS), trucks are involved in the supply chain of all top 10 commodities by tonnage and value, as shown in figure 17.5 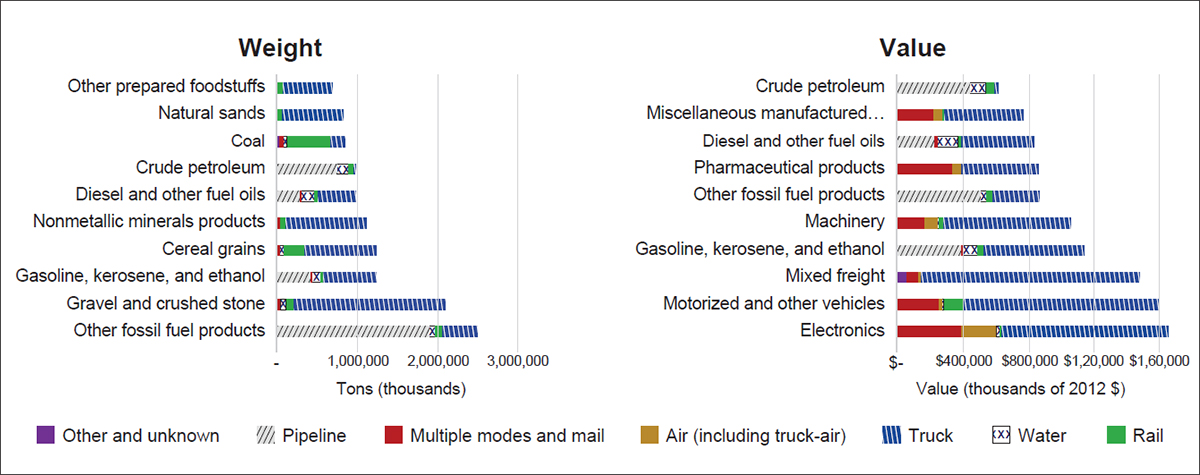
Source: USDOT BTS. Freight Facts and Figures. 2019. https://data.bts.gov/stories/s/Moving-Goods-in-the-United-States/bcyt-rqmu#commodities. Note: Other fossil fuel products include coal and petroleum products not elsewhere classified, such as liquefied natural gas, coke, asphalt, and other products of coal and petroleum refining, excluding gasoline, aviation fuel and fuel oil. Other prepared foodstuffs include dairy products, processed vegetables, processed fruit, coffee and tea, restaurants, with the remainder being hardware, office supplies, and other miscellaneous items. As figure 17 shows, trucks carry a large proportion of goods, ranging from high-value commodities, such as electronics, motorized vehicles, machinery, and mixed freight (groceries, office supplies, and hardware), to bulk commodities, such as gravel, grains, and gasoline. Trucks moved more high-value, time-sensitive commodities than any other mode in 2018.6 Freight movement is expected to continue to increase in the future. The Freight Analysis Framework (FAF) estimates freight tonnage will increase about 37 percent between 2018 and 2045. This increase will place additional truck traffic on a highway system that currently experiences congestion in many areas.7 The freight network is critical to the U.S. economy. Freight travels over an extensive network of highways, railroads, waterways, pipelines, and airways. In terms of highway infrastructure, traffic volume increased 17.9 percent between 2000 and 2018, from 2,747 billion to 3,240 billion vehicle miles traveled.8 Long-haul freight truck traffic in the United States is concentrated on major routes connecting population centers, ports, border crossings, and other major hubs of activity. Long-haul freight truck traffic on the National Highway System (NHS) is projected to increase dramatically. BTS projects that truck travel may increase from 311 million miles per day in 2015 to 488 million miles per day by 2045.9 BTS provides a freight transportation services index (TSI) that measures the month-to-month volume of goods for the for-hire transportation industry. The TSI increased by 37.1 percent from 2000 to 2018. The growth rates in the volume of goods by mode from 2009 to 2019 are as follows:
The growth in freight and its expected increase over the next 25 years mean that higher volumes of vehicles will be on the Nation’s freight network. Specifically, long-haul freight truck traffic on the NHS is projected to increase significantly from 311 million miles per day in 2015 to 488 million miles per day by 2045, a 60 percent increase. The number of NHS miles carrying large volumes and high percentages of trucks is projected to increase. Miles of segments with more than 8,500 trucks per day, and where at least every fourth vehicle is a truck, are estimated to double from 6,229 miles in 2015 to 12,729 in 2045.10 FHWA’s Efforts to Improve Freight MobilityBased on this increase in freight movement, USDOT carefully assesses freight performance in the United States and works with States and metropolitan regions to develop plans and programs that will improve the mobility and reliability of freight. This requires information on not only the volume of traffic and the amount of freight being moved, but also freight mobility—how well or efficiently freight moves. Resources such as the NPMRDS, freight data analysis, research, training, and technical assistance to State departments of transportation (DOTs) and metropolitan Additionally, FHWA is leading efforts to develop freight fluidity measures with a goal of illuminating the multimodal performance of supply chains. This work can help advance multimodal data that can be used to assess freight trips in detail and identify where bottlenecks are occurring beyond the highway experience. Further, FHWA invests significant resources and effort into helping State DOTs and MPOs implement freight data and performance measurement techniques they can use to identify freight bottlenecks, assess freight project needs and benefits, and understand the relationship of freight to the economy and environment. The new FMT tool represents an advancement in FHWA’s progress toward understanding the mobility dynamics of freight by helping to visualize performance for a range of geographies using a suite of measures. This report reflects the results of the FMT tool. The report begins with information on the methodology used in the FMT tool and provides results for the range of locations—from specific freight locations and facilities to national-level statistics (aggregated from many freight segments). MethodologyThe FMT dashboard relies on a suite of mobility indicators applied over a range of locations that allow FHWA to measure freight in new and comprehensive ways through the following:
This provides high-level coverage and detail for FHWA to assess freight mobility and target policies, programs, and resources to develop programs and work with stakeholders such as DOTs and MPOs. Mobility IndicatorsThe mobility indicators used in the FMT include the following (as detailed in appendix A):
DataFHWA’s FMT relies on the NPMRDS and HPMS data sets. The NPMRDS travel time data for freight trucks, passenger vehicles, and all vehicles on the NHS is a central data set for the FMT. The FHWA HPMS is a source of data for average annual daily traffic (AADT) volumes, average annual daily truck traffic (AADTT) volumes, and other roadway inventory attributes. The NPMRDS segmentation has been aggregated into approximately 3- to 4-mile sections in urban areas and 5- to 10 mile sections in rural areas. This provides a better way to visualize performance on a national scale. All mobility indicators (with the exception of the TRI) are weighted by truck vehicle miles of travel (TVMT) to allow for aggregating up to section, area, State, and national values. Reference speed for the mobility indicators was determined by using the NPMRDS travel times during off-peak or uncongested conditions as an estimate of free-flow speed. Indicator DifferencesTogether, these indicators provide different lenses to tell the complete freight story on the U.S. transportation network. The mobility elements of the freight story are told with travel time indices and measures of delay. The TTI provides a mobility measure during the peak periods by considering the average peak conditions relative to the reference speed (e.g., free flow). Indicators of the PTI and BI provide insight into the reliability of the road relative to free-flow conditions and average travel times, and the TRI provides insight into day-to-day truck reliability. Bottleneck Identification CriteriaBottlenecks are identified through a ranking of roadway sections from the truck hours of delay, normalized by segment length to get delay per mile (DPM). Though it is also possible to identify bottlenecks by any number of indicators and break them out by rural and urban, FHWA uses DPM as the primary measure because it includes weighting by truck volume, captures the full extent of the congestion problem, and allows for nationwide comparison of locations. LocationsThe FMT tool provides a suite of indicators across the entire NHS at a variety of location categories. The location categories include road types nationally, at the State level, within MPO boundaries, in urban areas, and in rural areas. There are nationally significant Interstate freight corridors, the National Highway Freight Network (NHFN), and the Strategic Highway Network (STRAHNET). The analysis locations also include border crossings, ports, cargo-bearing airports, and rail intermodal locations. Appendix A details definitions and methodologies for mobility indicators, data, and analysis locations. |
|
United States Department of Transportation - Federal Highway Administration |
||