Integrated Modeling for Road Condition Prediction — Phase 3 Evaluation Report
Chapter 2. Evaluation Approach
The evaluation approach was developed based on reviews of project documents, meetings with Kansas City Scout (KC Scout) staff, and discussions with the development team and the Federal Highway Administration (FHWA) Road Weather Management Program (RWMP). Project goals and objectives served as the basis for the key questions and evaluation objectives. Key questions to be addressed in the evaluation were: (1) Did the Integrated Modeling for Road Condition Prediction (IMRCP) have an operational impact? (2) Did users consider the IMRCP information useful?
The primary users of IMRCP for this deployment are staff at the KC Scout traffic management center (TMC) who monitor traffic speeds, cameras, and weather to identify traffic issues. The speeds and predicted speeds of the models in IMRCP need to be relatively accurate for operators to have confidence in using the system; therefore, the evaluation approach focused on speeds, speed predictions, and user perspectives. The following sections describe the evaluation objectives, approach, and methodology.
Evaluation Objectives
Evaluation objectives were developed to guide the approach. For IMRCP to have an operational impact, the information should be accurate; therefore, the objective was to examine if the speeds and speed forecasts were accurate. To address the usefulness question, two objectives guided the investigation: (1) whether the integrated system improves internal agency operations and (2) whether operators and supervisors found the enhanced integrated information useful. Table 1 shows the key questions of the evaluation and the corresponding objectives.
Table 1. Integrated Modeling for Road Condition Prediction evaluation key questions and objectives.
| Key Questions |
Objectives |
| Did IMRCP have an operational impact? |
Examine if the speeds and speed forecasts are accurate. |
| Did users consider IMRCP information useful? |
Investigate if the integrated system improves internal agency operations. |
 |
Determine if operators/supervisors find the enhanced integrated information useful. |
IMRCP = Integrated Modeling for Road Condition Prediction.
Approach
Investigating whether the speeds and speed forecasts were accurate involved identifying a variety of road and weather conditions across numerous days during the 2019–2020 winter driving season. Days with high-impact events (e.g., incidents, storms, work zones, and planned events) were selected by the research team for collecting IMRCP predicted speeds; historical Kansas City Scout (KC Scout) detector speeds; IMRCP speed forecasts that were 15 to 115 minutes into the future; and weather, road, and traffic condition information.
The analyses of IMRCP model prediction performance compared the Traffic Estimation and Prediction System (TrEPS) and machine learning-based prediction (MLP) predictions to the KC Scout detector data. The IMRCP pavement conditions were also compared to the Model of the Environment and Temperature of Roads (METRo). However, modeling of the atmospheric weather forecasts, performed by the National Oceanic and Atmospheric Administration/National Weather Service, was not examined because those methods are external to the IMRCP. The evaluation looked at various 2019–2020 days, weather events, and detector locations to provide a reasonable assessment of the IMRCP model performance across the entire IMRCP road network.
To investigate whether users considered IMRCP information useful, interviews were conducted in 2019 and 2020 to obtain operator and supervisor perspectives about IMRCP and to provide insights that include:
- Investigating whether IMRCP improves internal agency operations.
- Determining whether IMRCP current and predicted road conditions are accurate.
- Exploring whether operators and supervisors find the enhanced integrated information useful.
The following sections describe the operational impacts and usefulness studies.
Operational Impacts Study
The operational impacts study compared IMRCP TrEPS and MLP speed predictions with historical KC Scout detector speeds to determine the accuracy of speed predictions at several locations, during various time periods, and for a variety of road and weather conditions.
Three locations along Interstate 435 (I–435) were selected for analysis across five winter events spanning seven 24-hour (h) periods. The detectors and corresponding segments explored were located on I–435 eastbound (EB) at State Line Road, I–435 northbound (NB) at East Stadium Drive, and I–435 EB at Antioch Road. The locations were previously identified as reliable locations for collecting speed link data, which was the basis for comparing the IMRCP historical real-time speeds and speed forecasts. Figure 2 shows a map of the detector locations used in the analyses. According to the IMCRP tool, a work zone was present downstream from the detector and segment of interest during the periods explored at the State Line Road location.
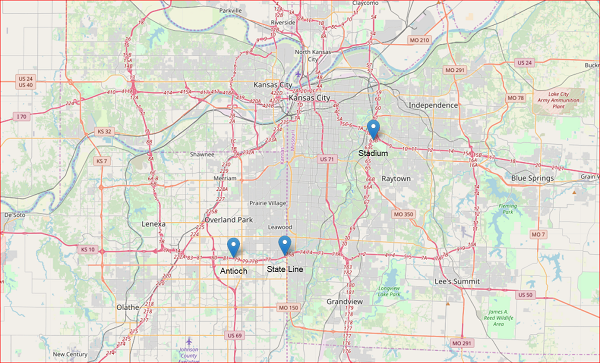
Source: Federal Highway Administration; OpenStreetMap®contributors.
Figure 2. Map. Link detector locations.
This map shows the greater Kansas City area with major highways drawn in red and three detector locations indicated by blue pointers. The detectors are located on I–435 eastbound at State Line Road, I–435 northbound at East Stadium Drive, and I–435 eastbound at Antioch Road.
Table 2 lists the locations, time periods, and corresponding road and weather conditions that were studied. The evaluation team completed the following analyses for each location and date:
- Analysis of historical predicted speeds.
- Analysis of forecast speeds for 15-, 30-, 45-, 60-, 75-, 90-, 105-, and 115-min predictions.
- Analysis of speed forecast error (absolute, relative absolute, and root mean square errors).
Table 2. Weather conditions by location and date.
| Location |
11/11/2019 |
11/29/2019 |
12/15/2019 |
12/16/2019 |
12/17/2019 |
1/29/2020 |
2/12/2020 |
| I–435 EB at State Line Road |
Light snow/snow and wind gusts; incident; work zone |
Wet, frosty roads |
Ice, snow, light wind |
Afternoon light snow and some haze; evening snow |
Morning fog; fair in the afternoon |
|
|
| I–435 NB at East Stadium Drive |
Light snow/snow and wind gusts; incident |
Wet, frosty roads |
Ice, snow, light wind |
Afternoon light snow and some haze; evening snow |
Morning fog; fair in the afternoon |
|
|
| I–435 EB at East Antioch Road |
|
|
|
|
|
Freezing rain/light snow/wintry mixture and windy |
Snow, wet roads |
I–435 = Interstate 435. EB = eastbound. NB = northbound.
Forecast Speed Error Analyses
Forecast data were gathered in the same manner as the historical data using the reports page on the IMRCP web application. To evaluate forecast accuracy, the following forecast lead time values were selected: 15, 30, 60, 90, and 115 min.
Forecast values were generated for 2-h durations into the future, with reference values being each time stamp, which is each quarter of the hour for each hour of all five dates of interest. Curves for each of the forecast lead times were constructed and plotted along with the real-time observations provided by KC Scout.
The 30-min forecast plot shows the forecast values for each time point predicted at a reference time 30 min before each time point. The 90-min forecast plot displays the forecast values the models predicted for each time point when the reference value was 90 min before each time point.
Three formulas were used to calculate and compare the speed forecast errors: (1) absolute error was calculated to determine the difference between the forecast speed and the actual detector speed, (2) relative absolute error was calculated to measure how large the absolute error was compared to the actual speed and provided an indication of the relative size of the error, and (3) root mean square error was calculated to measure the spread (or concentration) between forecasts and actual speeds. For all three measures, lower numbers mean forecast and actual speeds are a better match.
Figure 3 shows the absolute error formula:
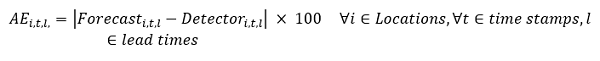
Figure 3. Equation. Absolute error formula.
For i is for location, t is for time stamp, and l is for lead times: AE subscript i comma t comma l equals absolute value of forecast subscript i comma t comma l minus detector subscript i comma t comma l close absolute value times 100 where for all elements of locations i comma for all elements of timestamps t comma elements of lead times.
In the above formula, the index i represents each location being explored; t is the time stamp, which includes 12 a.m., 12:15 a.m., 12:30 a.m.,…, 11:30 p.m., 11:45 p.m., and 12 p.m.; and l represents the eight different lead time forecast periods used in the analysis, including 15, 30, 45, 60, 75, 90, 105, and 115 min.
Figure 4 shows the relative absolute error formula:
Figure 4. Equation. Relative absolute error formula.
For i is for location, t is for time stamp, and l is for lead times: AE subscript i comma t comma l equals absolute value of forecast subscript i comma t comma l minus detector subscript i comma t comma l close absolute value divided by detector subscript i comma t comma l, that total times 100, where for all elements of locations i comma for all elements of timestamps t comma elements of lead times.
In the above formula, the index i represents each location being explored; t is the time stamp, which includes 12 a.m., 12:15 a.m., 12:30 a.m.,…, 11:30 p.m., 11:45 p.m., and 12 p.m.; and l represents the eight different lead time forecast periods used in the analysis, including 15, 30, 45, 60, 75, 90, 105, and 115 min.
Figure 5 shows the root mean square error formula:
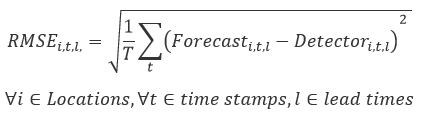
Figure 5. Equation. Root mean square error formula.
For i is for location, t is for time stamp, and l is for lead times: RMSE subscript i comma t comma l equals square root of one divided by T summation t open parenthesis forecast subscript i comma t comma l minus detector subscript i comma t comma l close parenthesis squared, where for all elements of locations i comma for all elements of timestamps t comma elements of lead times.
In the above formula, the index i represents each location being explored; t is the time stamp, which includes 12 a.m., 12:15 a.m., 12:30 a.m.,…, 11:30 p.m., 11:45 p.m., and 12 p.m.; and l represents the eight different lead time forecast periods used in the analysis, including 15, 30, 45, 60, 75, 90, 105, and 115 min.
When observed detector values were not available to compare at a time stamp, an approximated observed detector value was linearly interpolated given data points surrounding the missing value.
Usefulness Study
The usefulness study investigated KC Scout staff perceptions, attitudes, and behaviors. The evaluation team gathered inputs from four KC Scout operators and supervisors who periodically used the IMRCP system over the last two winter seasons (winter 2018–2019 and winter 2019–2020). The team held phone interviews in June 2019 and followed up with a written questionnaire in February 2020. The team also held periodic phone calls throughout the winter seasons with a KC Scout representative to check-in about status and usage of IMRCP within the KC Scout TMC and Missouri Department of Transportation's maintenance/winter weather response group.
The goals of the interviews and discussions with the operators and supervisors were to learn about the users' experiences and perceptions relating to:
- Usage of IMRCP prior to, during, and after weather events.
- Accuracy of IMRCP information and forecasts.
- Integration of IMRCP into processes.
- Perspectives of IMRCP, overall (i.e., benefits, limitations, and lessons learned).
previous | next