Integrated Modeling for Road Condition Prediction — Phase 3 Evaluation Report
Chapter 3. Results
This chapter presents the analyses for the Integrated Modeling for Road Condition Prediction (IMRCP) speeds and speed forecast predictions and user satisfaction interviews.
Operational Impacts Study
The IMRCP analyses examined IMRCP-predicted speeds versus historical Kansas City Scout (KC Scout) detector speeds, IMRCP speed forecasts, and IMRCP speed forecast errors. Real-time speeds and speed predictions were examined for Traffic Estimation and Prediction System (TrEPS) and machine learning-based prediction (MLP) for seven 2019–2020 weather event days.
Appendix A displays tables that contain the absolute, relative absolute, and root mean square errors by date and location for the speed forecasts.
Table 3 describes the weather event dates and weather conditions. The data were collected through the IMRCP tool's reports page. Historical data were collected from the IMRCP tool for each of the seven days from midnight to midnight. The historical data consist of observed real-time values from the detectors and real-time predictions from the model sources.
Table 3. Description of weather events.
| Date |
Weather and Road Condition |
| 11/11/2019 |
Light snow/snow and wind gusts |
| 11/29/2019 |
Wet, frosty roads; upstream incident (at State Line Road) |
| 12/15/2019 |
Ice, snow, and light wind; downstream incident (at Stadium Drive) |
| 12/16/2019 |
Afternoon light snow and some haze; evening snow |
| 12/17/2019 |
Morning fog; fair in the afternoon; temperatures in mid- to upper- 20s; light winds |
| 1/29/2020 |
Freezing rain/light snow/wintry mixture |
| 2/12/2020 |
Snow with wet roads |
The following observation types were selected for exploration in this evaluation: SPDLNK (average speed of vehicles on each link), VIS (surface visibility), TPVT (pavement temperature), and PCCAT (precipitation category). Sources for these observations vary. SPDLNK has three sources: KC Scout, TrEPS, and MLP. KC Scout provides real-time data from the detectors, while TrEPS and MLP provide both real-time and forecast data predicted using different model algorithms. The two sources for VIS are Real-Time Mesoscale Analysis (RTMA) and Rapid Refresh (RAP). According to the IMRCP system user guide, RTMA supplies VIS observations collected in 3 x 3-kilometer (km) grids, whereas RAP provides VIS forecast values collected in 13 x 13-km grids. TPVT estimations are supplied by the Model of the Environment and Temperature of Roads (METRo), and PCCAT observations are provided by RAP. The different categories for PCCAT are listed in Appendix D of the IMRCP system user guide.
Interstate 435 Eastbound at State Line Road
November 11, 2019, Weather and Road Conditions
The following plots display the historical data for real-time speeds obtained for Interstate 435 (I–435) and State Line Road during November 11, 2019. The temperature was in the low 30s and dropped throughout the day to about 12 degrees Fahrenheit (°F) by midnight, with periods of icing rain, light snow, and wind gusts up to 45 miles per hour (mph) from 4 a.m. to 1 p.m. The road conditions were icy with melting snow until about 2 p.m. and were dry afterwards. The road also had an upstream incident that occurred from 6:46 to 7:11 a.m., and the movement of eastbound (EB) traffic was affected by a construction work zone on I–435 at State Line Road. The construction in the area resulted in a lane shift and a reduced speed limit, which also affected traffic speeds.
November 11, 2019, Speed Predictions
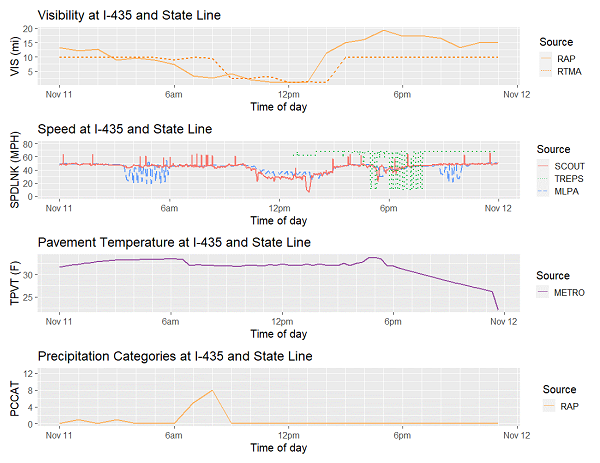
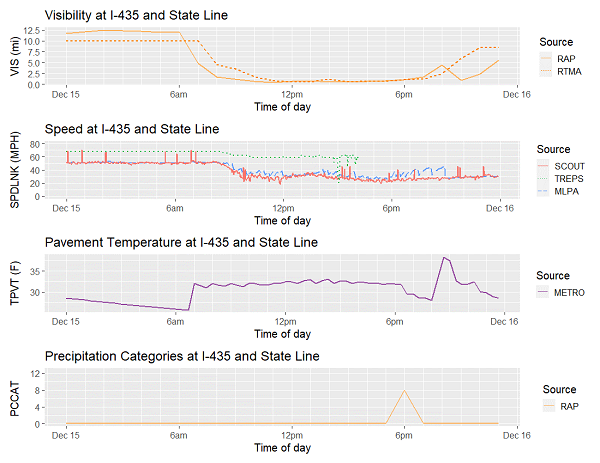
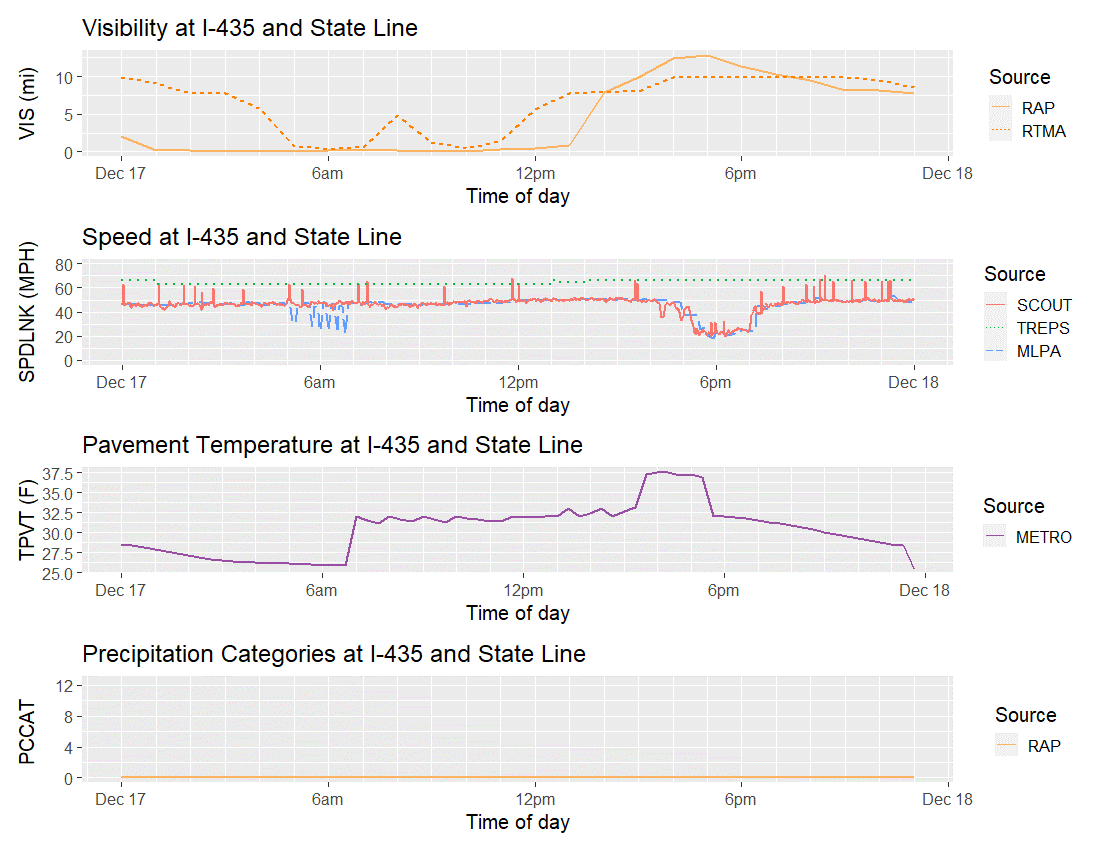
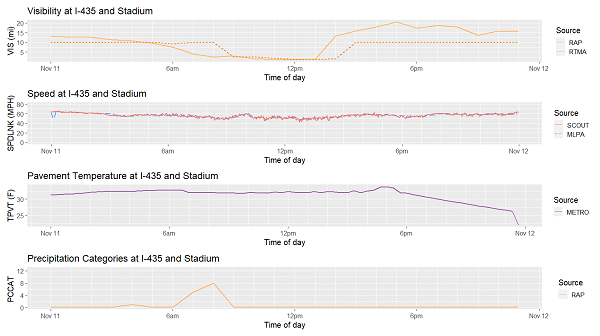
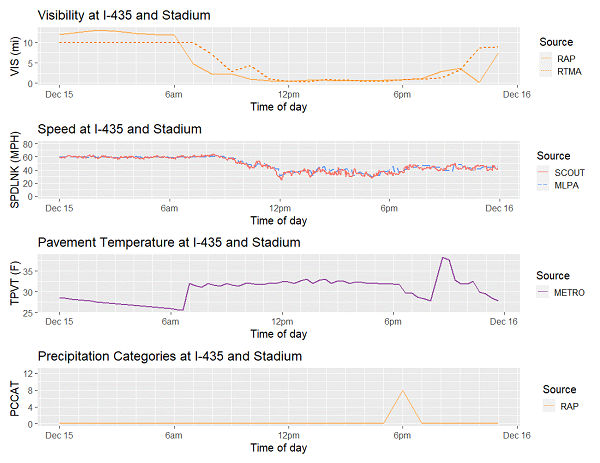
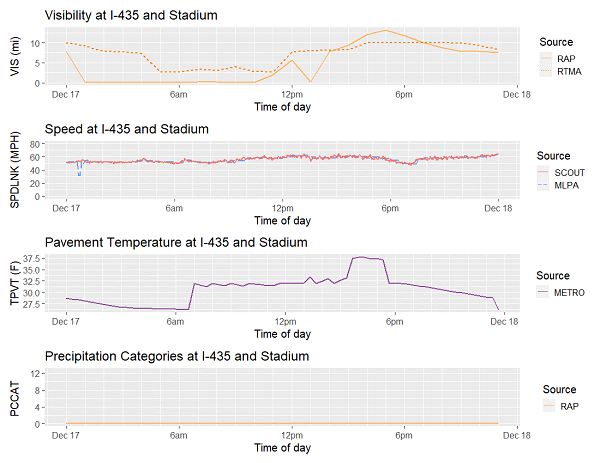
The plots in figure 6 depict, from top to bottom, VIS, SPDLNK, TPVT, and PCCAT on November 11, 2019. The x-axes in each plot represent the time of day from early morning to midnight. The four plots present a snapshot of the speeds and weather conditions for the day.
- Visibility was reduced between 7 a.m. and 1 p.m., according to the RAP and RTMA sources.
- The speed plot shows the reported speeds from KC Scout roadway detectors, TrEPS, and MLP and the fluctuation and deviations during the day.
- TrEPS speeds were unavailable until early afternoon and then reported fluctuating speeds from 5 to 8 p.m. Sometimes, the speeds were 10–15 mph above/below the speed detector data.
- MLP speeds experienced similar speed fluctuations during two periods: 3:30–6 a.m. and 8:45–10 p.m. Otherwise, the MLP speed predictions appeared to be within about 5 mph of the detector data
a.m. = ante meridiem. F = Fahrenheit. I–435 = Interstate 435. METRo = Model of the Environment and Temperature of Roads. mi = mile. MLPA = machine learning-based prediction model A. mph = mile per hour. p.m. = post meridiem. PCCAT = precipitation category. RAP = Rapid Refresh. RTMA = Real-Time Mesoscale analysis. SCOUT = Kansas City Scout. SPDLNK = average speed of vehicles on each link. TPVT = temperature of pavement. TREPS = Traffic Estimation and Prediction System. VIS = visibility of surface.
Source: Federal Highway Administration
Figure 6. Plot. Interstate 435 and State Line Road historical speeds, November 11, 2019.
November 11, 2019, Speed Forecasts
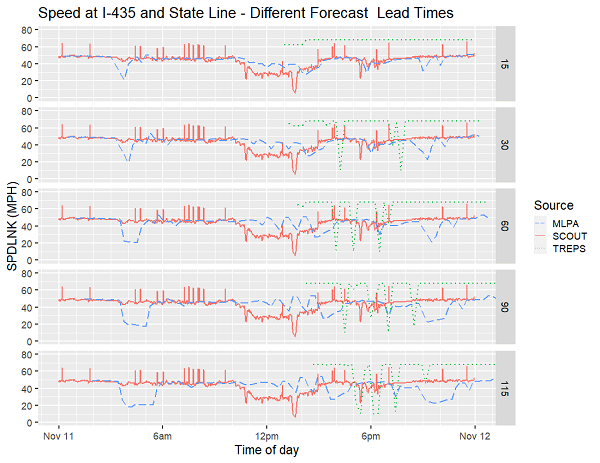
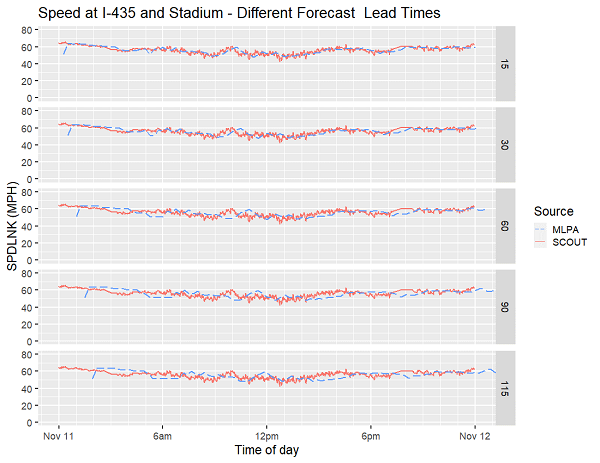
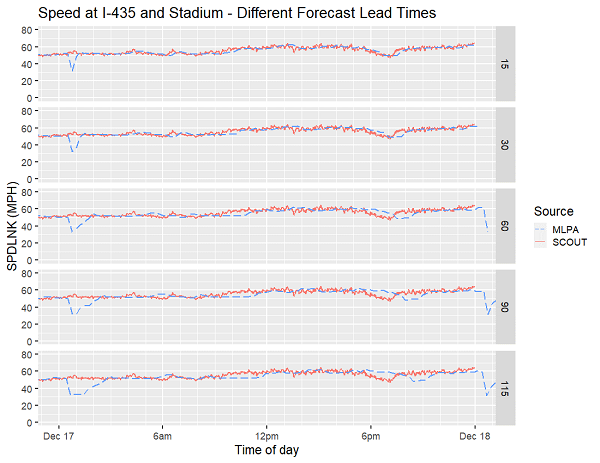
The plots in figure 7 display the speed forecasts obtained for I–435 and State Line Road during November 11, 2019. The plots depict, from top to bottom, the real-time prediction (historical speeds) followed by 15-, 30-, 60-, 90-, and 115-minute (min) forecasts. The plots show:
- Detector, MLP, and TrEPS speeds fluctuated throughout the day for all forecast times.
- MLP and TrEPS speed forecasts both showed periods where the forecasts appeared to have large deviations above and below the detector speeds. The deviations appeared to grow larger with longer forecasts.
a.m. = ante meridiem. I–435 = Interstate 435. MLPA = machine learning-based prediction model A. mph = mile per hour. p.m. = post meridiem. SCOUT = Kansas City Scout. SPDLNK = average speed of vehicles on each link. TREPS = Traffic Estimation and Prediction System.
Source: Federal Highway Administration
Figure 7. Plot. Interstate 435 and State Line Road forecast speeds, November 11, 2019.
November 29, 2019, Weather and Road Conditions
On November 29, 2019, the weather temperature was in the mid 30s, with dew and frost warnings and wind gusts up to 15 mph throughout the day and night. The road conditions were wet and frosty in the morning and wet during the evening. The road also had an upstream incident that occurred from 9:52 a.m. to 12:02 p.m., and the movement of EB traffic was affected by a construction work zone on I–435 at State Line Road. The construction in the area resulted in a lane shift and a reduced speed limit, which also affected traffic speeds.
November 29, 2019, Speed Predictions
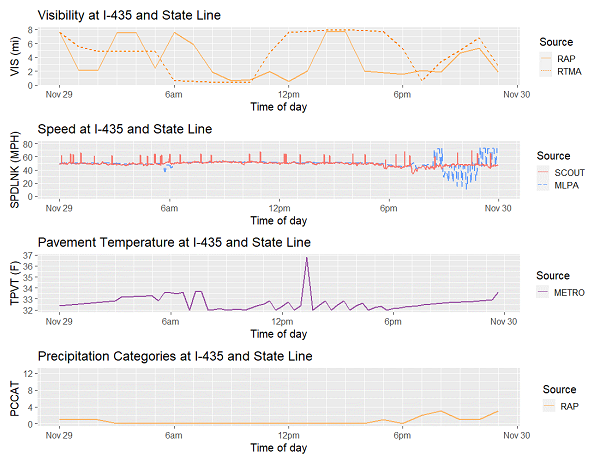
The plots in figure 8 display the historical data obtained for I–435 EB and State Line Road during November 29, 2019. On this particular day, only KC Scout detectors and MLP were reporting speeds.
The plots show:
- There was a dip in visibility in the morning and evening, according to RAP and RTMA sources.
- The data for the TrEPS model were not available on this date.
- In general, the speed predictions by MLP are very similar to the detector speeds, even on an atypical Friday with a weather event.
a.m. = ante meridiem. F = Fahrenheit. I–435 = Interstate 435. METRo = Model of the Environment and Temperature of Roads. mi = mile. MLPA = machine learning-based prediction model A. mph = mile per hour. p.m. = post meridiem. PCCAT = precipitation category. RAP = Rapid Refresh. RTMA = Real-Time Mesoscale Analysis. SCOUT = Kansas City Scout. SPDLNK = average speed of vehicles on each link. TPVT = temperature of pavement. VIS = visibility of surface.
Source: Federal Highway Administration
Figure 8. Plot. Interstate 435 and State Line Road historical speeds, November 29, 2019.
November 29, 2019, Speed Forecasts
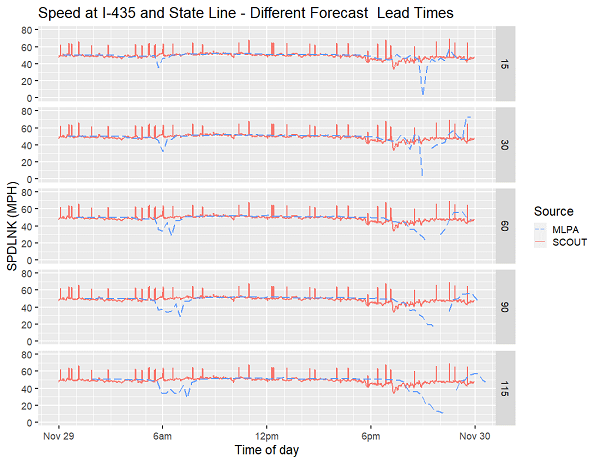
The plots in figure 9 display the forecast speeds obtained for I–435 and State Line Road during November 29, 2019.
The plots show:
- Detector and MLP speeds fluctuated throughout the day for all forecast times.
- MLP speed forecasts showed periods where the forecasts appeared to have large deviations above and below the detector speeds. The deviations appeared to grow larger with longer forecasts.
- TrEPS forecasts were not available for this date.
a.m. = ante meridiem. I–435 = Interstate 435. MLPA = machine learning-based prediction model A. mph = mile per hour. p.m. = post meridiem. SCOUT = Kansas City Scout. SPDLNK = average speed of vehicles on each link.
Source: Federal Highway Administration
Figure 9. Plot. Interstate 435 and State Line Road forecast speeds, November 29, 2019.
December 15, 2019, Weather and Road Conditions
On December 15, 2019, the weather temperature was in the mid 20s with a light wind (less than 10 mph) in the morning. The road conditions were dry in the early morning but snowy by 9 a.m., slushy at noon, and icy and snowy during the evening commute. The movement of EB traffic was affected by a construction work zone on I–435 at State Line Road. The construction in the area resulted in a lane shift and a reduced speed limit, which also affected traffic speeds.
December 15, 2019, Speed Predictions
The plots in figure 10 display the historical data obtained for I–435 and State Line Road during December 15, 2019. The plots show:
- Visibility was reduced between 7 a.m. and 7 p.m.
- TrEPS speeds were higher than reported by the detectors for most of the day and were unavailable after 1 p.m. on this date.
- Speed predictions by MLP were fairly accurate during the slow down between 9 a.m. and noon.
- There was an increase in MLP predicted speeds at 6 p.m. The predictions between 6 and 9 p.m. were higher than the recorded detector speed data during this time.
a.m. = ante meridiem. F = Fahrenheit. I–435 = Interstate 435. METRo = Model of the Environment and Temperature of Roads. mi = mile. MLPA = machine learning-based prediction model A. mph = mile per hour. p.m. = post meridiem. PCCAT = precipitation category. RAP = Rapid Refresh. RTMA = Real-Time Mesoscale Analysis. SCOUT = Kansas City Scout. SPDLNK = average speed of vehicles on each link. TPVT = temperature of pavement. VIS = visibility of surface. TREPS = Traffic Estimation and Prediction System.
Source: Federal Highway Administration
Figure 10. Plot. Interstate 435 and State Line Road historical speeds, December 15, 2019.
December 15, 2019, Speed Forecasts
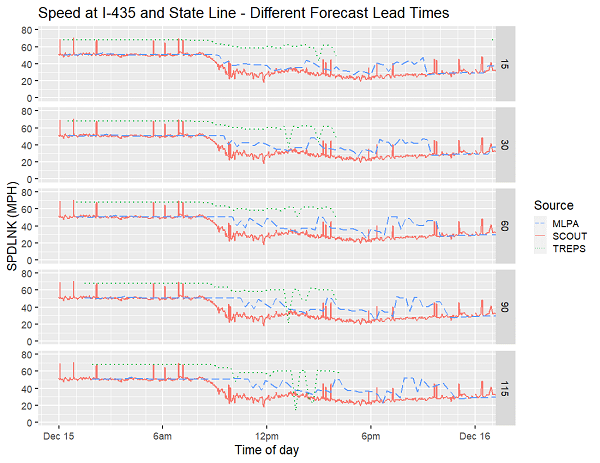
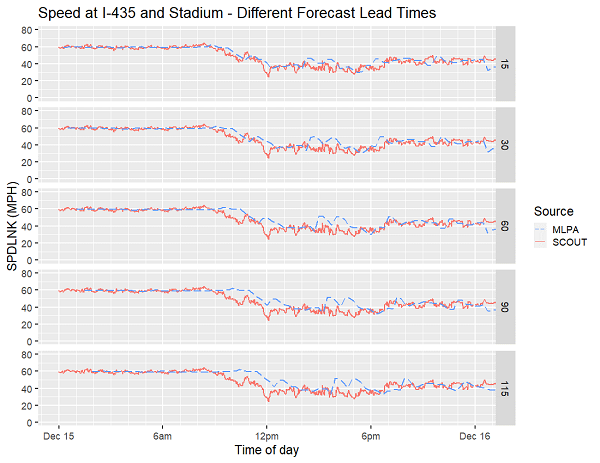
The plots in figure 11 display the forecast speeds obtained for I–435 and State Line Road during December 15, 2019. The plots show:
- Detector, MLP, and TrEPS speeds fluctuated throughout the day for all forecast times.
- TrEPS speeds were consistently higher than the detector speeds.
- MLP and TrEPS speed forecasts both showed periods where the forecasts appeared to have large deviations above and below the detector speeds. The deviations appeared to grow larger with longer forecasts.
a.m. = ante meridiem. I–435 = Interstate 435. MLPA = machine learning-based prediction model A. mph = mile per hour. p.m. = post meridiem. SCOUT = Kansas City Scout. SPDLNK = average speed of vehicles on each link. TREPS = Traffic Estimation and Prediction System.
Source: Federal Highway Administration
Figure 11. Plot. Interstate 435 and State Line Road forecast speeds, December 15, 2019.
December 16, 2019, Weather and Road Conditions
On December 16, 2019, the weather temperature was in the low 30s with no precipitation and a light wind (less than 10 mph) in the morning. There was light snow and some haze during the afternoon, and it was snowy during the evening. The road conditions were dry until noon, but had melting snow and some haze during the afternoon and ice and snow during the evening commute. The movement of EB traffic was affected by a construction work zone on I–435 at State Line Road. The construction in the area resulted in a lane shift and a reduced speed limit which, also affected traffic speeds.
December 16, 2019, Speed Predictions
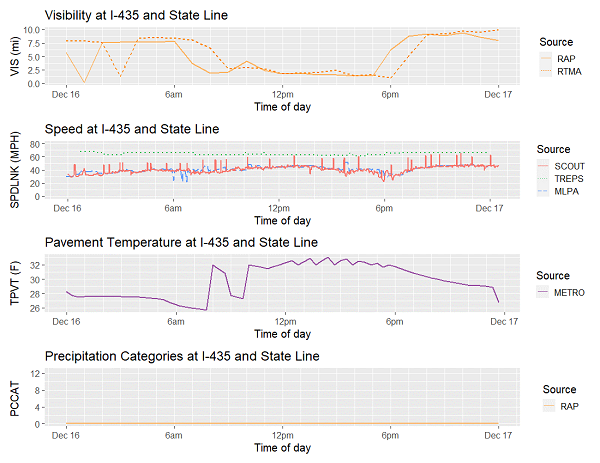
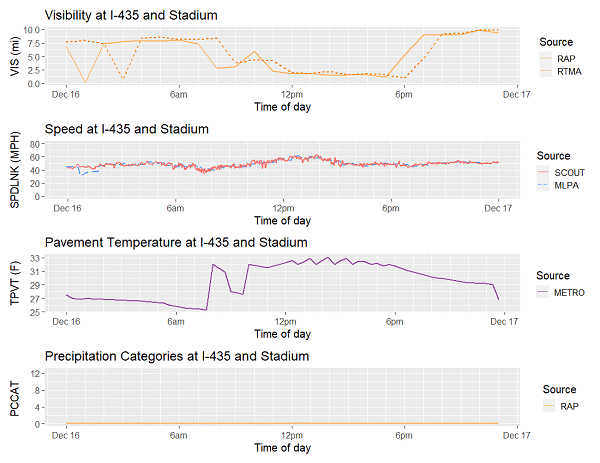
The plots in figure 12 display the historical data obtained for I–435 and State Line Road during December 16, 2019.
The plots show:
- There was a reduction in visibility starting in the morning, which remained low until about 6 p.m. according to RAP and RTMA sources.
- TrEPS speeds were higher than the detector throughout the day.
- MLP speeds tracked the detector speeds fairly closely for most of the day.
a.m. = ante meridiem. F = Fahrenheit. I–435 = Interstate 435. METRo = Model of the Environment and Temperature of Roads. mi = mile. MLPA = machine learning-based prediction model A. mph = mile per hour. p.m. = post meridiem. PCCAT = precipitation category. RAP = Rapid Refresh. RTMA = Real-Time Mesoscale Analysis. SCOUT = Kansas City Scout. SPDLNK = average speed of vehicles on each link. TPVT = temperature of pavement. VIS = visibility of surface. TREPS = Traffic Estimation and Prediction System.
Source: Federal Highway Administration
Figure 12. Plot. Interstate 435 and State Line Road historical speeds, December 16, 2019.
December 16, 2019, Speed Forecasts
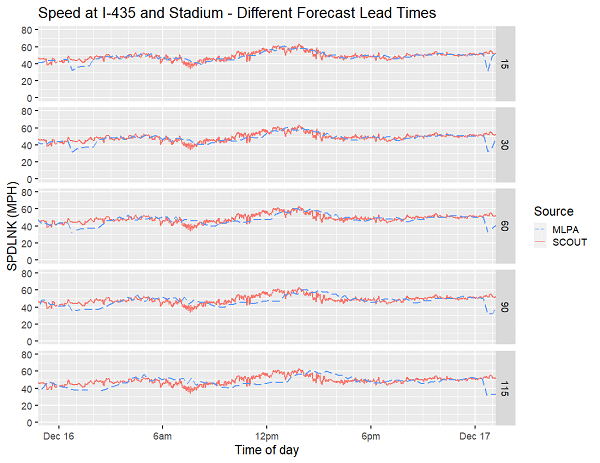
The plots in figure 13 display the forecast speeds obtained for I–435 and State Line Road during December 16, 2019.
The plots show:
- Detector, MLP, and TrEPS speeds fluctuated throughout the day for all forecast times.
- TrEPS speeds were consistently higher than the detector speeds.
- MLP and TrEPS speed forecasts both showed periods where the forecasts appeared to have large deviations above and below the detector speeds. The MLP speed deviations appeared to grow larger with longer forecasts.
a.m. = ante meridiem. I–435 = Interstate 435. MLPA = machine learning-based prediction model A. mph = mile per hour. p.m. = post meridiem. SCOUT = Kansas City Scout. SPDLNK = average speed of vehicles on each link. TREPS = Traffic Estimation and Prediction System.
Source: Federal Highway Administration
Figure 13. Plot. Interstate 435 and State Line Road forecast speeds, December 16, 2019.
December 17, 2019, Weather and Road Conditions
On December 17, 2019, the weather temperature was in the mid- to upper 20s with no precipitation and a light wind (less than 10 mph) throughout the day and night. There was no precipitation during the day. The road conditions were dry during the morning, midday, and evening times. The movement of EB traffic was affected by a construction work zone on I–435 at State Line Road. The construction in the area resulted in a lane shift and a reduced speed limit, which also affected traffic speeds.
December 17, 2019, Speed Predictions
The plots in figure 14 display the historical data obtained for I–435 and State Line Road during December 17, 2019. For this day:
- There was a reduction in visibility from early morning to midafternoon, according to RAP and RTMA sources.
- TrEPS model speeds were not very accurate on this day and were consistently higher than the KC Scout detector speeds.
- MLP speeds tracked the detector speeds fairly closely for most of the day. However, between 5 and 7 a.m., there were periods when speeds were considerably lower than the detector speeds. The MLP speeds evening rush hour effect was captured well by the speed predictions from the MLP model.
a.m. = ante meridiem. F = Fahrenheit. I–435 = Interstate 435. METRo = Model of the Environment and Temperature of Roads. mi = mile. MLPA = machine learning-based prediction model A. mph = mile per hour. p.m. = post meridiem. PCCAT = precipitation category. RAP = Rapid Refresh. RTMA = Real-Time Mesoscale Analysis. SCOUT = Kansas City Scout. SPDLNK = average speed of vehicles on each link. TPVT = temperature of pavement. VIS = visibility of surface. TREPS = Traffic Estimation and Prediction System.
Source: Federal Highway Administration
Figure 14. Plot. Interstate 435 and State Line Road historical speeds, December 17, 2019.
December 17, 2019, Speed Forecasts
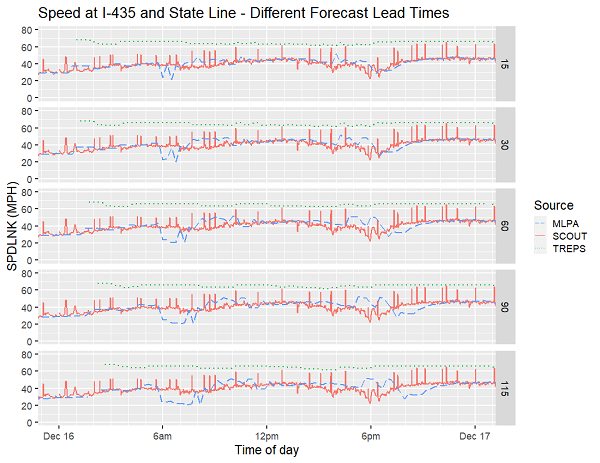
The plots in figure 15 display the forecast speeds obtained for I–435 and State Line Road during December 17, 2019. The plots show:
- Detector, MLP, and TrEPS speeds fluctuated throughout the day for all forecast times.
- TrEPS speeds were consistently higher than the detector speeds and do not reflect the decline in detected speeds from about 5 to 7 p.m.
- MLP speeds decrease similar to the the decline in detected speeds from about 5 to 7 p.m.
- MLP and TrEPS speed forecasts both showed periods where the forecasts appeared to have large deviations above and below the detector speeds. The MLP speed deviations appeared to grow larger with longer forecasts.
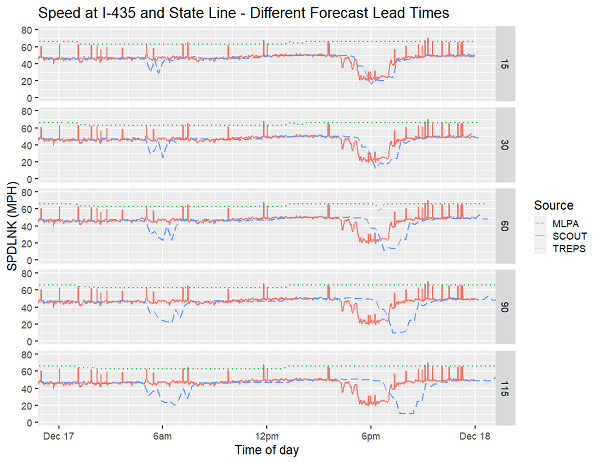
a.m. = ante meridiem. I–435 = Interstate 435. MLPA = machine learning-based prediction model A. mph = mile per hour. p.m. = post meridiem. SCOUT = Kansas City Scout. SPDLNK = average speed of vehicles on each link. TREPS = Traffic Estimation and Prediction System.
Source: Federal Highway Administration
Figure 15. Plot. Interstate 435 and State Line Road forecast speeds, December 17, 2019.
Speed Forecast Error Analysis for Interstate 435 and State Line Road
Figure 16 shows the MLP absolute error for the 15–115-min speed forecasts on November 11, 29, December 15, 16, and 17. Figure 17 shows the TrEPS absolute errors for the same forecast time periods. The plots show:
- For MLP, the absolute errors show that shorter-term forecasts tended to have smaller errors than longer-term forecasts. Consequently, the shorter-term forecasts tended to be more accurate. The average absolute error for the 15-min forecast was about 6.2 mph, whereas the 115-min forecast increased to about 14.8 mph.
- For TrEPS, the absolute errors were relatively consistent across all forecast times. The average absolute error was about 26 mph for all forecast times.
- Comparing the MLP to TrEPS absolute errors, the TrEPS errors tended to be larger than the MLP absolute errors. The average TrEPS error across all forecast times was about 26 mph versus about 10.6 mph for MLP.
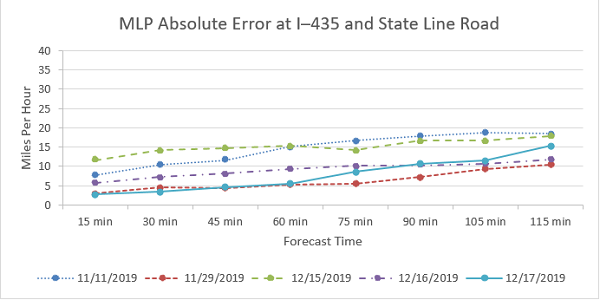
I–435 = Interstate 435. min = minute. MLP = machine learning-based prediction.
Source: Federal Highway Administration
Figure 16. Graph. Machine learning-based prediction absolute error at Interstate 435 and State Line Road.
This graph shows the Machine learning-based prediction absolute error at Interstate 435 and State Line Road for five dates: November 11 and 29, and December 15, 16, and 17, 2019. The x axis is labeled forecast time and is in 15 minute increments from 15 to 115 minutes. The y axis ranges from 0 to 40 miles per hour with tic marks every 5 miles per hour. The plotted points for curves representing the five dates are as follows for the 15, 30, 45, 60, 75, 90, 105 and 115 minute times, respectively. For November 11: 8, 10, 12, 15, 16, 17, 18 19, and 18. For November 29: 4, 5, 5, 5, 5, 7, 9, and 10. For December 15: 12, 14, 15, 15, 14, 16, 16, 17. For December 16: 6, 7, 8, 9, 10, 10, 10, and 11. For December 17: 3, 4, 5, 5, 9, 10, 11, and 15.
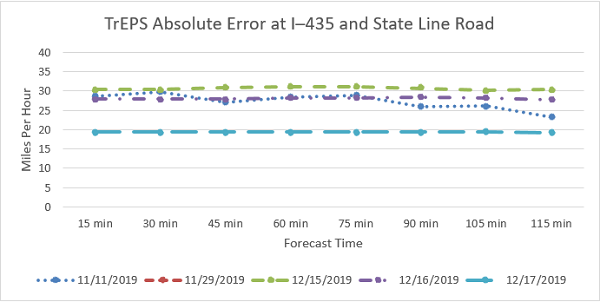
I–435 = Interstate 435. min = minute. TREPS = Traffic Estimation and Prediction System.
Source: Federal Highway Administration
Figure 17. Graph. Traffic Estimation and Prediction System absolute error at Interstate 435 and State Line Road.
This graph shows the Traffic Estimation and Prediction System absolute error at Interstate 435 and State Line Road for five dates: November 11 and 29, and December 15, 16, and 17, 2019. The x axis is labeled forecast time and is in 15 minute increments from 15 to 115 minutes. The y axis ranges from 0 to 40 miles per hour with tic marks every 5 miles per hour. The plotted points for curves representing the five dates are as follows for the 15, 30, 45, 60, 75, 90, 105 and 115 minute times, respectively. For November 11: 28, 30, 27, 28, 29, 26, 26, and 23. For November 29: not plotted. For December 15: 30, 30, 31, 31, 31, 31, 30, and 30. For December 16: 28, 28, 28, 28, 28, 28, 28, and 28. For December 17: 20, 20, 20, 20, 19.5, 19.5, 19.5, and 19.5.
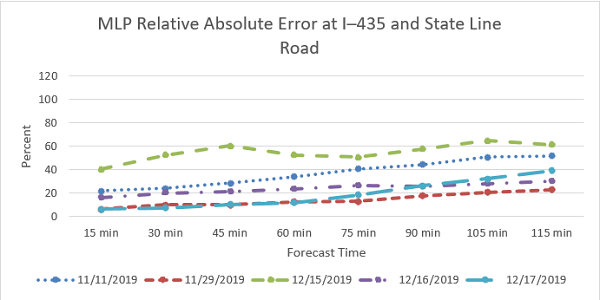
Figure 18 and figure 19 show the relative absolute errors for MLP and TrEPS at I–435 and State Line Road on November 11, 29, December 15, 16, and 17, 2019, for 15–115-min forecasts. The relative absolute error measured the magnitude (in percent) of the absolute error as compared to the actual speed. The plots show:
- For MLP, the relative absolute error for shorter-term forecasts tended to be smaller than the errors for longer-term forecasts. In other words, the error as a percentage of the speed was smaller for shorter-term forecasts. The average relative absolute error for the 15-min forecast was about 18 percent, whereas the 115-min forecast increased to about 41 percent.
- For TrEPS, the relative absolute errors were relatively large (ranging from 40 to over 100 percent) and mostly consistent across all forecast times. The average relative absolute error was about 73 percent for all forecast times.
- Comparing the MLP to TrEPS relative absolute errors, the TrEPS errors tended to be larger than the MLP errors. The average TrEPS error across all forecast times was about 73 percent versus about 29 percent for MLP.
I–435 = Interstate 435. min = minute. MLP = machine learning-based prediction.
Source: Federal Highway Administration
Figure 18. Graph. Machine learning-based prediction relative absolute Error at Interstate 435 and State Line Road.
This graph shows the Machine learning-based prediction relative absolute Error at Interstate 435 and State Line Road for five dates: November 11 and 29, and December 15, 16, and 17, 2019. The x axis is labeled forecast time and is in 15 minute increments from 15 to 115 minutes. The y axis ranges from 0 to 120 percent with tic marks every 20 percent. The plotted points for curves representing the five dates are as follows for the 15, 30, 45, 60, 75, 90, 105 and 115 minute times, respectively. For November 11: 20, 23, 30, 35, 40, 43, 51, and 54. For November 29: 7, 10, 10, 11, 12, 18, 20, and 22. For December 15: 40, 55, 60, 55, 54, 59, 63, and 61. For December 16: 17, 20, 21, 23, 26, 26, 25, and 26. For December 17: 7, 10, 10, 11, 18, 23, 30, and 40.
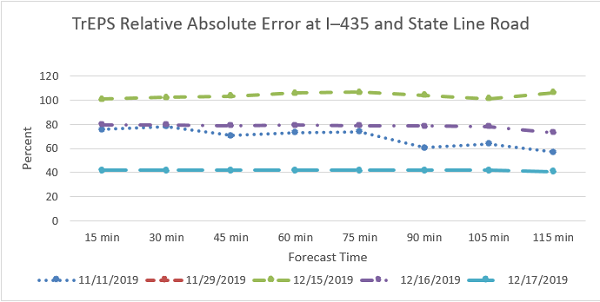
I–435 = Interstate 435. min = minute. TREPS = Traffic Estimation and Prediction System.
Source: Federal Highway Administration
Figure 19. Graph. Traffic Estimation and Prediction System relative absolute error at Interstate 435 and State Line Road.
This graph shows the Traffic Estimation and Prediction System relative absolute error at Interstate 435 and State Line Road for five dates: November 11 and 29, and December 15, 16, and 17, 2019. The x axis is labeled forecast time and is in 15 minute increments from 15 to 115 minutes. The y axis ranges from 0 to 120 percent with tic marks every 20 percent. The plotted points for curves representing the five dates are as follows for the 15, 30, 45, 60, 75, 90, 105 and 115 minute times, respectively. For November 11: 75, 78, 70, 73, 75, 60, 63, and 59. For November 29: not plotted. For December 15: 100, 105, 107, 108, 108, 107, 102, and 108. For December 16: 80, 80, 80, 80, 80, 80, 80, and 79. For December 17: 41, 41, 41, 41, 41, 41, 41, and 41.
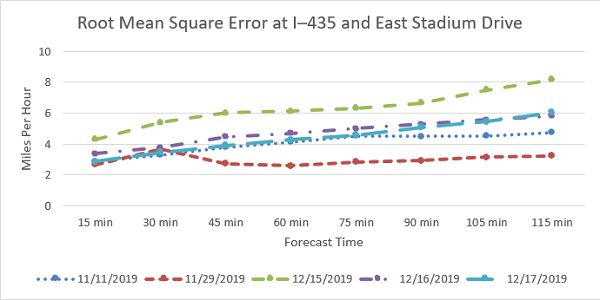
Figure 20 and figure 21 show the root mean square errors for MLP and TrEPS at I–435 and State Line Road on November 11, 29, December 15, 16, and 17, 2019, for 15–115-min forecasts. The root mean square errors measure the deviation or spread of the forecast versus actual speeds. The plots show:
- For MLP, the root mean square error showed that the shorter-term forecasts errors tended to be smaller than longer-term forecasts. The average root mean square error for the 15-min forecast was about 6 mph versus about 12 mph for the 115-min forecast.
- For TrEPS, the root mean square errors were relatively consistent across all forecast times. The average root mean square error was about 23 mph for all forecast times.
- Comparing the MLP to TrEPS root mean square errors, the TrEPS errors were about twice as large as MLP. The average TrEPS error across all forecast times was about 23 mph versus about 10 mph for MLP.
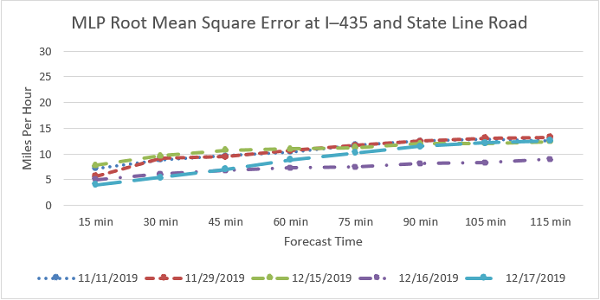
I–435 = Interstate 435. min = minute. MLP = machine learning-based prediction.
Source: Federal Highway Administration
Figure 20. Graph. Machine learning-based prediction root mean square error at Interstate 435 and State Line Road.
This graph shows the Machine learning-based prediction root mean square error at Interstate 435 and State Line Road for five dates: November 11 and 29, and December 15, 16, and 17, 2019. The x axis is labeled forecast time and is in 15 minute increments from 15 to 115 minutes. The y axis ranges from 0 to 30 miles per hour with tic marks every 5 miles per hour. The plotted points for curves representing the five dates are as follows for the 15, 30, 45, 60, 75, 90, 105 and 115 minute times, respectively. For November 11: 7, 9, 10, 11, 12, 13, 13, and 13. For November 29: 6, 9, 10, 11, 12, 12, 13, and 13. For December 15: 8, 10, 11, 11, 11, 12, 12, and 12. For December 16: 5, 6, 7, 7, 7, 8, 8, and 9. For December 17: 4, 5, 6, 8, 10, 12, 13, and 13.
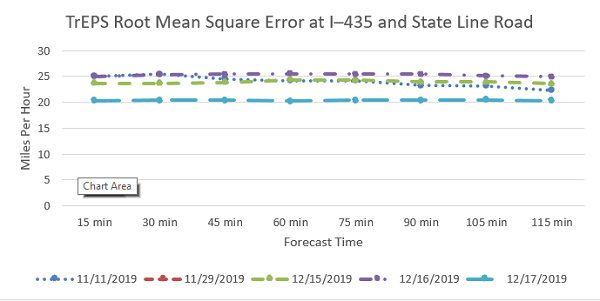
I–435 = Interstate 435. min = minute. TREPS = Traffic Estimation and Prediction System.
Source: Federal Highway Administration
Figure 21. Graph. Traffic Estimation and Prediction System root mean square error at Interstate 435 and State Line Road.
This graph shows the Machine learning-based prediction root mean square error at Interstate 435 and State Line Road for five dates: November 11 and 29, and December 15, 16, and 17, 2019. The x axis is labeled forecast time and is in 15 minute increments from 15 to 115 minutes. The y axis ranges from 0 to 30 miles per hour with tic marks every 5 miles per hour. The plotted points for curves representing the five dates are as follows for the 15, 30, 45, 60, 75, 90, 105 and 115 minute times, respectively. For November 11: 25, 26, 24, 24, 24, 23, 23, and 22. For November 29: not plotted. For December 15: 24, 24, 24, 24, 24, 24, 24, and 24. For December 16: 25, 25, 25, 25, 25, 25, 25, and 25. For December 17: 21, 21, 21, 21, 21, 21, 21, and 21.
Interstate 435 Northbound at East Stadium Drive
November 11, 2019, Weather and Road Conditions
On November 11, 2019, the weather temperature was in the low 30s and dropped throughout the day to about 12 °F by midnight, with periods of icing rain, light snow, and wind gusts up to 45 mph from 4 a.m. to 1 p.m. The road conditions had freezing rain during the morning and ice and snow at noon, and were dry in the afternoon and evening.
November 11, 2019, Speed Predictions
The plots in figure 22 display the historical data obtained for I–435 and East Stadium Drive for the seven days. In the plots, speeds for only KC Scout and MLP are available because this location is outside the TrEPS network. The plots show:
- There was a dip in visibility in the morning, according to both sources, and an increase in precipitation.
- MLP speed predictions were similar to the detector data throughout the entire day at this location. There was an incident between 7:44 a.m. and 2:09 p.m. on I–435 southbound upstream from the detector.
a.m. = ante meridiem. F = Fahrenheit. I–435 = Interstate 435. METRo = Model of the Environment and Temperature of Roads. mi = mile. MLPA = machine learning-based prediction model A. mph = mile per hour. p.m. = post meridiem. PCCAT = precipitation category. RAP = Rapid Refresh. RTMA = Real-Time Mesoscale Analysis. SCOUT = Kansas City Scout. SPDLNK = average speed of vehicles on each link. TPVT = temperature of pavement. VIS = visibility of surface. TREPS = Traffic Estimation and Prediction System.
Source: Federal Highway Administration
Figure 22. Plot. Interstate 435 and East Stadium Drive historical speeds, November 11, 2019.
November 11, 2019, Speed Forecasts
The plots in figure 23 display the forecast speeds obtained for I–435 and East Stadium Drive during November 11, 2019. In the plots, speed forecasts for only MLP are available because this location is outside the TrEPS network. The plots show:
- Detector and MLP speeds fluctuated throughout the day for all forecast times.
- MLP speed forecasts showed periods where the forecasts appeared to have small deviations above and below the detector speeds. The MLP speed deviations appeared to grow larger with longer forecasts.
a.m. = ante meridiem. I–435 = Interstate 435. MLPA = machine learning-based prediction model A. mph = mile per hour. p.m. = post meridiem. SCOUT = Kansas City Scout. SPDLNK = average speed of vehicles on each link.
Source: Federal Highway Administration
Figure 23. Plot. Interstate 435 and East Stadium Drive forecast speeds, November 11, 2019.
November 29, 2019, Weather and Road Conditions
On November 29, 2019, the weather temperature was in the mid 30s, with dew and frost warnings and wind gusts up to 15 mph throughout the day and night. The road conditions were wet and frosty in the morning and wet during the afternoon and evening.
November 29, 2019, Speed Predictions
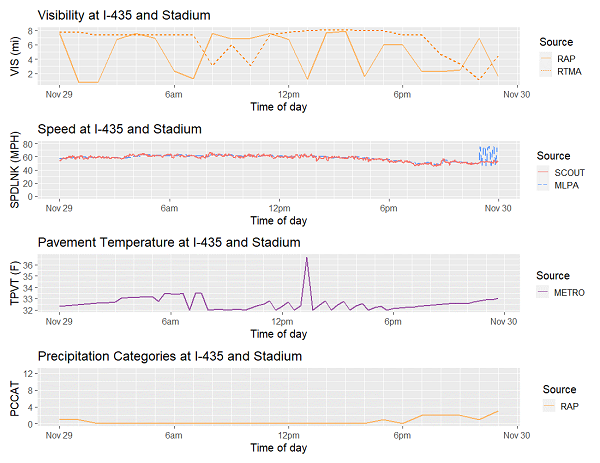
The plots in figure 24 display the historical data obtained for I–435 and East Stadium Drive during November 29, 2019. In the plots, speeds for only KC Scout and MLP are available because this location is outside the TrEPS network.
The plots show:
- Both RAP and RTMA sources indicate visibility varied considerably throughout the day.
- The rush hour effect was less on this day, possibly due to being the Friday after Thanksgiving.
- Speed predictions by MLP were very similar to the detector speeds, even on an atypical Friday with a weather event and varied visibility at this location.
a.m. = ante meridiem. F = Fahrenheit. I–435 = Interstate 435. METRo = Model of the Environment and Temperature of Roads. mi = mile. MLPA = machine learning-based prediction model A. mph = mile per hour. p.m. = post meridiem. PCCAT = precipitation category. RAP = Rapid Refresh. RTMA = Real-Time Mesoscale Analysis. SCOUT = Kansas City Scout. SPDLNK = average speed of vehicles on each link. TPVT = temperature of pavement. VIS = visibility of surface. TREPS = Traffic Estimation and Prediction System.
Source: Federal Highway Administration
Figure 24. Plot. Interstate 435 and East Stadium Drive historical speeds, November 29, 2019.
November 29, 2019, Speed Forecasts
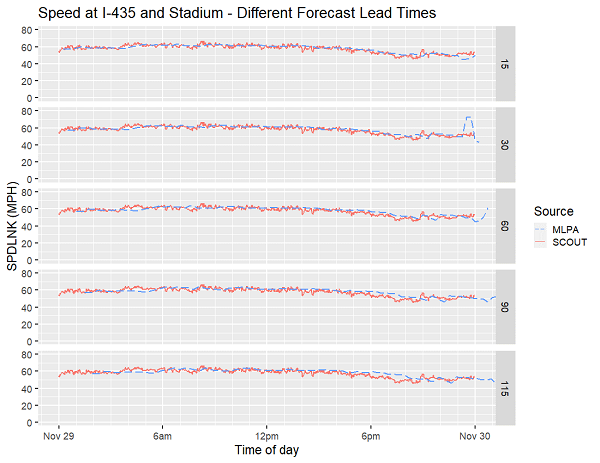
The plots in figure 25 display the forecast speeds obtained for I–435 and East Stadium Drive during November 29, 2019. In the plots, speeds for only KC Scout and MLP are available because this location is outside the TrEPS network. The plots show:
- Detector and MLP speeds fluctuated throughout the day for all forecast times.
- MLP speed forecasts showed periods where the forecasts appeared to have small deviations above and below the detector speeds. The MLP speed deviations appeared to grow larger with longer forecasts.
a.m. = ante meridiem. I–435 = Interstate 435. MLPA = machine learning-based prediction model A. mph = mile per hour. p.m. = post meridiem. SCOUT = Kansas City Scout. SPDLNK = average speed of vehicles on each link.
Source: Federal Highway Administration
Figure 25. Plot. Interstate 435 and East Stadium Drive forecast speeds, November 29, 2019.
December 15, 2019, Weather and Road Conditions
On December 15, 2019, the weather temperature was in the mid-20s with a light wind (less than 10 mph) in the morning. The road conditions were dry in the early morning but snowy by 9 a.m., slushy at noon, and icy and snowy during the evening commute. There was a downstream incident from 10:26 a.m. to 12:51 p.m.
December 15, 2019, Speed Predictions
The plots in figure 26 display the historical data obtained for the first location, I–435 and East Stadium Drive, during December 15, 2019. In the plots, speeds for only KC Scout and MLP are available because this location is outside the TrEPS network.
The plots show:
- Both RAP and RTMA sources indicate that visibility decreased in the morning and remained low until slowly improving in the evening and night.
- Detector speeds recorded a slight decrease in speeds that corresponded to the reduced visibility from the morning and into the night.
- MLP speeds were similar to the detector speeds throughout the entire day at this location.
a.m. = ante meridiem. F = Fahrenheit. I–435 = Interstate 435. METRo = Model of the Environment and Temperature of Roads. mi = mile. MLPA = machine learning-based prediction model A. mph = mile per hour. p.m. = post meridiem. PCCAT = precipitation category. RAP = Rapid Refresh. RTMA = Real-Time Mesoscale Analysis. SCOUT = Kansas City Scout. SPDLNK = average speed of vehicles on each link. TPVT = temperature of pavement. VIS = visibility of surface.
Source: Federal Highway Administration
Figure 26. Plot. Interstate 435 and East Stadium Drive historical speeds, December 15, 2019.
December 15, 2019, Speed Forecasts
The plots in figure 27 display the forecast speeds obtained for I–435 and East Stadium Drive during December 15, 2019. In the plots, speeds for only KC Scout and MLP are available because this location is outside the TrEPS network. The plots show:
- Detector and MLP speeds fluctuated throughout the day for all forecast times.
- MLP speed forecasts showed periods where the forecasts appeared to have small deviations above and below the detector speeds. The MLP speed deviations appeared to grow larger with longer forecasts.
a.m. = ante meridiem. I–435 = Interstate 435. MLPA = machine learning-based prediction model A. mph = mile per hour. p.m. = post meridiem. SCOUT = Kansas City Scout. SPDLNK = average speed of vehicles on each link.
Source: Federal Highway Administration
Figure 27. Plot. Interstate 435 and East Stadium Drive forecast speeds, December 15, 2019.
December 16, 2019, Weather and Road Conditions
On December 16, 2019, the weather temperature was in the low 30s with no precipitation and a light wind (less than 10 mph) in the morning. There was light snow and some haze during the afternoon, and it was snowy during the evening. The road conditions were dry until noon, but had melting snow and some haze during the afternoon and were dry during the evening commute.
December 16, 2019, Speed Predictions
The plots in figure 28 display the historical data obtained for I–435 and East Stadium Drive during December 16, 2019. In the plots, speeds for only KC Scout and MLP are available because this location is outside the TrEPS network.
The plots show:
- Both RAP and RTMA sources indicate that visibility decreased in the morning and remained low until slowly improving at about 6 p.m.
- MLP and detector speeds showed a slight increase from about 8 a.m. to about 2 p.m.
- The MLP speed predictions appeared to well match the detector speeds on this date.
a.m. = ante meridiem. F = Fahrenheit. I–435 = Interstate 435. METRo = Model of the Environment and Temperature of Roads. mi = mile. MLPA = machine learning-based prediction model A. mph = mile per hour. p.m. = post meridiem. PCCAT = precipitation category. RAP = Rapid Refresh. RTMA = Real-Time Mesoscale Analysis. SCOUT = Kansas City Scout. SPDLNK = average speed of vehicles on each link. TPVT = temperature of pavement. VIS = visibility of surface.
Source: Federal Highway Administration
Figure 28. Plot. Interstate 435 and East Stadium Drive historical speeds, December 16, 2019.
December 16, 2019, Speed Forecasts
The plots in figure 29 display the forecast speeds obtained for I–435 and East Stadium Drive during December 16, 2019. In the plots, speeds for only KC Scout and MLP are available because this location is outside the TrEPS network.
The plots show:
- Detector and MLP speeds fluctuated throughout the day for all forecast times.
- TrEPS speeds were not available at this location.
- MLP speed forecasts showed periods where the forecasts appeared to have small deviations above and below the detector speeds. The MLP speed deviations appeared to grow larger with longer forecasts.
a.m. = ante meridiem. I–435 = Interstate 435. MLPA = machine learning-based prediction model A. mph = mile per hour. p.m. = post meridiem. SCOUT = Kansas City Scout. SPDLNK = average speed of vehicles on each link.
Source: Federal Highway Administration
Figure 29. Plot. Interstate 435 and East Stadium Drive forecast speeds, December 16, 2019.
December 17, 2019, Weather and Road Conditions
On December 17, 2019, the weather temperature was in the mid- to upper 20s, with no precipitation and a light wind (less than 10 mph) throughout the day and night. There was no precipitation during the day. The road conditions were dry during the morning, midday, and evening times.
December 17, 2019, Speed Predictions
The plots in figure 30 display the historical data obtained for I–435 and East Stadium Drive during December 17, 2019. In the plots, speeds for only KC Scout and MLP are available because this location is outside the TrEPS network. The plots show:
- RAP and RTMA sources indicate that visibility was low in the morning until slowly improving at about noon.
- MLP and detector speeds showed a slight increase in speeds at about 8 a.m.
- MLP speed predictions appeared to well match the detector speeds on this particular date.
a.m. = ante meridiem. F = Fahrenheit. I–435 = Interstate 435. METRo = Model of the Environment and Temperature of Roads. mi = mile. MLPA = machine learning-based prediction model A. mph = mile per hour. p.m. = post meridiem. PCCAT = precipitation category. RAP = Rapid Refresh. RTMA = Real-Time Mesoscale Analysis. SCOUT = Kansas City Scout. SPDLNK = average speed of vehicles on each link. TPVT = temperature of pavement. VIS = visibility of surface.
Source: Federal Highway Administration
Figure 30. Plot. Interstate 435 and East Stadium Drive historical speeds, December 17, 2019.
December 17, 2019, Speed Forecasts
The plots in figure 31 display the forecast speeds obtained for I–435 and East Stadium Drive during December 17, 2019. In the plots, speeds for only KC Scout and MLP are available because this location is outside the TrEPS network. The plots show:
- Detector and MLP speeds fluctuated throughout the day for all forecast times.
- MLP speed forecasts showed periods where the forecasts appeared to have small deviations above and below the detector speeds. The MLP speed deviations appeared to grow larger with longer forecasts.
a.m. = ante meridiem. I–435 = Interstate 435. MLPA = machine learning-based prediction model A. mph = mile per hour. p.m. = post meridiem. SCOUT = Kansas City Scout. SPDLNK = average speed of vehicles on each link.
Source: Federal Highway Administration
Figure 31. Plot. Interstate 435 and East Stadium Drive forecast speeds, December 17, 2019.
Speed Forecast Error Analysis for Interstate 435 and East Stadium Drive
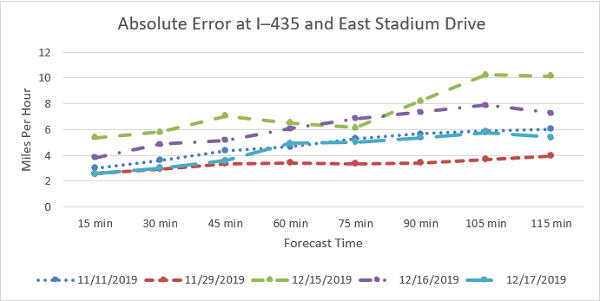
Figure 32 shows the MLP absolute error for the 15–115-min speed forecasts on November 11, 29, December 15, 16, and 17. The plots show:
- The absolute errors show that shorter-term forecasts tended to have smaller errors than longer-term forecasts.
- The shorter-term forecasts tended to be more accurate.
- The average absolute error for the 15-min forecast was about 3.5 mph versus about 6.5 mph for the 115-min forecast.
I–435 = Interstate 435. min = minute.
Source: Federal Highway Administration
Figure 32. Graph. Machine learning-based prediction absolute error at Interstate 435 and East Stadium Drive.
This graph shows the Machine learning-based prediction absolute error at Interstate 435 and East Stadium Drive for five dates: November 11 and 29, and December 15, 16, and 17, 2019. The x axis is labeled forecast time and is in 15 minute increments from 15 to 115 minutes. The y axis ranges from 0 to 12 miles per hour with tic marks every 2 miles per hour. The plotted points for curves representing the five dates are as follows for the 15, 30, 45, 60, 75, 90, 105 and 115 minute times, respectively. For November 11: 3, 3.5, 4.2, 4.6, 5.3, 5.8, 5.9, and 6. For November 29: 2.8, 3, 3.2, 3.4, 3.4, 3.5, 3.7, 3.8, and 4. For December 15: 5.5, 6, 7.2, 6.5, 6.2, 8.1, 10.1, and 10. For December 16: 4, 5, 5, 6, 7, 7.5, 8, and 7.5. For December 17: 3, 2.8, 3.2, 4.5, 5, 5, 5, 6, and 5.5.
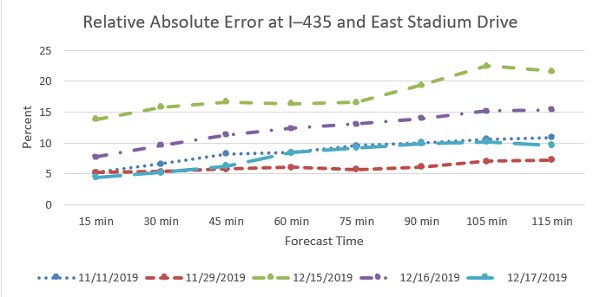
Figure 33 shows the relative absolute errors for MLP at I–435 and East Stadium Drive on November 11, 29, December 15, 16, and 17, 2019, for 15–115-min forecasts. The plots show:
- The relative absolute error for the MLP shorter-term forecasts tended to be smaller than the errors for longer-term forecasts. In other words, the error as a percentage of the speed was smaller for shorter-term forecasts.
- The relative absolute error shows the shorter-term forecasts tended to be more accurate.
- The average relative absolute error for the 15-min forecast was about 7 percent versus about 13 percent for the 115-min forecast.
I–435 = Interstate 435. min = minute.
Source: Federal Highway Administration
Figure 33. Graph. Machine learning-based prediction relative absolute error at Interstate 435 and East Stadium Drive.
This graph shows the Machine learning-based prediction relative absolute error at Interstate 435 and East Stadium Drive for five dates: November 11 and 29, and December 15, 16, and 17, 2019. The x axis is labeled forecast time and is in 15 minute increments from 15 to 115 minutes. The y axis ranges from 0 to 25 percent with tic marks every 5 percent. The plotted points for curves representing the five dates are as follows for the 15, 30, 45, 60, 75, 90, 105 and 115 minute times, respectively. For November 11: 5, 6, 8, 8, 9, 10, 10, and 11. For November 29: 5, 5, 6, 6, 5.5, 6, 7, and 7.5. For December 15: 14, 16, 17, 17, 17, 19, 22.5, and 22. For December 16: 8, 10, 12, 12.5, 13, 14, 15, and 15. For December 17: 5, 5, 6, 8, 9, 10, 10, and 9.
Figure 34 shows the root mean square errors for MLP at I–435 and East Stadium Drive on November 11, 29, December 15, 16, and 17, 2019, for 15–115-min forecasts. The plots show:
- The root mean square error showed that shorter-term forecasts errors tended to be smaller than longer-term forecasts.
- The root mean square error showed that the shorter-term forecasts tended to be more accurate.
- The average root mean square error for the 15-min forecast was about 3 mph versus about 5 mph for the 115-min forecast.
I–435 = Interstate 435. min = minute.
Source: Federal Highway Administration
Figure 34. Graph. Machine learning-based prediction root mean square error at Interstate 435 and East Stadium Drive.
This graph shows the Machine learning-based prediction root mean square error at Interstate 435 and East Stadium Drive for five dates: November 11 and 29, and December 15, 16, and 17, 2019. The x axis is labeled forecast time and is in 15 minute increments from 15 to 115 minutes. The y axis ranges from 0 to 10 miles per hour with tic marks every 2 miles per hour. The plotted points for curves representing the five dates are as follows for the 15, 30, 45, 60, 75, 90, 105 and 115 minute times, respectively. For November 11: 2.8, 3.2, 3.9, 4.1, 4.3, 4.2, 4.2, and 4.3. For November 29: 2.6, 3.7, 2.6, 2.6, 2.8, 3, 3.2, and 3.2. For December 15: 4.2, 5.5, 6, 6, 6.2, 6.5, 7.6, and 8.1. For December 16: 3.5, 3.8, 4.3, 4.4, 5, 5.3, 5.5, and 5.9. For December 17: 3, 3.5. 4, 4.2, 4.5, 5, 5.5, and 6.
Interstate 435 Eastbound at East Antioch Road
January 29, 2020, Weather and Road Conditions
On January 29, 2020, the weather temperature was in the upper 20s to low 30s with early morning snow. The road conditions had snow until about 9 a.m. and were dry afterwards. There were two incidents—both involving a stalled vehicle—between 5:42 and 6:07 p.m. and then again between 9:37 and 10:02 p.m.
January 29, 2020, Speed Predictions
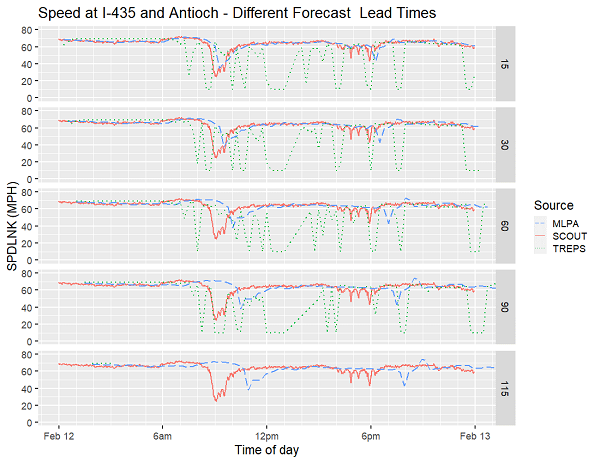
The plots in figure 35 display the historical data obtained for I–435 and East Antioch Road during January 29, 2020. The speed plot shows the reported speeds from KC Scout roadway detectors, TrEPS, and MLP, and shows the fluctuation and deviations during the day. The plots show:
- RAP and RTMA sources indicate that visibility was low in the morning and until slowly improving at about 8 a.m.
- MLP and detector speeds showed speeds decreasing until about 9 a.m., then increasing until about 11 a.m. and, with an exception at about 6:30 p.m., remained consistent thereafter.
- MLP speed predictions appeared to match the detector speeds well on this particular date, and appeared to show speeds decreasing at about the time of the stalled-vehicle incidents between 5:42 and 6:07 p.m. and 9:37 and 10:02 p.m.
- TrEPS speeds were consistently much lower than KC Scout and MLP for most of the day.
a.m. = ante meridiem. F = Fahrenheit. I–435 = Interstate 435. METRo = Model of the Environment and Temperature of Roads. mi = mile. MLPA = machine learning-based prediction model A. mph = mile per hour. p.m. = post meridiem. PCCAT = precipitation category. RAP = Rapid Refresh. RTMA = Real-Time Mesoscale Analysis. SCOUT = Kansas City Scout. SPDLNK = average speed of vehicles on each link. TPVT = temperature of pavement. VIS = visibility of surface. TREPS = Traffic Estimation and Prediction System.
Source: Federal Highway Administration
Figure 35. Plot. Interstate 435 and East Antioch Road historical speeds, January 29, 2020.
January 29, 2020, Speed Forecasts
The plots in figure 36 display the MLP and TrEPS forecast speeds obtained for I–435 and East Antioch Road during January 29, 2020. The plots show:
- Detector, MLP, and TrEPS speeds fluctuated throughout the day for all forecast times.
- TrEPS speeds were consistently lower than the detector speeds and do not reflect the decline in detected speeds from about 5 to 7 p.m.
- TrEPS and MLP speeds decreased similar to the the decline in detected speeds from about 8 to 10 a.m.
- MLP and TrEPS speed forecasts both showed periods where the forecasts appeared to have large deviations below the detector speeds. Both TrEPS and MLP speed deviations appeared to grow larger with longer forecasts.
a.m. = ante meridiem. I–435 = Interstate 435. MLPA = machine learning-based prediction model A. mph = mile per hour. p.m. = post meridiem. SCOUT = Kansas City Scout. SPDLNK = average speed of vehicles on each link. TREPS = Traffic Estimation and Prediction System.
Source: Federal Highway Administration
Figure 36. Plot. Interstate 435 and East Antioch Road forecast speeds, January 29, 2020.
February 12, 2020, Weather and Road Conditions
On February 12, 2020, the weather temperature was about 32 degrees throughout the day with periods of light snow, with snow from about 9 a.m. to midnight. The road conditions were dry until about 9 a.m., then became wet until and through midnight.
February 12, 2020, Speed Predictions
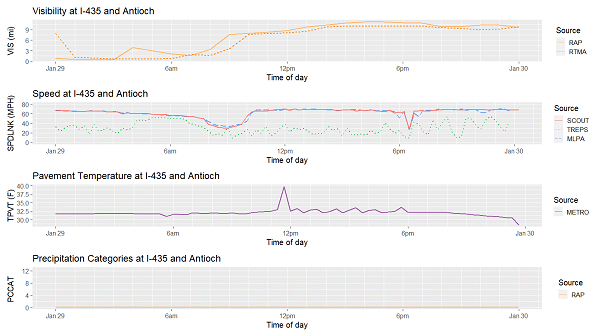
The plots in figure 37 display the historical data obtained for the first location, I–435 and East Antioch Road, during February 12, 2020. On this date, there were multiple incidents between 7:30 a.m. and 2 p.m. near to and downstream from this detector.
The plots show:
- RAP and RTMA sources indicate that visibility decreased at about 9 a.m. until slowly improving at about 7 p.m.
- MLP and detector speeds showed speeds decreased from about 9 to 10 a.m., then returned to normal until from about 3 to 6 p.m. when precipitation was indicated by PCCAT.
- MLP speed predictions appeared to pretty well match the detector speeds on this particular date, and appeared to show decreasing speeds between 9 and 10 a.m. and increasing variability from 3 to 6 p.m.
- TrEPS speeds deviated considerately and had frequent periods that were much lower than KC Scout.
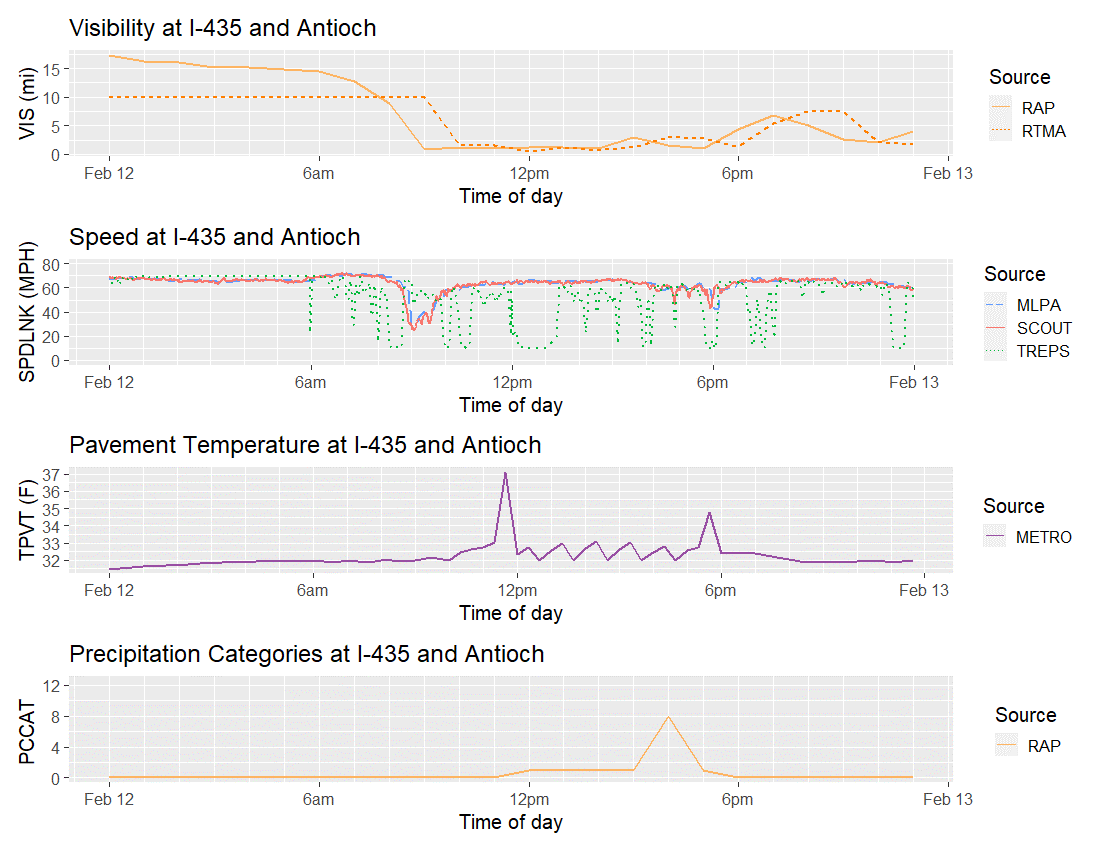
a.m. = ante meridiem. F = Fahrenheit. I–435 = Interstate 435. METRo = Model of the Environment and Temperature of Roads. mi = mile. MLPA = machine learning-based prediction model A. mph = mile per hour. p.m. = post meridiem. PCCAT = precipitation category. RAP = Rapid Refresh. RTMA = Real-Time Mesoscale Analysis. SCOUT = Kansas City Scout. SPDLNK = average speed of vehicles on each link. TPVT = temperature of pavement. VIS = visibility of surface. TREPS = Traffic Estimation and Prediction System.
Source: Federal Highway Administration
Figure 37. Plot. Interstate 435 and East Antioch Road historical speeds, February 12, 2020.
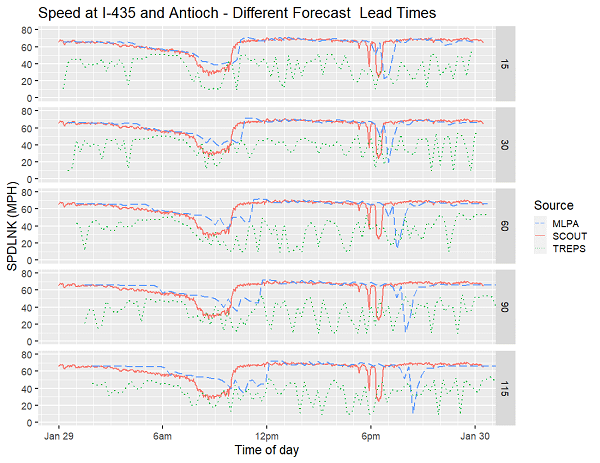
February 12, 2020, Speed Forecasts
The plots in figure 38 display the forecast speeds obtained for I–435 and East Antioch Road during February 12, 2020. The plots show:
- Detector, MLP, and TrEPS speeds fluctuated throughout the day for all forecast times.
- TrEPS speeds were consistent until about 7 a.m., then fluxuated lower than the detector speeds until about 8 p.m.
- MLP speeds for the 15-min forecast decreased similar to the the decline in detected speeds from about 9 to 10 a.m., then had deviations that grew larger with longer-term forecasts.
- MLP and TrEPS speed forecasts both showed periods where the forecasts appeared to have large deviations from the detector speeds. Both TrEPS and MLP speed deviatioans appeared to grow larger with longer forecasts.
a.m. = ante meridiem. I–435 = Interstate 435. MLPA = machine learning-based prediction model A. mph = mile per hour. p.m. = post meridiem. SCOUT = Kansas City Scout. SPDLNK = average speed of vehicles on each link. TREPS = Traffic Estimation and Prediction System.
Source: Federal Highway Administration
Figure 38. Plot. Interstate 435 and East Antioch Road forecast speeds, February 12, 2020.
Speed Forecast Error Analysis for Interstate 435 and East Antioch Road
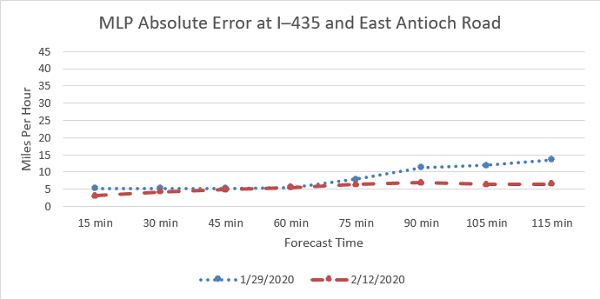
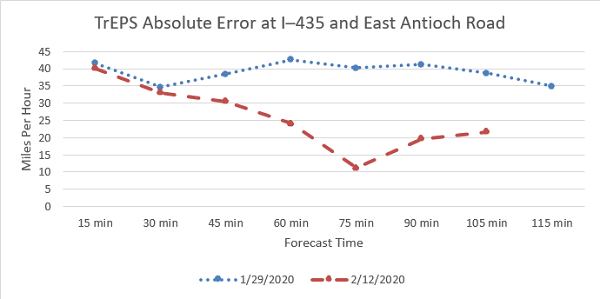
Figure 39 shows the MLP absolute error for the 15–115-min speed forecasts on November 11, 29, December 15, 16, and 17. Figure 40 shows the TrEPS absolute errors for the same forecast time periods. The plots show:
- For MLP, the absolute errors show that shorter-term forecasts tended to have smaller errors than longer-term forecasts. Consequently, the shorter-term forecasts tended to be more accurate. The average absolute error for the 15-min forecast was about 4 mph, whereas the 115-min forecast increased to about 10 mph.
- For TrEPS, the absolute errors were relatively mixed across all forecast times. On January 29, 2020, the absolute error was relatively consistent and ranged from about 35 to 42 mph. On February 12, 2020, the absolute error was about 40 mph for the 15-min forecast, steadily decreased to about 11 mph for the 75-min forecast, then increased to about 21 mph for the 105-min forecast.
- Comparing the MLP to TrEPS absolute errors, the TrEPS errors tended to be larger than the MLP absolute errors. The average TrEPS error across all forecast times was about 33 mph versus about 7 mph for MLP.
I–435 = Interstate 435. min = minute. MLP = machine learning-based prediction.
Source: Federal Highway Administration
Figure 39. Graph. Machine learning-based prediction absolute error at Interstate 435 and East Antioch Road.
This graph shows the Machine learning-based prediction absolute error at Interstate 435 and East Antioch Road for two dates: January 29 and February 12, 2020. The x axis is labeled forecast time and is in 15 minute increments from 15 to 115 minutes. The y axis ranges from 0 to 40 miles per hour with tic marks every 5 miles per hour. The plotted points for curves representing the two dates are as follows for the 15, 30, 45, 60, 75, 90, 105 and 115 minute times, respectively. For January 29: 5, 5, 5, 5, 8, 11, 12, and 14. For February 12: 3, 4, 5, 5, 6, 6, 5.5, and 6.
I–435 = Interstate 435. min = minute. TREPS = Traffic Estimation and Prediction System.
Source: Federal Highway Administration
Figure 40. Graph. Traffic Estimation and Prediction System absolute error at Interstate 435 and East Antioch Road.
This graph shows the Traffic Estimation and Prediction System absolute error at Interstate 435 and East Antioch Road for two dates: January 29 and February 12, 2020. The x axis is labeled forecast time and is in 15 minute increments from 15 to 115 minutes. The y axis ranges from 0 to 40 miles per hour with tic marks every 5 miles per hour. The plotted points for curves representing the two dates are as follows for the 15, 30, 45, 60, 75, 90, 105 and 115 minute times, respectively. For January 29: 42, 35, 38, 43, 40, 41, 39, and 35. For February 12: 40, 34, 30, 25, 11, 20, 22, and no point plotted.
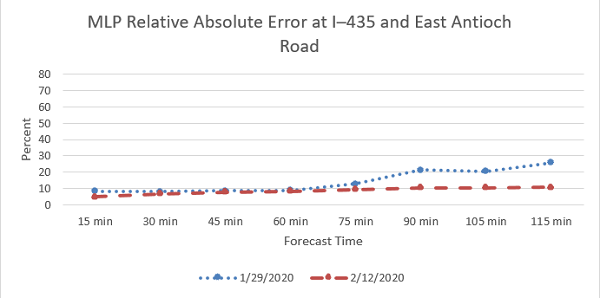
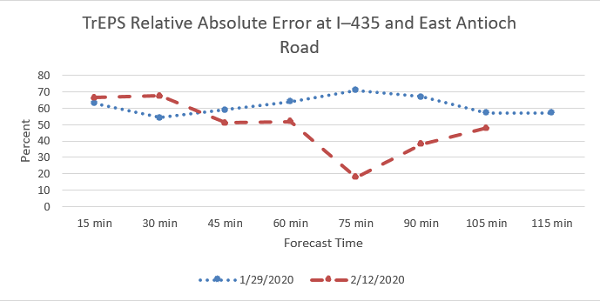
Figure 41 and figure 42 show the relative absolute errors for MLP and TrEPS at I–435 and East Antioch Road on November 11, 29, December 15, 16, and 17, 2019, for 15–115-min forecasts. The plots show:
- For MLP, the relative absolute error for shorter-term forecasts tended to be smaller than the errors for longer-term forecasts with the error as a percentage of the speed smaller for shorter-term forecasts. The average relative absolute error for the 15-min forecast was about 7 percent, whereas the 115-min forecast increased to about 18 percent.
- For TrEPS, the relative absolute errors were relatively mixed across all forecast times. On January 29, 2020, the absolute error was relatively consistent and ranged from about 54 to 71 percent. On February 12, 2020, the relative absolute error was about 66 percent for the 15-min forecast, steadily decreased to about 18 percent for the 75-min forecast, then increased to about 48 percent for the 105-min forecast.
- Comparing the MLP to TrEPS relative absolute errors, the TrEPS errors tended to be larger than the MLP errors. The average TrEPS error across all forecast times was about 56 percent versus about 12 percent for MLP.
I–435 = Interstate 435. min = minute. MLP = machine learning-based prediction.
Source: Federal Highway Administration
Figure 41. Graph. Machine learning-based prediction relative absolute error at Interstate 435 and East Antioch Road.
This graph shows the Machine learning-based prediction relative absolute error at Interstate 435 and East Antioch Road for two dates: January 29 and February 12, 2020. The x axis is labeled forecast time and is in 15 minute increments from 15 to 115 minutes. The y axis ranges from 0 to 40 miles per hour with tic marks every 5 miles per hour. The plotted points for curves representing the two dates are as follows for the 15, 30, 45, 60, 75, 90, 105 and 115 minute times, respectively. For January 29: 10, 10, 10, 10, 14, 21, 20, and 26. For February 12: 8, 9, 10, 10, 10, 10, 10, and 10.
I–435 = Interstate 435. min = minute. TREPS = Traffic Estimation and Prediction System.
Source: Federal Highway Administration
Figure 42. Graph. Traffic Estimation and Prediction System relative absolute error at Interstate 435 and East Antioch Road.
This graph shows the Traffic Estimation and Prediction System relative absolute error at Interstate 435 and East Antioch Road for two dates: January 29 and February 12, 2020. The x axis is labeled forecast time and is in 15 minute increments from 15 to 115 minutes. The y axis ranges from 0 to 40 miles per hour with tic marks every 5 miles per hour. The plotted points for curves representing the two dates are as follows for the 15, 30, 45, 60, 75, 90, 105 and 115 minute times, respectively. For January 29: 63, 54, 60, 64, 70, 68, 59, and 59. For February 12: 67, 68, 51, 51, 19, 39, 49, and no point plotted.
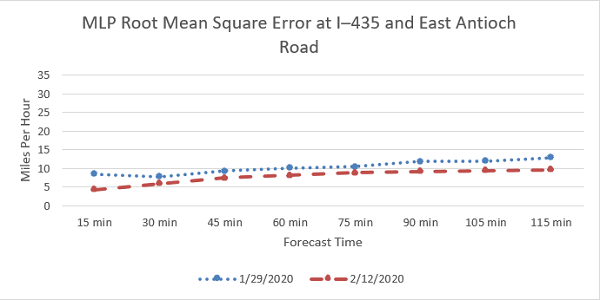
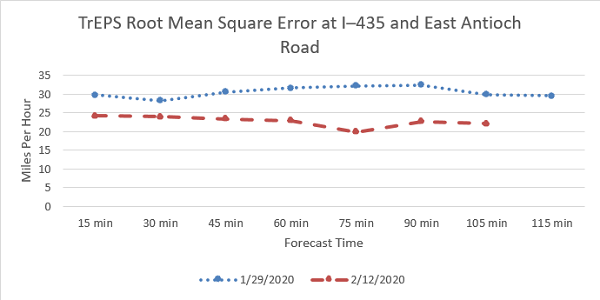
Figure 43 and figure 44 show the root mean square errors for MLP and TrEPS at I–435 and East Antioch Road on November 11, 29, December 15, 16, and 17, 2019, for 15–115-min forecasts. The root mean square errors which measure the deviation or spread of the forecast versus actual speeds. The plots show:
- For MLP, the root mean square error showed that the shorter-term forecasts errors tended to be smaller than longer-term forecasts. The average root mean square error for the 15-min forecast was about 6 mph versus about 11 mph for the 115-min forecast.
- For TrEPS, the root mean square errors were relatively consistent across all forecast times. The root mean square error ranged from 19 mph to 32 mph.
- Comparing the MLP to TrEPS root mean square errors, the TrEPS errors were about three times larger than MLP. The average TrEPS error across all forecast times was about 27 mph versus about 9 mph for MLP.
I–435 = Interstate 435. min = minute. MLP = machine learning-based prediction.
Source: Federal Highway Administration
Figure 43. Graph. Machine learning-based prediction root mean square error at Interstate 435 and East Antioch Road.
This graph shows the Machine learning-based prediction root mean square error at Interstate 435 and East Antioch Road for two dates: January 29 and February 12, 2020. The x axis is labeled forecast time and is in 15 minute increments from 15 to 115 minutes. The y axis ranges from 0 to 40 miles per hour with tic marks every 5 miles per hour. The plotted points for curves representing the two dates are as follows for the 15, 30, 45, 60, 75, 90, 105 and 115 minute times, respectively. For January 29: 9, 8, 10, 10, 10, 12, 12, and 13. For February 12: 5, 6, 8, 8, 9, 9, 10, and 10.
I–435 = Interstate 435. min = minute. TREPS = Traffic Estimation and Prediction System.
Source: Federal Highway Administration
Figure 44. Graph. Traffic Estimation and Prediction System root mean square error at Interstate 435 and East Antioch Road.
This graph shows the Traffic Estimation and Prediction System root mean square error at Interstate 435 and East Antioch Road for two dates: January 29 and February 12, 2020. The x axis is labeled forecast time and is in 15 minute increments from 15 to 115 minutes. The y axis ranges from 0 to 40 miles per hour with tic marks every 5 miles per hour. The plotted points for curves representing the two dates are as follows for the 15, 30, 45, 60, 75, 90, 105 and 115 minute times, respectively. For January 29: 30, 28, 31, 32, 33, 33, 30, and 29. For February 12: 24, 24, 23, 23, 20, 23, 23, and no point plotted.
Usefulness Study
The usefulness study investigated staff perceptions, attitudes, and behaviors. The goals of the interviews and discussions with KC Scout operators and supervisors were to learn about the users' experiences and perceptions relating to:
- Usage of IMRCP prior to, during, and/or after weather events.
- Accuracy of IMRCP information and forecasts.
- Integration of IMRCP into processes.
- Perspectives of IMRCP, overall (benefits, limitations, and lessons learned).
The operators reported primarily using IMRCP prior to a weather event. This included both rain and winter weather, but more often when winter weather was expected. The operators used it less during heavy rain or flooding events. In general, the operators did not use the traffic predictions capability. The operators said they liked the precipitation/weather predictions and the pavement status predictions because they can provide some insight into what locations to monitor more closely as the weather moves in. The operators used this feature to find areas with potential issues affected by the incoming weather. They reported it helped them prioritize and focus attention on particular roadway sections or areas, which in turn may improve their communication and decisions relating to motorist assist deployments. One user reported that IMRCP has been informally used to help inform transportation management center (TMC) staffing decisions during a weather event (e.g., should additional staff be called in, or can staff be sent home?).
The operators reported using IMRCP during the weather event in a more limited capacity. They are often busy during the weather events performing priority duties and responsibilities, such as entering, monitoring, and updating incidents into their system.
The operators typically do not use IMRCP to assess an event that has already passed; however, they acknowledge it may be helpful for data analysis and evaluation to determine lessons learned. One user believed there was a benefit to using IMRCP capabilities and its weather event data to look back and assess winter maintenance response efforts and emergency operation staffing decisions. Insight gained could potentially help save the agency staffing and monetary resources.
Overall, the users reported a fair confidence in the weather-related prediction components of IMRCP. As mentioned earlier, the operators did not use the traffic prediction components. The operators also indicated that periods of IMRCP downtime negatively affected the usage of IMRCP in their daily routines, especially in the 2019–2020 winter season. The operators' responses from the interviews seemed to indicate a more frequent use of IMRCP in the 2018–2019 winter season.
previous | next