A Methodology and Case Study: Evaluating the Benefits and Costs of Implementing Automated Traffic Signal Performance
Executive Summary
Automated traffic signal performance measures (ATSPM) are recent tools available to agencies that manage traffic signal systems. They have been shown to greatly enhance agencies' situational awareness regarding operation and maintenance of their signals that was previously only available through field operations or time-consuming analysis. ATSPMs have helped agencies quickly identify and proactively respond to operational and maintenance issues, improve traffic signal timing, and easily communicate outcomes internally and to decision makers and the public. ATSPMs can also improve the capabilities of agencies and help move away from reactive management that responds to problems as they are reported, and toward proactive management that takes action based on direct measurement of performance.
At present, ATSPMs have been embraced by many early adopters, but to expand implementation to the early majority market segment, more information is needed about implementation benefits and costs. A method for estimating benefits and costs would be useful to many agencies considering an implementation but unsure of potential return on investment. This report helps fill this gap by proposing a methodology for estimating benefits and costs. In addition, the report includes detailed information from six case studies of early adopters of ATSPMs, and summarizes key factors of successful implementations.
Cost-benefit Estimation Methodology
The methodology in this report for estimating benefits and costs is intended to be flexible, allowing analysts to include any factors relevant to their agency's situation, and to exclude irrelevant factors. The methodology is also intended to cover analysis of both short-term implementation benefits and long-term benefits sustained over the life cycle. The methodology includes 16 cost items and 12 benefit items, as summarized in figure 1, next page. For each cost item, a formula is provided using input data that should be obtainable by analysts in consideration of their current practices or by examining previous implementations. Benefit items are estimated based on anticipated improvements in agency practices and signal timing. A method is presented for estimating each benefit, including terms that can be estimated from reductions in time needed for tasks reduced through ATSPM, and potential benefits to the public from improved signal timing that result in increased safety or reduced delays.
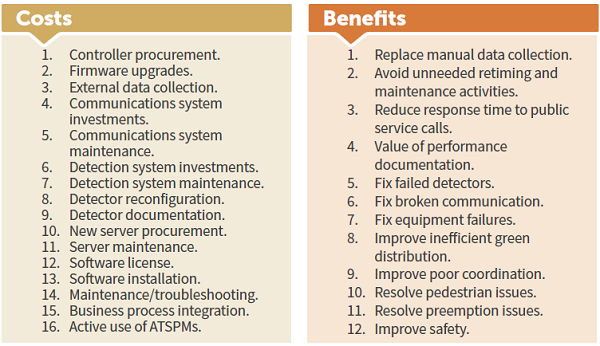
On the left, there is a list of sixteen costs as follows: 1, Controller procurement; 2, Firmware upgrades; 3, External data collection; 4, Communications system investments; 5, Communications system maintenance; 6, Detection system investments; 7, Detection system maintenance; 8, Detector reconfiguration; 9, Detector documentation; 10, New server procurement; 11, Server maintenance; 12, Software license; 13, Software installation; 14, Maintenance/troubleshooting; 15, Business process integration; 16, Active use of ATSPMs. On the right, there is a list of twelve benefits as follows: 1, Replace manual data collection; 2, Avoid unneeded retiming and maintenance activities; 3, Reduce response time to public service calls; 4, Value of performance documentation; 5, Fix failed detectors; 6, Fix broken communication; 7, Fix equipment failures; 8, Improve inefficient green distribution; 9, Improve poor coordination; 10, Resolve pedestrian issues; 11, Resolve preemption issues; 12, Improve safety.
Figure 1. Illustration. Primary items in the benefit-cost methodology.
Source: FHWA
Lessons Learned from Case Studies
As part of this research, six early adopter agencies were interviewed. This included three State agencies: Utah Department of Transportation (UDOT), Georgia Department of Transportation (GDOT), and Pennsylvania Department of Transportation (PennDOT); and three local agencies: Lake County Department of Transportation (LCDOT); Clark County (WA); and Maricopa County Department of Transportation (MCDOT). In addition, personnel from Cranberry Township, PA, were included to focus on a local Pennsylvania agency perspective, where the State directly manages few signals, but is working to provide ATSPM as part of a package of tools to local agencies.
Support of Leadership Yields Successful Implementations
A common thread among interviewed agencies was they all had strong executive support for making investments such as ATSPM implementation. This was particularly critical for UDOT—it took on considerable risk by investing thousands of in-house labor hours to develop an open-source software package that provides performance measures through a web-based front end, and automatically downloads and manages a database repository for the high-resolution from which the metrics are calculated. This yielded considerable benefits for UDOT, as well as several other agencies that would continue to use the software UDOT developed.
GDOT had similar executive support for its implementation. A few years after Utah's initial investments in open-source software, the implementation process was documented with assistance from GDOT, which has added its own contributions to the software. Through a combination of several parallel efforts, both agencies have made ATSPMs available to nearly all traffic signals in their respective States.
PennDOT is a larger agency, in terms of the total number of signals in the State. Nearly all of the signals in the State are managed by local agencies, but the State has undertaken several initiatives to help improve signal operations. Here again, there was strong support at the top level to improve the management of traffic signals in the State. ATSPMs are being integrated into an overall corridor modernization program as one tool among many to help streamline signal improvement, and help local agencies within the State improve their signal management practices. Cranberry Township, PA is one such agency and is among the first in the State to begin early implementation efforts.
The other local agencies included in the study are smaller and did not have the same scale of resources as the larger State DOTs. The three local agencies involved in this study had been undertaking programs to improve their operations and maintenance of traffic signals. ATSPMs were discovered by the agencies in the middle of carrying out these existing initiatives, and it was realized that an implementation could be integrated with those initiatives relatively easily. Clark County had been actively upgrading and adding capabilities to their traffic signal system for about a decade; they worked with their vendor to develop the capability to obtain ATSPMs within their system, and initiated research to identify ways to integrate the performance measures into their practices. LCDOT had a similar experience. ATSPMs are seen as an important component of their overall signal operations; their implementation has benefited from the agency having cultivated open communication with leadership and signal operators. Maricopa County has a history of investment in Intelligent Transportation Systems (ITS) infrastructure throughout the Phoenix metropolitan area through the AZTech regional traffic management partnership. The administrative infrastructure was therefore in place to support a technology initiative such as the ATSPM implementation.
Considerations for Implementation and Integration
Larger agencies with adequate information technology (IT) staff have successfully implemented ATSPM using the UDOT open-source code. However, this is not the only option for ATSPM and it may not be the best for smaller agencies that don't enjoy the same level of IT resources. Among the six agencies interviewed in this study, Clark County and LCDOT have used software from controller vendors to provide ATSPMs. This was likely a feasible option because both agencies had a working relationship with those vendors. However, several companies presently offer ATSPM software that would work with equipment from multiple vendors.
Communication to the intersection enables automatic downloading of high-resolution data to provide ATSPMs, while detection at the intersection reveals operational details of traffic performance. In addition, that information will be more valuable if the detectors are configured with separate lanes. Agencies across the United States (US) vary widely in regard to their existing infrastructure capabilities, with many signals not having communication to permit transfer of data. Some also lack detection, or would require changes to detector configurations to allow some performance measures to be collected. Perhaps unsurprisingly, agencies that successfully implemented ATSPMs had taken the initiative to develop this traffic signal infrastructure at a high level, even prior to beginning their ATSPM implementations.
One of the most important findings of the study is that agencies' operational practices are not always well integrated into their business models. Agencies that have a clear operational plan for operating their signals are more likely to be able to leverage ATSPMs to execute improvements and to document those successes. However, agencies that do not have such a plan will probably not be able to execute the same degree of benefit from ATSPMs. The wealth of data provided by ATSPM systems will probably not affect their day-to-day operations because they will not necessarily have clarity on what tasks the data should be employed for improving practice. For this reason, any discussion of ATSPM implementation should probably be predicated with development of a systematic approach to describing an agency's plans, goals, and objectives for managing and operating its traffic signal system. This would help provide clarity and identify which performance measures are applicable to specific tasks. From the case study interviews in this research, it is apparent that having clear operational objectives correlates with successful integration of performance measures into practice.
Another related issue is that the wealth of data that can be obtained by technologies like ATSPM poses a new problem; most agencies do not have the resources to scan these data sets to identify problems. ATSPMs, for example, are an excellent tool for checking the extent of known problems and verifying that a solution has a positive impact. Searching for unknown problems is more difficult. The development of methodologies to carry out this process would help improve the benefit gained from ATSPM implementations. Some recent software innovations, such as the Measurement, Accuracy, and Reliability Kit (MARK 1) tool developed by GDOT, are moving in this direction by providing a means of aggregating data from many locations into a succinct summary. Adding the mechanism to filter through volumes of data to spatially and temporally locate issues would be a next step for future research.
Estimating Benefits and Costs
At present, none of the agencies implementing ATSPMs have comprehensively tracked benefits and costs resulting from those activities. Some previous case studies (mostly by Indiana Department of Transportation [INDOT]) have documented estimated annualized public benefits resulting from before-and-after studies facilitated by ATSPM. While those results are summarized in this report, and they may provide a sense of the scale of benefits that could be realized, it is difficult to draw general conclusions from those studies, and the transferability of outcomes to other locations is unknown.
To try to broaden the overall picture of ATSPM impact, benefit and cost information was obtained in the six case study interviews carried out under this research. The results are summarized in figure 2, with details supplied with the case study information, including estimates of overall costs required for each implementation and preliminary estimates of benefits obtained from those implementations. The cost information obtained from these case studies is probably the most valuable piece of information for agencies considering implementations. With regard to benefit information, most agencies, at this point, had enough knowledge of the effort they had been spending on activities, such as responding to failed detection or public complaint calls, to estimate the reduced effort of such activities. Therefore, agency benefits were calculable for all case study agencies, and in most cases, benefits were greater than the cost of implementation. However, the amount of public benefit was not immediately estimable for most of the agencies, with the exception of UDOT. Although agencies are making use of ATSPMs to provide such benefits, extraction of the amount of benefit would require additional resources. In theory, the ATSPM systems themselves might be able to assist in estimation of those benefits, but this capability has not yet been introduced. Developing methods to do so would be a beneficial topic of future research.
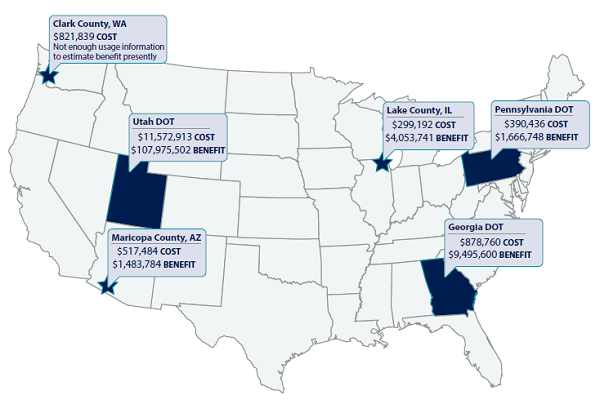 Superimposed on the map are the monetary benefits and costs for six sites. First, Clark County, WA with $821,839 cost and not enough usage information to estimate benefit presently. Second, Utah DOT with $11,572,913 cost and $107,975,502 benefit. Third, Maricopa County, AZ with $517,484 cost and $1,483,784 benefit. Fourth, Lake County, IL with $299,192 cost and $4,053,741 benefit. Fifth, Georgia DOT with $878,760 cost and $9,495,600 benefit. Sixth, Pennsylvania DOT with $390,436 cost and $1,666,748 benefit.
Figure 2. Illustration. Overview of case study benefits and costs.
Source: FHWA
Superimposed on the map are the monetary benefits and costs for six sites. First, Clark County, WA with $821,839 cost and not enough usage information to estimate benefit presently. Second, Utah DOT with $11,572,913 cost and $107,975,502 benefit. Third, Maricopa County, AZ with $517,484 cost and $1,483,784 benefit. Fourth, Lake County, IL with $299,192 cost and $4,053,741 benefit. Fifth, Georgia DOT with $878,760 cost and $9,495,600 benefit. Sixth, Pennsylvania DOT with $390,436 cost and $1,666,748 benefit.
Figure 2. Illustration. Overview of case study benefits and costs.
Source: FHWA