A Methodology and Case Study: Evaluating the Benefits and Costs of Implementing Automated Traffic Signal PerformanceChapter 1. Introduction and ConceptsMore than a decade of collaborative research and development within the academic, public and private sector transportation community has contributed to the development of automated traffic signal performance measures (ATSPM). The Federal Highway Administration's (FHWA) Every Day Counts 4 ATSPM technology initiative continues to actively promote implementation of the technology with the goal of transforming traditional reactive approaches to traffic signal timing to objectives- and performance-based management and operations that proactively support attaining transportation goals including safety, mobility, and efficiency. ATSPMs are a suite of visual aids and data analysis tools combined under a single platform to: 1) collect high-resolution traffic signal and detection data, 2) derive relevant performance measures, and 3) visualize those measures in a format that helps traffic signal staff to operate, maintain, and manage traffic signals to improve safety, mobility and efficiency of signalized intersections for all users. As the widespread implementation of ATSPM continues, it is timely to reflect on the progress in terms of diffusion of innovation theory (figure 3). Significant implementation has occurred in the categories of innovators and early adopters. To advance implementation among early and late majority adopters, sound evidence of benefits and costs of objectives- and performance-based management of signal systems is needed. 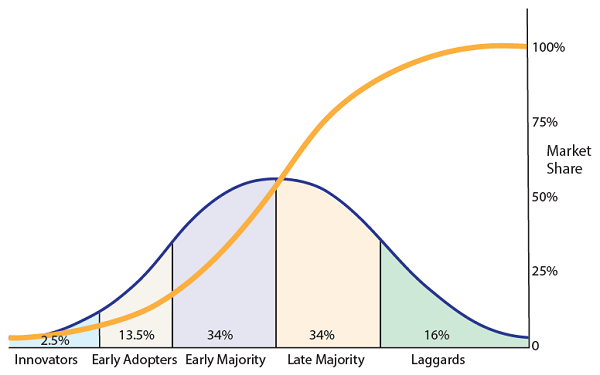
The percentage of adopting agencies is listed on the x-axis, and the percentage of ATSPM market share is shown on the y-axis. The graph is comprised of both a probability density function (PDF) and a cumulative density function (CDF). The PDF curve is shaped like a normal distribution. The PDF curve is further divided into the following five sections: Innovators (2.5%), Early Adopters (13.5%), Early Majority (34%), Late Majority (34%), and Laggards (16%). The CDF is shaped like an S-curve that reflects the cumulative normal distribution percentages. The midpoint of both the PDF and CDF thus falls at exactly 50%, between Early Majority and Late Majority.
Figure 3. Graph. Diffusion of innovations according to Rogers.Source: FHWA (adapted from Everett Rogers) The FHWA estimates that more than 300 downloads of the open-source software for ATSPM have occurred from the FHWA Open Source Application Development Portal (https://its.dot.gov/code/). Through collaborative efforts with Utah Department of Transportation (UDOT), the software was migrated to the GitHub platform (https://github.com/OSADP/ATSPM). At the time of this writing, the conversion rate from downloads to implementation was unknown. Interviews and ongoing discussion with organizations that have implemented the software indicates only a small subset of implementers possess the workforce capability and resources to incorporate use of ATSPMs into operations and maintenance business practices. The information available to support implementation of ATSPM continues to emerge and develop. National Cooperative Highway Research Program's (NCHRP) Project 03-122: Performance-Based Management of Traffic Signals (Tanaka et al., forthcoming) described helpful practices for collecting high-resolution data at the traffic signal controller level and converting that data into performance measures that indicate how well the system is operating. The outcome of pooled fund study TPF-5(258) Traffic Signal Systems Operations and Management (INDOT, forthcoming), includes two publications that discuss the use of high-resolution data to develop outcome-oriented performance measures and an approach for integrating measures in agency business practices. Figure 4 illustrates some agencies' adoption rates of high-resolution signal controllers. 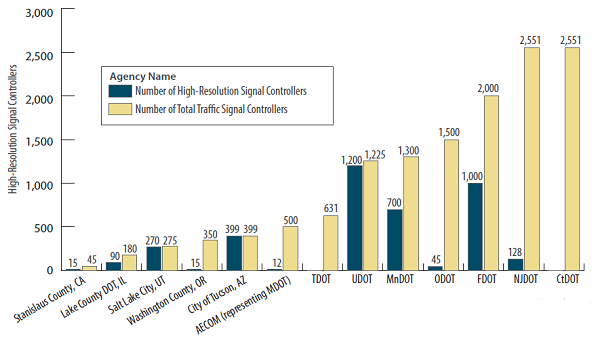
Agency names are listed on the x-axis. The number of high-resolution signal controllers is listed on the y-axis. Each agency is represented by two vertical bars. The first bar on the left represents the number of high-resolution signal controllers. The second bar on the right represents the total number of signal controllers. The results are as follows: Stanislaus County, CA: 15 out of 45 controllers have high-resolution. Lake County DOT, IL: 90 out of 180 controllers have high-resolution. Salt Lake City, UT: 270 out of 275 controllers have high-resolution. Washington County, OR: 15 out of 350 controllers have high-resolution. AECOM (representing MDOT): 12 out of 500 controllers have high-resolution. TDOT: 0 out of 631 controllers have high-resolution. UDOT: 1,200 out of 1,225 controllers have high-resolution. MnDOT: 700 out of 1,300 controllers have high-resolution. ODOT: 45 out of 1,500 controllers have high-resolution. FDOT: 1,000 out of 2,000 controllers have high-resolution. NJDOT: 128 out of 2,551 controllers have high-resolution. CtDOT: 0 out of 2,551 controllers have high-resolution.
Figure 4. Bar Chart. Select agency adoption of high-resolution controllers as of 2019.Source: FHWA Documentation of effective practices and quantitative benefits and cost information may help to continue the evolution of traffic signal management and operations business processes from reactive to proactive. This primer documents case studies and describes effective practices, benefits, and costs of objectives- and performance-based management of traffic signal programs. BackgroundTraditionally, the transportation community has taken a reactive approach to traffic signal operations. With the development of the ATSPM tool, the academic and public and private sector transportation communities are promoting proactive traffic signal operations by using an objectives- and performance-based management approach. These objectives support an agency's transportation goals, including safety, mobility, and efficiency, and these goals can be monitored using ATSPMs. Early adopters of ATSPM that possess the workforce and resources to effectively incorporate ATSPMs form a small subset of potential implementers. These early adopters have (anecdotal) knowledge of the benefits and costs of objectives- and performance-based management of signal systems—but quantitative information that can be widely shared will likely increase the number of agencies investing in training to integrate these practices into their workforce. In recent years, several innovations have emerged that have provided new resources and tools to agencies. This includes traffic signal controllers that collect high-resolution data (Smaglik 2007) and software that creates ATSPMs, which greatly enhances agency situational awareness. Additionally, the basic service model concept (Denney 2009) establishes a starting point for agencies to develop objectives for their traffic signal programs. Some agencies have made considerable progress integrating these tools. However, many agencies using the same resources have faced challenges implementing performance-based management. In such cases, awareness of lessons learned from agencies that overcame such challenges could be quite helpful. Support for implementation of ATSPM is increasing, but there is an opportunity to develop and document a comprehensive methodology for evaluating benefits and costs of objectives- and performance-based traffic signal operations and maintenance. This primer presents a methodology for estimating benefits and costs, and documents effective agency practices, through a series of case studies, that facilitate ATSPM implementation. Integration of ATSPMs into agency practice is a helpful activity for ensuring investments in ATSPMs and other performance-based management tools have a direct payoff in improved traffic signal operations and maintenance and agency organizational management. Motivation for Automated Traffic Signal Performance MeasuresIn the previous decade, awareness of the need for improved traffic signal management has grown, as highlighted by efforts such as the Traffic Signal Report Card (National Transportation Operations Coalition 2012). That report was widely cited as evidence that a critical need of improvement has been system monitoring and data collection. Current practices for many agencies rely on manual techniques and few agencies have practices to generate actionable operational information on a widespread basis. Most agencies' signal management activities focus on reacting to public complaint calls and preventative maintenance and retiming, as resources allowed. Performance-based management uses a proactive rather than reactive approach to the problem, necessitating a robust monitoring program. ATSPMs have emerged in the past decade, offering a potential means to this end. Research efforts in Indiana, including State-funded research projects NCHRP 3-79A (Day 2010b) and pooled fund study TPF-5(238) (Indiana Department of Transportation, forthcoming), led to the development of a portfolio of performance measures and extensive documentation of their use in field applications. UDOT's open-source ATSPM software was released several years ago, establishing a nominally free tool that several agencies have implemented, while stimulating development of new vendor products. The Every Day Counts program and NCHRP 03-122 (Tanaka et al.) have focused on implementation of ATSPMs. Use of performance measurement tools enabled by ATSPMs and similar technologies helps an agency to:
Today, ATSPMs are becoming a mainstream tool for signal operations. At present, ATSPM software has been provided by several vendors in addition to the open-source software, including:
With all tools, knowledge is helpful for applying them to the best advantage. As the technology moves from the realm of early adopters into the mainstream, it is beneficial for the accompanying knowledge to spread. At present, a significant knowledge gap is in the magnitude of benefit that can be attained from investment in performance-based management of signal systems. Integration into Business PracticesImplementation of new technology is sometimes thought of as procurement and installation. However, there is a human side to the problem often overlooked. A review of the history of the traffic industry reveals numerous occasions when new technology was regarded as the solution to a longstanding problem, yet the advantages did not fully materialize or were not sustained over the long run because the technology was not used to its full potential, or it could not be maintained. Tools that have endured are those that have been integrated into agencies' culture and business practices. More documentation of the benefits of changing practices and methodologies for quantifying those benefits is highly desirable. Integration of performance-based management into practice can be facilitated by connecting those performance measures to agency needs. Building the capability will not, alone, lead to improved performance. It is helpful to understand what the agency is trying to achieve—and, consequently, what it could attempt to measure. A framework of goals, context, objectives, strategies, and tactics (GcOST) has been encouraged by FHWA as a means of articulating key activities for agencies in operating and maintaining traffic signal systems and connecting those activities to specific performance measures (Fehon 2015).
The GcOST framework is a foundation for articulating benefits and costs because each activity generating benefit or cost will ideally be related to a particular objective, strategy, and tactic falling within a particular context. Figure 5 provides an example of an agency's goal of efficient operation—such a goal would be one among others, such as safe operation. Under the umbrella of efficient operation there are many possible objectives. In the context of uncongested traffic, an appropriate objective is to seek equitable distribution of green times. With further contextual knowledge of a traffic signal's environment—in this example, a signal in a coordinated network with moderate flow—a strategy of minimizing delay is identified, and possible tactics are suggested based on that strategy. In this example, based on agency preference, critical movement analysis is selected as a means of adjusting the signal timing to respond to demands. At this point, selection of performance measures can be carried out to evaluate whether these efforts have achieved the desired objective. Further context helps narrow the decision; in this example, detectors are available at the location and "mapped" into the ATSPM system (i.e., definitions allow the system to know which detectors belong to which movement/phase), allowing the selection of specific performance measures. ATSPM technology represents an opportunity for increased capability maturity. It is an initial step toward performance-based management of traffic signals, which is becoming readily accessible to agencies, even though information and training are often needed. At present, most of the performance measures are movement-based, but ongoing efforts seek to aggregate and synthesize these to yield intersection, corridor, and system level metrics. When combined with a solid benefit-cost methodology, as this research will provide, the resulting framework will enable an agency to monitor benefits and costs on a regular basis (e.g., daily, weekly, monthly). In addition, this will create opportunities for consulting companies to be strongly involved and help provide turnkey signal monitoring and retiming services. This is likely to improve signal operations and maintenance, if there is a comprehensive and clear methodology to evaluate the success of private signal operators. A further opportunity to improve agency outcomes, however, is when they are able to replace traditional methods (such as critical movement analysis), which largely depend on volume-based modeling ranging from very simple to highly complex, with actual observation of operation. Not only will this improve the attainment of the objectives, but will build in the ability to demonstrate that attainment for little additional cost. The process depicted in figure 5 will at that time change, become more direct, simple, and less costly. Based on the case studies, much remains to be accomplished, and thus the estimates of benefits and costs discussed in the next sections are still limited. 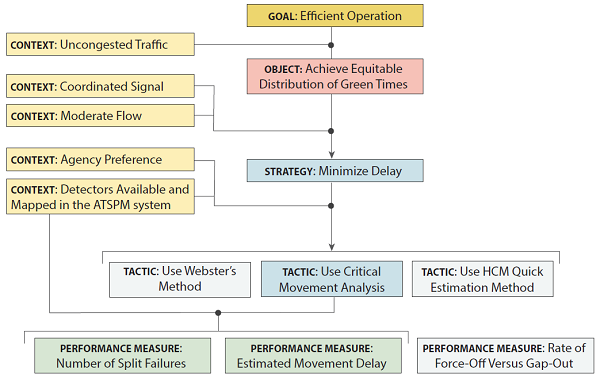
A second-level rectangle, located below the top rectangle, says "OBJECTIVE: Achieve Equitable Distribution of Green Times". Between the GOAL and the OBJECTIVE, an optional branch between these two rectangles leads to a third rectangle that says "CONTEXT: Uncongested Traffic". A third-level rectangle, located below the OBJECTIVE rectangle, says "STRATEGY: Minimize Delay". Between the OBJECTIVE and the STRATEGY, an optional branch between these two rectangles leads to two other rectangles that say "CONTEXT: Coordinated Signal" and "CONTEXT: Moderate Flow". Three fourth-level rectangles, located below the STRATEGY rectangle, say "TACTIC: Use Webster's Method", "TACTIC: Use Critical Movement Analysis", and "TACTIC: Use HCM Quick Estimation Method". Between the STRATEGY and the TACTICs, an optional branch between these two rectangles leads to two other rectangles that say "CONTEXT: Agency Preference" and "CONTEXT: Detectors Available and Mapped in the ATSPM System". Three fifth-level rectangles, located below the TACTIC rectangles, say "PERFORMANCE MEASURE: Number of Split Failures", "PERFORMANCE MEASURE: Estimated Movement Delay", and "PERFORMANCE MEASURE: Force-Off Versus Gap-Out".
Figure 5. Flowchart. Connections between context, objective, strategy, tactics, and performance measures.Source: FHWA Assessing Benefits and Costs of Performance-based ManagementPerformance-based management is a transformational concept that has the potential to improve traffic signal system operation and maintenance. ATSPMs require implementation of systems and technology to develop metrics and support data collection. Existing systems and technology may be leveraged but some costs are likely to be incurred, particularly when legacy infrastructure and systems are present. ATSPMs require a system to collect data and deliver metrics to the end user. To extract the most useful metrics from the system, adaptive traffic control (ATC) controllers, detection systems, and communications infrastructure may be used. Some of these costs may be conflated with ordinary expenses associated with operating a functional traffic signal system. For example, detection is necessary for basic traffic signal operations and can also be used by the ATSPM system. Adding detection or repairing broken detection will likely improve basic operation and allow proactive operations, deriving a benefit. This benefit will increase as the use of ATSPM's become part of the basic operation, not just a byproduct of the same infrastructure. Table 1 shows a summary of quantified user benefits from previous studies. These numbers were derived from estimates of vehicle travel time and travel time reliability from probe data. They may be considered a first-order approximation of benefits to the public; the benefit per signal (the total amount divided by the number of signals) is also shown here, which provides some insight into the scale of improvement that may be attainable across agency signal inventory. These costs are largely related to travel time savings; additional benefits not specifically explored in these previous analyses include:
Furthermore, there may be benefits to the agency from performance-based management that directly affect agency budgets. For example, in some cases, with improvements to signal timing, geometric improvements to intersections might be postponed for a number of years at a location, which can be monetized in terms of saved capital costs. Proactive management, enabled by improved system intelligence, allows unknown problems to be discovered and addressed, improves agencies' abilities to leverage personnel to prioritize tasks, and enables agencies to quantify their needs and make a better case to decision makers for resources. These benefits can partly be understood from case study results, but also in terms of the road not taken, i.e., the absence of such benefit had those agencies not implemented performance-based management—a potential opportunity cost for those agencies presently considering or unaware of performance-based management as an option. Table 2 provides a tentative picture of the fork in the road and how the outcomes are likely to affect agencies making such decisions. Approach to Benefit-cost Estimation MethologyIn developing an approach to benefit-cost estimation, the authors built from existing studies and past research on benefit-cost analysis (FHWA 2013), including previous estimations of user benefits outlined in table 1. The core of the methodology was the mathematical expressions that control the estimation outcomes. This analysis tool can be incorporated into a Microsoft® Excel spreadsheet, or a similar format, allowing the analyst to quickly adjust values and obtain the desired numbers. The authors had previously developed such tools for previous studies for internal use.
| ||||||||||||||||||||
|
United States Department of Transportation - Federal Highway Administration |
||