Behavioral/Agent-Based Supply Chain Modeling Research Synthesis and GuideCHAPTER 6. FREIGHT PERFORMANCE MEASURESFREIGHT MODEL STATISTICSFreight-related performance measures are often segmented by commodity group and mode. Commodity flows are typically summarized by weight (tonnage) and value (dollars) and most often reported annually. Shares by mode or market is another means to evaluate commodity flows across different scenarios or geographies using a normalized measure. The following performance measures are used to quantify commodity flows:
Travel time is an important attribute for any freight model; this attribute is also an important means of measuring the performance of the system. Since this is both an input to the system and a measure of performance, it is important to validate travel times against observed data before relying on the performance measures. Typically, these travel times represent an average daily travel time, but these may also be reported by time of day. Travel times for freight can be reported in several ways:
Advanced freight models that include behavioral or agent-based supply chain methods represent trips as segments of a long-distance supply chain. Such models may also represent the pick-up and delivery system to deliver goods for the last portion of the supply chain. Once the supply chain has been established, each segment is identified as a trip with a specific origin and destination. These trips can be reported by commodity group, mode, and aggregation of TAZs (i.e., districts or counties) and can be for annual or daily time periods. Truck trips are segmented further by truck type, time of day, and user class—typically for daily time periods. Pick-up and delivery systems for truck travel within a study area can also be reported as stops per tour, tour length, stop duration, and other tour statistics, also typically for daily time periods. Freight trips can be reported in several ways:
An important performance measure for transportation planners is average daily truck volumes, reported by road segment, screenline, or facility type. Truck volumes can also be summarized by geography (i.e., district or area type). Truck volumes are typically not segmented by commodity group, but if an agency was interested in this performance metric, then it could be developed by assigning truck trips for a single commodity group or by assigning several commodity groups using a multiclass assignment technique. The following represents several performance measures for truck volumes:
In addition to the performance measures considered in modeling, there are also performance measures related to operation of highways, including: travel time index, planning time index, buffer index, average hours of delay for freight vehicles, and safety measures. All of the agencies included in the synthesis (except WisDOT) employed assignment of rail, air, water, or pipeline flows. Since most commodities travel by truck, and since the operational models for rail, air, water, and pipeline are complex—and typically only developed for site-specific applications (rather than regional, megaregional, or statewide study areas)—many agencies do not assign rail, air, water, or pipeline flows. As a result, this report does not include performance measures associated with these modal volumes. Table 10 summarizes the performance measures sorted by type.
1. External refers to the segment of the freight movements that have some portion of the movement
outside the study area but travel through, into, or out of the study area. [Return to Table Note 1] PUBLIC SECTOR PERFORMANCE METRICSThe public sector primarily utilizes performance measures to quantitatively assess progress toward agency goals. Though there are several performance measures, most typically fall into the following categories:
Important components of performance management are longitudinal measurements and trends analysis. An agency may determine that additional investment or a policy change is required based on positive or negative changes in an individual PM over time. For example, an agency may decide to invest in highway improvements in situations where highway infrastructure is demonstrated by a PM to be either degraded or inefficient in terms of operations. Previously, PM data relied heavily on travel models and estimates. 2 However, there has recently been a shift toward empirical data measurements. 3,4 For instance, technological advances have produced additional travel data from roadside technologies (such as loop detectors) and onboard vehicle systems (such as GPS data). 5 These types of travel data are more accurate than modeled data, but empirical data are not always available for all measures. 6 Transportation System PerformanceGenerally, transportation system performance measurements focus on the time it takes vehicles to travel from one location to another, or what a vehicle’s speed is at a given location. Vehicle speed at a given time and location can be measured through calculations of spot speed averages that are captured from an onboard device or from a roadside device. Average speeds and travel times across a given distance are more complex and require at least two points of reference with time and location information. Measures of delay can be quantified using travel times; these measures can also indicate when, where, and for how long a location or system is performing below a target. 7 VMT information can also help determine the full effect that low-performing roads have on roadway users. Roadway deficiencies can be applied to the full population of system users using VMT, speed, and travel time, which helps calculate underperforming facilities’ costs. Disaggregation of efficiency measures by day of week, time of day, or other variables can also provide insight into the factors that influence efficiency on roadway segments. 8 An example of segmentation by time of day and the use of performance measures to evaluate efficiency is ATRI’s annual Top Truck Bottlenecks list. As shown in Figure 37 below, the worst truck bottleneck in 2017 was I-285 at I-85 north in Atlanta, Georgia; a roadway segment with an average speed of 38 miles per hour (mph), a peak average speed of 26 mph, and a nonpeak average speed of 44 mph. 9 Segmenting these data by time-of-day information can help identify optimal times to route freight through these bottlenecks (Figure 37). 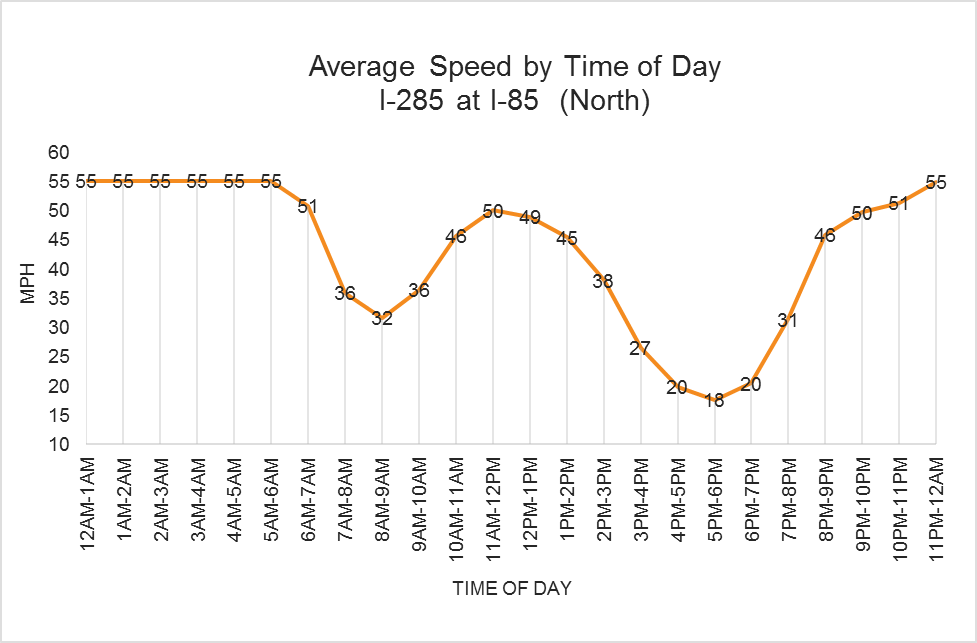
Figure 37. Example of Peak-Hour Congestion.
Reliability performance measures, which require average speed or travel time as an input, help quantify the variability and predictability of travel times. 10 Reliability performance measures include measures such as nonrecurring delay frequency, percentage of on-time arrivals, travel time indices, buffer indices, and planning time indices. 11,12 As an example, a buffer index is the additional time needed to ensure an individual arrives at his or her destination on time, 95% of the time. Planning time indices, on the other hand, estimate the total amount of time that must be set aside to arrive at a destination on time, 95% of the time. 13 The planning index differs from the buffer index by including unexpected delays and delays that are recurrent. SafetySafety-related measures focus on crash incidence or rates. The incidence or rate of fatalities, injuries, and property damage on roadways are common safety performance measures. 14 Segmentation of roadways to identify high-risk segments can guide where infrastructure investment will have the greatest effect. The use of roadway-specific data or information on crash causes can further inform what types of roadway improvements would have the greatest effect on safety outcomes. The relative effect of infrastructure investments can be measured through the percent change in fatality, injury, or property-damage-only crash rates. 15 Most data used for monitoring and analyzing data comes from U.S. DOT databases such as the Motor Carrier Management Information System (MCMIS), and sub-databases generated from MCMIS. MCMIS itself is populated by State crash and safety data submissions. It is well understood that the submissions are not always complete nor standardized, thus requiring researchers and planners to [attempt to] substantiate certain data without secondary sources. Ultimately, most government entities set truck safety objectives and measures based on guidance from the Federal Motor Carrier Safety Administration, and proposed through annual Motor Carrier Safety Assistance grant applications. Environmental SustainabilityEnvironmental sustainability performance measures relate to pollution levels, and the effects of pollution, from vehicle emissions. Performance measures include items such as per capita carbon dioxide emissions, fuel use, air quality, premature deaths caused by emission exposure, and greenhouse gas emissions. 16 Measures of environmental sustainability are generally quantified using the U.S. Environmental Protection Agency's Motor Vehicle Emission Simulator (MOVES) model. MOVES is used for inventory development in State Implementation Plans and for regional emissions analysis for transportation conformity determinations ("regional conformity analyses”) in States other than California. MOVES estimates emissions for both highway vehicles and nonroad equipment. MOVES contains a number of modeling parameters including vehicle types, time periods, geographical areas, pollutants, vehicle operating characteristics, and road types. The model performs a series of calculations, based on vehicle operating characteristics, to estimate total emissions or emission rates per vehicle or unit of activity. Changes to these modeling parameters ("user specified parameters”) can be used to evaluate the emissions impact of changes in freight performance. For example, changes in vehicle speeds ("speed distribution”), mileage ("vehicle miles traveled”) and extended idling ("hoteling”) are parameters than can be adjusted to account for changes in travel patterns or roadway characteristics. Economic IndicesPerformance measures related to economic conditions require a defensible method of demonstrating how transportation influences gross domestic product or gross regional product. 17 An example of an economic performance measure is new job growth resulting from infrastructure improvements. Other uses of economic indicators demonstrate the cost of efficiency losses. An example is the cost of congestion on the National Highway System (NHS) to the trucking industry—728 million hours of delays, or approximately $49.6 billion dollars in increased costs. 18 When econometric models are used, modelers build freight transportation models for tonnage or revenue, they calculate outputs by forecasting the freight, not the modes themselves. In other words, this top down "gravity" approach looks at the split of manufacturing activity by commodity for each mode. Then, the modelers forecast the growth in that commodity, and run those economic forecasts through a freight transportation model to yield the growth by mode. While there could be mode shifts, they are relatively small historically speaking. System PreservationSystem preservation goals primarily relate to the reduction of vehicle maintenance costs and are measured through pavement ride quality and bridge quality. In the United States, the Highway Performance Monitoring System collects these data. 19 An example of a system preservation measure is U.S. pavement ride quality, which has reduced significantly in recent years. From 2002 to 2012, national highway road mileage that was rated as acceptable decreased from 87.4% to 80.3% on NHS roadways. 20 System preservation is typically measured by the freight infrastructure condition and capacity. For example, the ratio of heavy or overweight trucks to total trucks is a measure that can be utilized by the models. Highway pavement and bridge conditions are other measures that are tied to freight system performance and can help with system preservation. Number of truck weigh stations on the network or percent of roadway miles with acceptable ride quality are measures that freight models utilize to inform on system preservation and performance. Total air tonnage at an airport is another system preservation performance measure that a freight model can be used for. PRIVATE SECTOR PERFORMANCE MEASURESThe trucking industry is competitive since the barriers to entry are low. Thus, profit margins are low when compared to other industries. As a result, trucking firms must scrutinize all cost centers to increase efficiency. To better understand private sector performance measures, the project team considered internal knowledge of the trucking industry, reviewed relevant articles and reports, interviewed a trucking operations executive, and surveyed carrier managers of operations. Private sector performance measures typically fell into one of the following categories: operations, financial, or safety. The tracking of performance measures is crucial to identifying areas of improvement and tracking progress in achieving organizational goals. An example of the importance of performance measures to carrier operations is demonstrated through the practices of USA Truck, a 2,000-power unit fleet that utilizes approximately 300 performance measures. 21,22 Some performance measures are common across the private sector, while others are unique to individual carriers. 23 Additional variation in private sector performance measures is introduced by different business models or financial practices, such as per-load or per-mile compensation metrics. A carrier may incorporate additional segmentation to account for differences in business divisions. OperationsOperations performance measures focus on managing costs and optimizing asset utilization. Cost management is critical due to the small profit margins characteristic of motor carriers. Optimizing asset utilization is equally important—carrier revenue is dependent on moving freight; therefore, stationary equipment or equipment operating unloaded are both large cost centers. Operations performance measures are sometimes best understood when considering the entire fleet, while at other times operations performance measures must be segmented to be meaningful. The following discussion highlights several examples of key trucking company performance measures:
Notably absent from operational performance measures are measures related to congestion and speed—the three large carrier PM areas reviewed in Performance Metrics Used by Freight Transport Providers did not have any performance measures for congestion or speed. 29 However, these might be performance measures of significant interest to carriers since avoiding congestion and maintaining off-peak speeds reduces costs. FinancialFinancial performance measures represent the greatest proportion of performance measures utilized by the private sector, a result of the relationship between carrier finances and economic viability. 30 Revenue-related-performance measures include revenue per loaded mile, revenue per mile, and revenue per shipment. Similarly, cost performance measures are also of significant importance to the private sector. Per-mile and per-load costs of operation are of interest to carriers. ATRI publishes an annual report documenting per-mile operating costs, which were $1.593 per mile in 2015. 31 The Operational Costs of Trucking report allows carriers to benchmark their relative performance in numerous cost centers, including, fuel costs, truck/trailer lease or purchase payments, repair and maintenance, insurance premiums, permits/licenses, tires, tolls, driver wages, and driver benefits. 32 Finally, attention to operating margins is a crucial measure in the private sector. 33 SafetySafety is of crucial importance and directly influences operational efficiency and financial measures. Government-monitored Compliance, Safety, Accountability (CSA) scores, which are used to assess carrier safety, affect carriers in numerous ways, including the following:
Safety performance measures track safety performance in a company, which helps identify and address risks. Safety performance measures typically fall into the following categories: crashes, driver injuries, and CSA impacts. Crash performance measures may be adjusted by time or by vehicle miles traveled (VMT) to account for exposure to risk. Crash performance measures may also be considered in terms of whether a crash is preventable or DOT reportable. Driver safety performance measures relate to driver injuries. Injury rates may be adjusted for exposure by considering injuries per employee or injuries per hours worked. The financial effect of driver injuries is also assessed in performance measures such as worker compensation costs as a percentage of revenue. Speeding events are also tracked.35 Most safety data are generated from State and federal databases which are almost exclusively predicated on historical data. It is also well known that the crash and violation data is often missing or poorly defined across the hundreds of reporting jurisdictions. While researchers have tried to correlate externalities ranging from traffic congestion, construction activities and work zones, GDP indices, and even FICO scores, the extreme complexity of transportation safety inputs makes it challenging at best. Simple correlations and trend analyses – based on historical data is commonplace. 2 Katherine F. Turnbull. "Adapting Freight Models and Traditional Freight Data Programs for Performance Measurement." Transportation Research Board, 2013. [Return to Note 2] 3 "Regional Indicators - CMAP." Accessed March 23, 2017. (enumerated web address: http://www.cmap.illinois.gov/data/regional-indicators) [Return to Note 3] 4 Ibid. [Return to Note 4] 5 Ibid. [Return to Note 5] 6 Ibid. [Return to Note 6] 7 Katherine Turnbull. "Performance Measurement of Transportation Systems: Summary of the Fourth International Conference," 2013. [Return to Note 7] 8 Katherine F. Turnbull. "Adapting Freight Models and Traditional Freight Data Programs for Performance Measurement." Transportation Research Board, 2013. [Return to Note 8] 9 "Atlanta, GA: I-285 at I-85 (North)." Accessed March 23, 2017. (enumerated web address: http://atri-online.org/research/results/congestion_mobility/2017bottleneck/001.pdf) [Return to Note 9] 10 "Travel Time Reliability: Making It There On Time, All The Time." Accessed March 23, 2017. (enumerated web address: https://ops.fhwa.dot.gov/publications/tt_reliability/TTR_Report.htm) [Return to Note 10] 11 Katherine Turnbull. "Performance Measurement of Transportation Systems: Summary of the Fourth International Conference," 2013. [Return to Note 11] 12 "Travel Time Reliability: Making It There On Time, All The Time - Brochure - FHWA Office of Operations," Accessed March 23, 2017. (enumerated web address: https://ops.fhwa.dot.gov/publications/tt_reliability/brochure/) [Return to Note 12] 13 Ibid. [Return to Note 13] 14 Katherine Turnbull. "Performance Measurement of Transportation Systems: Summary of the Fourth International Conference," 2013. [Return to Note 14] 15 Ibid. [Return to Note 15] 16 Katherine Turnbull. "Performance Measurement of Transportation Systems: Summary of the Fourth International Conference," 2013. [Return to Note 16] 17 Katherine Turnbull. "Performance Measurement of Transportation Systems: Summary of the Fourth International Conference," 2013. [Return to Note 17] 18 W. Ford Torrey. "Cost of Congestion to the Trucking Industry." American Transportation Research Institute, April 2016. [Return to Note 18] 19 "Executive Summary - 2015 Conditions and Performance - Policy | Federal Highway Administration." Accessed March 23, 2017. (enumerated web address: https://www.fhwa.dot.gov/policy/2015cpr/es.cfm#3h) [Return to Note 19] 20 Ibid. [Return to Note 20] 21 "Safety Measurement System - Overview (U.S. DOT# 213754)." Accessed March 24, 2017. (enumerated web address: https://ai.fmcsa.dot.gov/SMS/Carrier/213754/Overview.aspx) [Return to Note 21] 22 Wayne D. Cottrell. "Performance Metrics Used by Freight Transport Providers," September 30, 2008. [Return to Note 22] 23 Ibid. [Return to Note 23] 24 Wayne D. Cottrell. "Performance Metrics Used by Freight Transport Providers," September 30, 2008. [Return to Note 24] 25 W. Ford Torrey, IV, and Dan Murray. "Analysis of the Operational Costs of Trucking." American Transportation Research Institute, September 2016. [Return to Note 25] 26 "Measuring Carrier Performance - Inbound Logistics." Accessed March 24, 2017. (enumerated web address: http://www.inboundlogistics.com/cms/article/measuring-carrier-performance/) [Return to Note 26] 27 Wayne D. Cottrell. "Performance Metrics Used by Freight Transport Providers" September 30, 2008. [Return to Note 27] 28 Katherine Turnbull. "Performance Measurement of Transportation Systems: Summary of the Fourth International Conference," 2013. [Return to Note 28] 29 Wayne D. Cottrell. "Performance Metrics Used by Freight Transport Providers" September 30, 2008. [Return to Note 29] 30 Ibid. [Return to Note 30] 31 W. Ford Torrey, IV, and Dan Murray. "Analysis of the Operational Costs of Trucking." American Transportation Research Institute, September 2016. [Return to Note 31] 32 Ibid. [Return to Note 32] 33 Wayne D. Cottrell. "Performance Metrics Used by Freight Transport Providers," September 30, 2008. [Return to Note 33] 34 Caroline Boris, and Dan Murray. "Assessing the Impact of Non-Preventable Crashes on CSA Scores." American Transportation Research Institute, November 2015. [Return to Note 34] 35 DOT-reportable crashes involve at least one fatality, injury where an individual is taken to a medical facility, or a vehicle being towed because of property damage incurred in the crash. A preventable crash is defined as a crash "that could have been averted but for an act, or failure to act, by the motor carrier or the driver." (49 CFR 385.3) [Return to Note 35] | |||||||||||||||||||||||||||||||||||||||||||||||||||
|
United States Department of Transportation - Federal Highway Administration |
||