Behavioral/Agent-Based Supply Chain Modeling Research Synthesis and Guide
CHAPTER 5. BEHAVIORAL/SUPPLY CHAIN FREIGHT MODEL ASSESSMENT
This chapter details the findings of the state-of-the-practice model review, which aims to help agencies assess the
feasibility of a behavioral/agent-based supply chain modeling approach. The review includes a list of considerations
for planning the model development. For the purposes of this discussion, a study area could encompass a region,
megaregion, or an entire State.
FREIGHT MODEL DESIGN
The following sections summarize the experience of the agencies interviewed for this synthesis. These sections
discuss commonalities that led the agencies toward behavioral/agent-based supply chain models as the preferred solution
to support their freight modeling and freight planning needs.
Current Freight Model Structures
An agency's decision to transition to a more advanced freight model structure must weigh the investment cost of
transitioning against the importance of answering detailed policy and planning questions. The previous models of the
agencies examined as part of this synthesis were relatively limited trip-based models that analyzed—at most—grouped
commodities and often represented only trucks. In these cases, the models provided little of the market coverage and
policy sensitivity required to answer complex policy questions.
Most supply chain model components reviewed as part of this synthesis were based on multinomial or nested logit
choice model formulations. The first step of these supply chain models is an enumeration of establishments, typically
called firm synthesis, based on iterative proportional fitting methods. The buyer-supplier matching model component is
based on different methods, with the most advanced being a game theory application. Buyers consider several
transportation, logistics, risk, capacity, and productivity factors for sellers when selecting a seller. Some
buyer-supplier matching models use fuzzy logic or agent-based computational economics (ACE). In the MAG model, the
supply chain allocation model used the ACE method. Tour-based truck models primarily use the multinomial logit choice
approach, except in the Wisconsin and Oregon models where TSP algorithm and gravity models were used. In several cases,
the stop-sequencing element of the truck-touring models used a different approach, such as the greedy algorithm and the
hurdle/count model.
More advanced passenger models are following similar development paths, where the more complex policy analyses being
undertaken now have led to the transition to activity-based (AB) models. One factor in deciding to transition to a more
advanced freight model is the benefit of adding commensurate detail to the modeling of freight vehicle movements once
passenger vehicles are represented in a more detailed way. An issue that is more closely related to the truck-touring
models than to supply chain models is the ability to integrate the outputs directly with dynamic assignment models.
Desired Geographic and Temporal Coverage
Outside of non-attainment and maintenance areas, air quality analyses may be conducted as part of a NEPA analysis.
Agencies may consider the following questions when deciding whether or not to conduct air quality analysis in these
areas:
The most expansive supply chain freight models include a large geographic and temporal scale. This expansive design
is meant to accurately capture freight movement, which is part of a global system that operates continuously. For
example, the Chicago Metropolitan Agency for Planning (CMAP) model examined as part of this synthesis simulates the
entire U.S. economy and imports and exports, which is appropriate given Chicago's importance to the nation's
freight movement system. Many of the supply chain models aim to track the shipment supply chains that affect freight
movements in their study area to international origins and destinations for imports and exports, and their domestic
origins and destinations for domestic shipments. The extent to which through-freight movements are considered is also
important for study areas that contain water ports, as this can broaden the model's geographical detail. For example,
the FreightSIM model of Florida also includes significant detail in the adjoining States of Georgia and Alabama.
Decisions on temporal coverage are driven somewhat by the datasets used to forecast freight movements, many of which
operate on an annual timeframe. The transition to daily traffic for assignment purposes, and more detailed
time-period-specific traffic volumes, is often made later in the model systems (e.g., in a connected truck-touring
model).
Although none of the models described in this synthesis had implemented seasonal variation in commodity flows yet,
this is a promising and ongoing area of research for academics working on the development of freight model techniques.
The disaggregate nature of supply chain models facilitates simulating seasonal variation in the production and
consumption of commodities. Unlike passenger travel that has more predictable activity patterns by time of day, freight
movements are more heavily influenced by seasonal variations that vary by commodity.
Desired Market Coverage
Market coverage requirements are an important consideration when identifying a need for a supply chain model. The
models reviewed as part of this synthesis generally support extensive segmentation and the ability to track segments
through the model system. The disaggregate nature of the models supports this with characteristics of individual
businesses and shipments that support the high number of combinations of industrial classifications and commodities.
The issues for different typical model steps included in the supply chain models and connected truck models are
described in the following subsections.
Firm Synthesis
- Characterizes business establishments by location (e.g., traffic analysis zone [TAZ], county, State),
establishment size (e.g., employment categories), industry (e.g., six-digit Census Bureau NAICS categories).
- Addresses market coverage issues inherent in some of the typical business establishment data, particularly
relating to agricultural businesses (i.e., farms) and home-based businesses.
- Scales the number and size of establishments in a firm synthesis model at the TAZ level. These often use regional
employment forecast data, since future business establishment data are typically not developed by transportation
planning agencies.
- Bases commodity production and consumption by business establishment on the U.S. Bureau of Economic Analysis's
(BEA's) Input-Output (IO) data. These data use the BEA's six-digit NAICS categories and provide coverage across
the whole economy.
Supply Chains
- Develops the shipment movements between pairs of firms. The disaggregate nature of the production and consumption
outputs from the firm synthesis models supports detailed buyer and supplier matching and allocation of commodity
flows. Many of the models use the full range of 43 SCTG categories for shipment commodities.
- Supports the representation of the complete distribution of shipment sizes (e.g., using the nine shipment-size
categories from the Commodity Flow Survey (CFS), ranging from less than 50 pounds to more than 100,000 pounds), via
the conversion from annual commodity flows to individual shipments.
- Supports analysis of the freight mode choice by being fully multimodal. Many of the models use four main modes
(truck, rail, water, or air), with the intermodal paths being represented as some combination of those modes (e.g.,
truck-rail-truck). Some of the models also include movements, by pipeline.
Truck Types and Truck Activities
- Integrates (to some extent) with regional truck models. Two major market segments are typically used in terms of
demand for truck travel: freight movement and nonfreight commercial vehicle movement to provide services. Usually,
only the freight truck models are connected to the supply chain model.
- Predicts truck movements for different truck types, such as light, medium, and heavy trucks (Federal Highway
Administration [FHWA] class 3-5, 6–7, and 8–13, respectively) for vehicle-type categories. The output trip
rosters from truck-touring models usually have detailed trip start and end times (e.g., defined by minute of the day)
that can be aggregated into time period trip tables for static assignment.
- Accounts for different activity types via the stops that trucks make across freight and commercial vehicle
segments. Scheduled stop activities (i.e., those where the truck is conducting its primary business) include delivery
of a shipment, pick-up of a shipment, and service activities. The models often also add intermediate stops for
meals/breaks, vehicle service/refueling, and other purposes. This range of activities provides responsiveness to
land-use changes and can support policy tests such as delivery windows and other policies that relate to the truck
activity occurring at a stop.
The specific coverage and segmentation available to a model step is related to the unit of analysis of the model and
the range of characteristics that can be used to describe the decision-makers represented in the model step.
Forecasting Methods
The available case studies approach to forecasting integrates truck trips with passenger car trips to conduct
highway assignments in the base and future-year scenarios. This allows congestion to influence cars and trucks
equitably and for planners to evaluate the benefits of future strategies to alleviating congestion for both cars and
trucks. Truck trip tables by type and time period are included in a multiclass assignment.
None of the available case studies includes the assignment of rail, water, air, or pipeline freight trip tables.
These are long-distance modes and would require operational models to evaluate capacity constraints, which are quite
time consuming and data intensive to develop. Since the supply constraints are not as significant for non-highway
modes, these operational models are often not warranted at a regional or statewide scale.
Future-year scenarios require travel times and costs by mode, future-year employment data, and future-year
facilities' data (e.g., distribution centers, intermodal terminals, ports). All of the models forecast specific
future years for planning purposes, but the Oregon model steps through time in one-year intervals up to the desired
forecast year. Most agencies rely on future-year commodity flow data as an input, but the Chicago and Oregon freight
models have the capability to generate future-year commodity flows.
Staff Resources for Data Processing and Model Maintenance
Transportation agencies will derive the greatest benefit from their behavioral supply chain freight models by
allocating sufficient staff for operations and maintenance of various input, estimation, calibration, and validation
datasets required to apply the modeling system. Dedicated staff resources provide an opportunity for staff to become
familiar with the data processing required for updating input data sources and interpreting the results of the freight
modeling system. Ideally, this would be one or two full-time staff, but many transportation agencies will begin with
0.5 full-time equivalent staff resources. Many transportation agencies have transportation planners who focus on
freight planning and become familiar with freight datasets, while travel forecasting staff study and understand the
supply chain modeling components. Working together, the planners and modelers bring different expertise to the larger
question of understanding freight movements. Behavioral supply chain freight models are complex and require training
and experience to maintain and apply. Given the relative newness of these models, training should be obtained from
model developers since there are no standardized courses available in these methods.
Consideration of Phased Approaches to Development
Phasing the freight model development process permits funding the work across fiscal years. Figure 35 illustrates
two different approaches to phasing the freight model (if a commercial vehicle survey of establishments is conducted).
In the second example, model implementation is accomplished by transferring a model during model implementation and
then revising parameters based on the model estimation. In both examples, the commercial vehicle surveys and model
estimation can be dropped entirely using the transferred model approach.
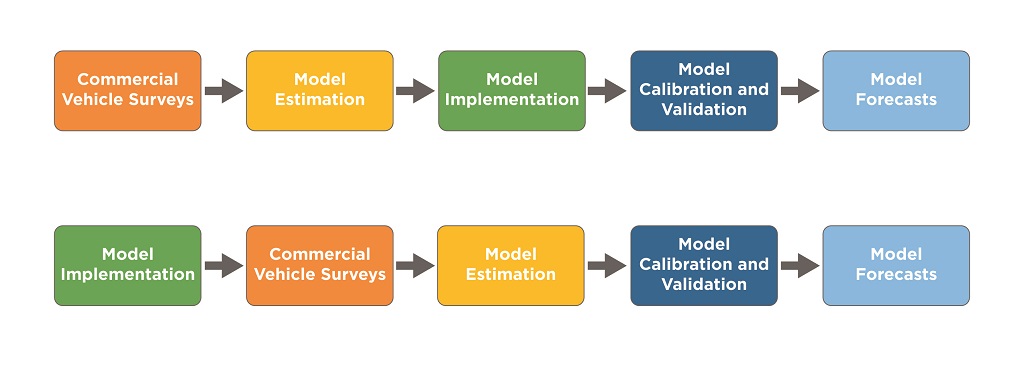
Figure 35. Two Examples of Phasing with a Commercial Vehicle Survey.
Source: (RSG, 2017)
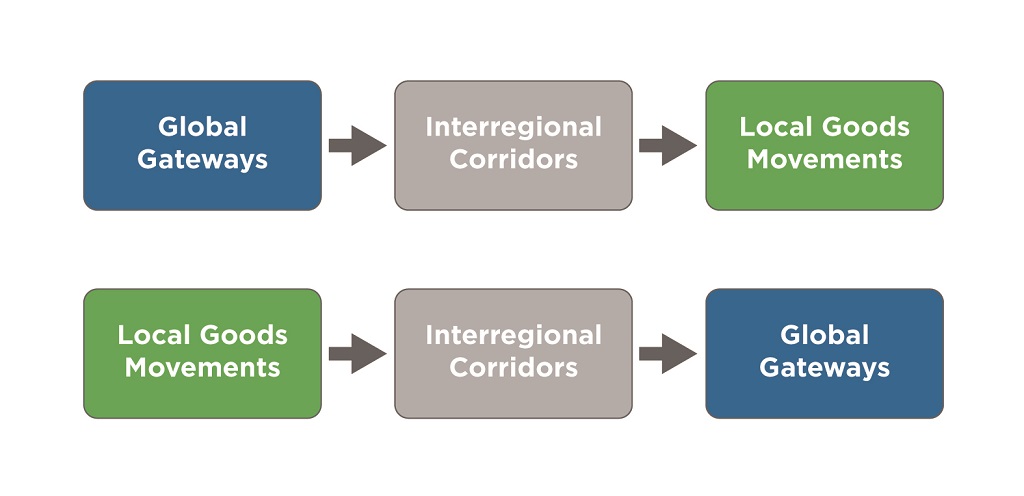
Figure 36. Two Examples of Phasing, by Model System Component.
Source: (RSG, 2017)
COLLABORATION OPPORTUNITIES (PUBLIC SECTOR PARTNERSHIPS)
The ability to unite the resources sufficient for a successful freight modeling program can be greatly aided through
cooperative partnerships between an agency and other organizations with shared interests. These resources may include
sharing data, software, and computing resources, as well as joint funding of model development or maintenance
activities. An obvious place to start would be regional stakeholders, who might benefit directly from the freight
modeling program. Less obvious—but nonetheless valuable—partnerships might be with agencies outside of the
agency's region, which also develop and maintain freight modeling programs.
Development of advanced freight demand models is increasingly executed in phases, which often begin with the
transfer of a model structure and parameters from another region. This is one feasible path to take in developing a new
freight modeling system. In addition, it is also increasingly common for metropolitan planning organizations (MPOs) to
co-fund large data collection efforts. Establishment surveys that collect either origin-destination data or full driver
diary data can be resource-intensive and partnerships with adjacent MPOs within the region could provide an excellent
opportunity for shared data collection for freight. An example of an active megaregional modeling region is in Arizona
where Maricopa Association of Governments (MAG) (Phoenix) and the Pima Association of Governments (PAG) (Tucson) have
shared data and modeling resources for passenger, freight, and land-use modeling systems.
Cost for the development of application software for a freight modeling system can be minimized by borrowing
open-source application programs that have been developed for other regions and customizing it only as needed to suit
the specifications of the region. For example, the rFreight package developed by RSG in the open-source language R, has
been implemented to suit the needs of five different agencies, with the main modifications being data inputs and
parameter estimates. This also provides a user community and the opportunity to contribute and receive updates as
rFreight is refined and enhanced.