Road Weather Management Benefit Cost Analysis CompendiumCHAPTER 7. CASE STUDIES FOR WEATHER RESPONSE OR TREATMENT
Note: Use the hyperlinks in this table to jump directly to the case study.
CASE STUDY 7.1 — MAINTENANCE DECISION SUPPORT SYSTEM IMPLEMENTATION: THE CITY AND COUNTY OF DENVER63
Project Technology or StrategyMDSS usage has begun to extend beyond State departments of transportation (DOT) to include local agencies. This is appropriate, considering that there is an increasing trend in local expenditures and all local agencies combined spend more than all State DOTs on snow and ice removal activities. C/C Denver faces many of the same challenges as other local agencies around the country, including budgetary and technological constraints. Nevertheless, their street maintenance division was eager to participate in an evaluation of their use of an MDSS and learn ways to enhance their winter operations and make better use of the MDSS tool throughout their jurisdiction. A Federal prototype MDSS is being used by C/C Denver as a tool to assist their maintenance operations in forecasting road-weather conditions in their area and providing treatment recommendations. Project Goals and ObjectivesThis example presents the actual results of a BCA for the use of MDSS by the City and County of Denver, Colorado over two winter periods: 2007-2008 and 2008-2009. In order to provide comparable benefits and costs within the analysis, C/C Denver carefully selected key MOEs to primarily focus on benefits to the implementing agency, including labor, equipment, and material savings. In this case we demonstrate how the agency used the available information and created a simple spreadsheet model the conduct the BCA. FHWA has developed a similar system, TOPS-BC, which provides a wealth of cost and benefit information along with the computations needed to estimate net present values and benefit cost ratios (BCR). Figure 49 shows a benefit cost framework for focusing the evaluation of the BCA in terms of the primary pathways by which benefits and costs are expected to be experienced by C/C Denver. The area inside the red dotted box represents the costs and benefits evaluated by the agency in the BCA. 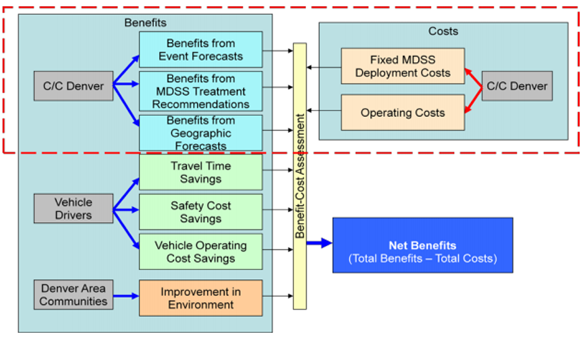 Figure 49. Diagram. The benefit-cost analysis pathways framework. MethodologyThe evaluation was designed to be a "with-without MDSS" analysis intending to quantify the two benefit areas: (1) those resulting from atmospheric and pavement forecasts, and (2) those resulting from treatment recommendations. The first benefit area examined tactical forecasts that are made prior to a storm event to indicate the expected start time of the storm and other attributes. Tactical decisions are initially made 24 to 48 hours before the event (at the snow meeting with the management staff) and during each shift. Evaluation Hypothesis #1 - By using the MDSS forecasts as a tactical decision support tool, C/C Denver will achieve reductions in shift hours or eliminate shift call-ins, thereby reducing labor hours and associated costs for winter maintenance. Over the past two winters combined, 69 snow events were tracked and reported by C/C Denver. MDSS forecasts were used for 56 of those events. For 13 events in the past two winters, MDSS was not used either because computer server problems prevented access to MDSS information, or C/C Denver supervisors were not able to compile the information. In the previous winter, MDSS was used for all but three events. The evaluation design for assessing the second benefit area of the MDSS in offering treatment recommendations was a "with-without" design based on identified experimental plow routes on which crews used the MDSS forecasts and treatment recommendations and a matched set of control routes on which C/C Denver conducted operations without the use of the MDSS. Several major routes were selected where C/C Denver would follow the MDSS treatment recommendations to the best extent possible without jeopardizing public safety. The condition of selected experimental route segments where the MDSS would be used to guide treatments would then be compared with control route segments where treatments were determined using the existing procedures based on driver and supervisor decisions. Evaluation Hypothesis #2 - By using the MDSS updates and treatment recommendations, C/C Denver will experience a reduction in the amount and cost of material used and a decrease in the number of truck miles, and hence cost of fuel and maintenance, over the course of an entire winter. The treatment assessment test was conducted three times during the winter of 2008-2009. While ideally an entire winter of testing was desired, C/C Denver was able to complete the standard operating procedures for the evaluation design by January 20, 2009. Subsequent to that date, only seven events occurred, and most of them required primarily spot treatments rather than extended material use. The BCA model runs found that the treatment recommendations had minimal and inconclusive effects on C/C Denver's treatment strategies. Model Run ResultsThe study team reviewed data from previous winter events, some when MDSS was fully operational and others when it was not. By studying the crash and travel outcomes as well agency operation costs, researchers assigned costs and benefits to individual events with and without MDSS. Benefits were realized primarily by reductions in labor hours due to the tactical decision support offered by the MDSS, including the deployment of road crews, equipment, and materials. No benefits were realized by the MDSS in the treatment aspect. Overall, the treatment recommendations had minimal and inconclusive effects on C/C Denver's treatment strategies. Three tests revealed three different results across the control and experimental districts. The results from these three tests were not published. Costs include one-time set-up costs and annual contract costs for the MDSS. Benefits and costs were adjusted to constant 2009 dollars using inflation rates from the Bureau of Labor Statistics. The budget cycle for the C/C Denver is based on the calendar year, so benefits and costs reported are for events in specified calendar years. Overall, the MDSS provided a net positive benefit cost trade-off, with the average annual benefits exceeding the costs. For every $1.00 that the C/C Denver spent on the MDSS, it achieved $1.34 in return. The C/C Denver gained a net benefit (Net Benefit = Total Benefit - Total Costs) of $24,304 per year from the use of the MDSS. Table 29 shows the overall net benefits of using the MDSS for C/C Denver. The costs and the benefits are in 2009 dollars and are based on the calendar year in which they were incurred. Costs incurred in 2006 include one-time system setup, calibration, and hardware costs. This savings is equivalent to about 10 percent of C/C Denver's discretionary overtime budget for the year, and management believes this more than justifies the investment in the MDSS.
n/a = not applicable.
Overall, C/C Denver found the MDSS to offer them valuable guidance in their efforts to fine tune their maintenance decisions before and during storms, and they fully intend to continue their investment in the MDSS into the future. Key ObservationsC/C Denver worked closely with the evaluation team and with the developer of the prototype MDSS, in their use of the MDSS over the past two winter periods to inform C/C Denver's winter road maintenance decisions and actions. The findings of this BCA pointed to a clear set of benefits, along with real cost savings, that strongly justify the value not only to State DOTs but also local DOTs of having an MDSS among the suite of tools and services they rely upon to support their road maintenance decisions. Although not directly assessed in this BCA, the benefits at the agency level that have been identified flow down to the traveling public in terms of the agency's ability to maintain the level of service on the roadways and thereby make them safer for travelers. Finally, this BCA provides an evaluation structure and insight into the effective uses of an MDSS in an urban setting that may be of value to other local agencies similar to C/C Denver. ReferenceResearch and Innovative Technology Administration, Benefit—Cost Assessment of a Maintenance Decision Support System (MDSS) Implementation: The City and County of Denver, FHWA-JPO-10-018 (Washington, DC: 2009). Available at: https://ntl.bts.gov/lib/33000/33100/33156/denver_mdss_bca_report_final.pdf CASE STUDY 7.2 — POOLED FUND MAINTENANCE DECISION SUPPORT SYSTEM IMPLEMENTATION64
Project Technology or StrategySixteen States have joined the MDSS Pooled Fund Study led by the South Dakota DOT to develop an enhanced maintenance decision-support system (MDSS) based on the Federal MDSS prototype. The MDSS integrates relevant road weather forecasts, coded maintenance rules of practice, and maintenance resource data to provide winter maintenance managers with recommended road treatment strategies. Coupled with other advanced technologies, MDSS has revolutionized winter operations at transportation agencies. MDSS is an integrated software application that provides users with real-time road treatment guidance for each maintenance route (e.g., treatment locations, types, times, and rates) to address the fundamental questions of what, how much, and when according to forecast road weather conditions, available resources, and local rules of practice. In addition, MDSS can be used as a training tool, as it features a "what if" scenario treatment selector that can be used to examine how the road condition might change over a 48-hour period with the user-defined treatment times, chemical types, or application rates. The essential functions of an MDSS may be visualized in three tiers: global, primary, and secondary. The global essential function of the MDSS is fulfilled as two interrelated applications: a "real-time assessment of current and future conditions" and "real-time maintenance recommendations." Primary functions are those that have been created as part of the MDSS development process such as the road treatment module. A secondary function is one that is or can be accomplished by existing systems such as road weather management information systems (RWMIS) or road weather forecasts. Project Goals and ObjectivesThe purpose of this research project was to assess the benefits and costs associated with implementation of MDSS by State transportation agencies. In order to provide comparable benefits and costs within the analysis, South Dakota DOT carefully selected key MOEs to focus primarily on benefits to the implementing agency and ultimate users, including:
Detailed descriptions of the data collection and evaluation process are available in the full report referenced at the conclusion of this case. The costs and benefits associated with this technology are included in Table 30.
Note: Bold indicates factors included in methodology. LOS = level of service.
MethodologyA methodology consisting of a baseline data module and a simulation module was developed to analyze tangible benefits, which include the three selected benefits listed above. The methodology was applied to three Pooled Fund States: New Hampshire, Minnesota, and Colorado. The three States were chosen to provide case studies on the benefit cost ratio of using MDSS. They were selected because they:
These criteria were selected so the results would be transferable to other Pooled Fund States. To evaluate the three cases, several years of historical weather, maintenance, and traffic use data were incorporated to establish baseline information for each route segment. Then, a simulation generated output from the MDSS for each of three scenarios: base case (point 1); same resources (point 2), which means better level of service; and same conditions (point 3), fewer resources, as shown in Figure 50. The simulation outputs from selected route segments were extrapolated to other route segments in each State to achieve a statewide BCA. 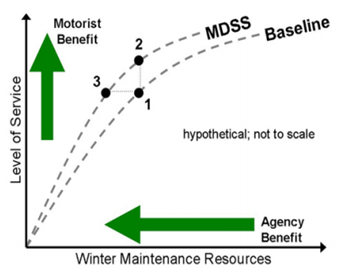 Figure 50. Graph. Benefit cost methodology and relationship between level of service and costs. The data from the three case studies was utilized to estimate a range of benefit and cost results for various conditions and situations. Compendium users can conduct similar analyses for their regions by using the process followed in this study and using their own State data. A complete citation for the study is available at the end of this case study. Model Run ResultsBCA results indicated that the use of MDSS could bring more benefits than costs. The case studies showed that the annual net benefit of using MDSS outweighed the cost to a significant degree, ranging from $488,000 to $2.68 million. The benefit cost findings are shown in Table 31. The benefit cost ratios do not indicate conclusively which scenario produces better results. The case studies showed that there is a trade-off between agency benefits and user benefits. Increased use of material will achieve greater motorist benefits while increasing agency costs, and vice versa.
For the Same Condition scenario, the report notes that the contributions of user benefits to total benefits are almost the same as agency benefits for all cases. The split of benefits for the Same Resources scenario, however, have large variations. In the Minnesota case, the Same Resources scenario used much more salt (12.7 percent of total use) than the Base Case for winter maintenance and seemed to deviate more from the assumed "Same Resources" point 2 (in Figure 50) than the other two cases. Thus, Table 31. Benefit Cost Summary shows the negative impact on Agency Savings. The additional use of salt did improve motorist safety and mobility, but the total benefits were reduced. By comparing benefit cost ratios, the Same Condition scenario tends to produce similar or better results than the Same Resources scenario. Overall, the study found MDSS offers State DOTs valuable guidance in their efforts to fine tune their maintenance decisions on winter operations, justifying their intent to continue future investments in MDSS. Key ObservationsThis case study presented a BCA of deploying MDSS for winter maintenance. A methodology that consisted of a baseline data module and a simulation module was developed and applied to three pooled fund States to analyze tangible benefits. Tangible costs were calculated based on winter maintenance information requested from the case study States. The three case studies collectively showed that the benefits of using MDSS outweighed associated costs. The benefit cost ratios did not indicate which MDSS scenario was (always) better. However, it is most likely that an agency implementing MDSS would fall somewhere between the Same Resources scenario and the Same Condition scenario, seeking to achieve both a level of service improvement and a reduction in winter maintenance costs. The case studies also showed that there is a trade-off between agency benefits and user benefits. Increased use of material will achieve more motorist benefits while increasing agency costs, and vice versa. ReferenceSouth Dakota DOT, Analysis of Maintenance Decision Support System (MDSS) Benefits & Costs, SD2006-10-F (SDDOT: May 12, 2009). Available at: https://trid.trb.org/view.aspx?id=915012 CASE STUDY 7.3 — HYPOTHETICAL MAINTENANCE DECISION SUPPORT SYSTEM IMPLEMENTATION65
Project Technology or StrategySeveral State departments of transportation (DOT) and municipal public works departments have deployed MDSS in urban settings. MDSS offers road maintenance managers guidance on efficient tactical deployment of road crews, equipment, and materials with the expectation that the MDSS can save State and local transportation agencies money and time while also enhancing the safety and mobility of the traveling public. Project Goals and ObjectivesThe purpose of this hypothetical benefit cost analysis (BCA) is to demonstrate how the TOPS-BC tool could support a road weather management (RWM) BCA evaluation where the user is supplying the required cost and benefit inputs. The example suggests that the user had estimated a clear set of benefits, along with real cost savings, that strongly justify the value—not only to State DOTs but also to local DOTs—of having an MDSS among the suite of tools and services they rely upon to support their road maintenance decisions. DATA This hypothetical evaluation was designed to be a "with-without MDSS" analysis intending to quantify the two benefit areas: those due to atmospheric and pavement forecasts and those resulting from treatment recommendations. Evaluation Hypothesis #1 — By using the MDSS forecasts as a tactical decision support tool, the State DOT will achieve reductions in shift hours or eliminate shift call-ins, thereby reducing labor hours and associated costs for winter maintenance. Over two winters combined, MDSS forecasts are assumed to be used for 56 events. Evaluation Hypothesis #2 — By using the MDSS updates and treatment recommendations, State DOTs will experience a reduction in the amount and cost of material used and a decrease in the number of truck miles, and hence cost of fuel and maintenance, over the course of an entire winter. The treatment assessment test was assumed to be conducted three times during one winter. It is assumed that only seven events occurred and most of them required primarily spot treatments and not extended material use. Benefits are realized primarily by reductions in labor hours due to the tactical decision support for deployment of road crews, equipment and materials offered by the MDSS. Costs will include one-time set-up costs and annual contract costs for the MDSS. Benefits and costs in this hypothetical scenario will be adjusted to constant 2009 dollars using inflation rates from the Bureau of Labor Statistics. BENEFIT COST ANALYSIS A BCA to determine whether to implement the MDSS for weather forecasting can be conducted using TOPS-BC. In this case, the user can utilize the TOPS-BC architecture to set up the BCA, to estimate annualized cost and benefits, to apply alternate discount rates, to estimate some benefits, and to display the results. Since TOPS-BC does not now provide cost and benefit data unique to a RWM MDSS application, the user must supply much of this data. The information can be collected from other DOTs that have implemented MDSS programs for weather forecasting, or the data can be produced from vendor estimates. A search of the FHWA ITS database may provide much of this information. 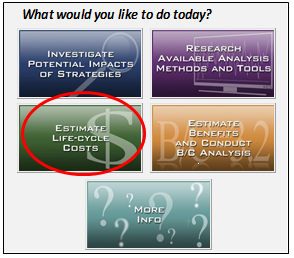 Figure 51. Screenshot. Tool for Operations Benefit/Cost start page – estimate life-cycle costs function. To set up TOPS-BC to conduct this analysis, the user will open the spreadsheet modeling tool to the start page (Figure 51) and click on "Estimate Life-Cycle Costs." In the left-hand column of the Cost Page (Figure 52), click on "Road Weather Management." Depending on the current version of TOPS-BC, you may or may not see any information on the costs of MDSS systems. If no MDSS costs are displayed, the user can input cost data from available information on the specific project or locate cost information on the FHWA ITS Cost database. (http://www.itscosts.its.dot.gov/its/benecost.nsf/ByLink/CostDocs). 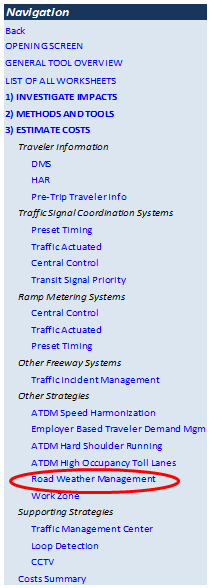 Figure 52. Screenshot. Tool for Operations Benefit/Cost navigation column for estimating costs — road weather management strategies. If the user needs to input new cost information, TOPS-BC maintains a blank cost estimation worksheet that can be used to create cost estimation capabilities for new strategies that may not currently be included. A blank cost estimation worksheet is provided as a hidden sheet titled "Cost Template," or the user can edit the cost line items on the Road Weather Cost sheet. In this case, we have edited the existing RWM cost sheet to reflect the cost assumptions. These are hypothetical costs only to demonstrate how TOPS-BC works. It is suggested that you download the latest version of the TOPS-BC model and follow along with this discussion. These procedures are explained in the TOPS-BC User's Manual, which is available at: https://ops.fhwa.dot.gov/publications/fhwahop13041/fhwahop13041.pdf. If we take the cost estimates for a statewide deployment of AVL to support the maintenance vehicle fleet as shown in Figure 53, the user can create a cost sheet in TOPS-BC. TOPS-BC will take the basic cost information provided and generate the annual costs as well as the net present value of cost for use in a BCA. The user also provides a start date, an analysis period, and a discount rate. In this example, we are running TOPS-BC and we would like to modify the inputs to reflect new data. We might do this because of the similarity of this particular deployment to another deployment where data has been collected on the actual costs or benefits experienced. 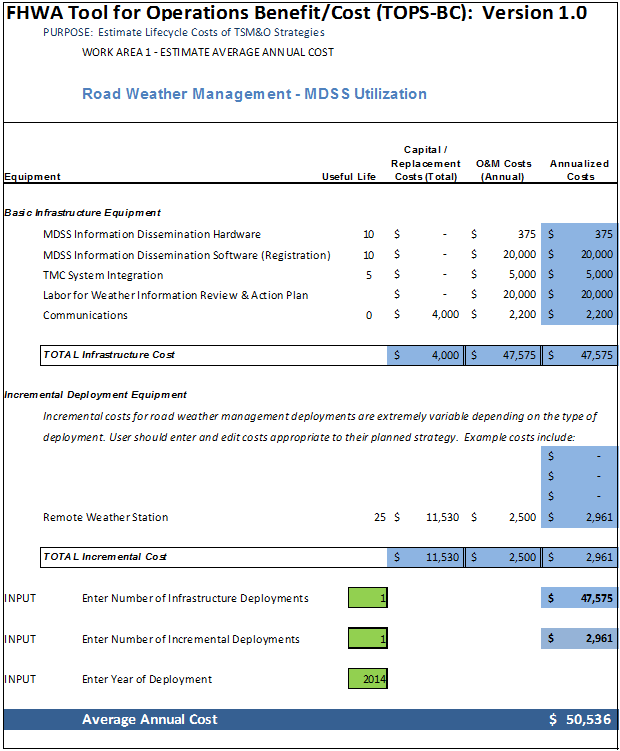 Figure 53. Screenshot. Tool for Operations Benefit/Cost cost table edited for maintenance decision support system cost inputs. With the MDSS option, we know that certain benefits will be realized as we tested (assumed) the historic application in our community and measured the changes in agency staff costs for overtime. We also investigated the change in materials application, but at this time we could not definitively identify materials savings. By using the navigation column on the far left, (Figure 54) we can go to the Road Weather Management benefit inputs page and input new information specific to MDSS. These values will be used in all calculations calling for these values in TOPS-BC. 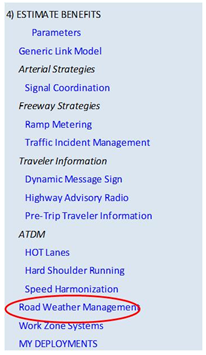 Figure 54. Screenshot. Tool for Operations Benefit/Cost navigation column for estimating benefits — road weather management strategies. The user can also test the inputs to see where additional benefits may be realized. This can be accomplished by modifying assumptions about the project costs, size or other dimension. The user can get a range of estimated benefits and costs. One can also test the value assumptions. For example, an alternative set of data on materials savings from application of MDSS forecasts could reflect a cost savings that would improve the applicability of this tool for any project. Go to the "Benefits" section of Road Weather Management spreadsheet and move to the very bottom of the page to the cell labeled "User Entered Benefit (Annual $s)" and enter the calculated benefit amount, in this case, $100,000. (Remember that FHWA is always adding material to TOPS-BC, so check to see if the model contains benefit data assumptions that might be helpful.) TOPS-BC will now use the $100,000 entry in all of its BCA calculations. 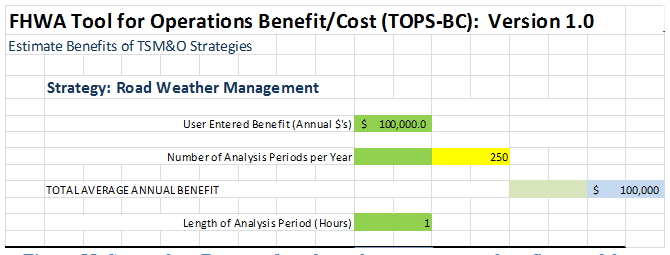 Figure 55. Screenshot. Bottom of road weather management benefit spreadsheet. Model Run ResultsNow go back to the far left Navigation Column (Figure 56) and select, "My Deployments." In the middle of the sheet you will see the results as shown in Table 32. 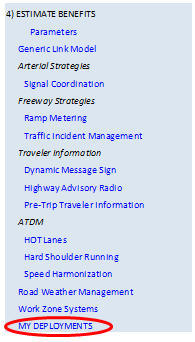 Figure 56. Screenshot. Tool for Operations Benefit/Cost navigation column for estimating benefits — my deployments. In this case, TOPS-BC estimates that the project benefits exceed the costs. This results from the gain in operating efficiency (labor savings) for the system under study. This is a hypothetical case, but it is loosely based on an actual MDSS deployment and evaluation so that we could provide a demonstration of how TOPS-BC can be used as the BCA tool to support RWM decisions.
Key ObservationsAlthough not directly assessed in this BCA, the benefits at the agency level that have been observed in this hypothetical example flow down to the traveling public in terms of the agency's ability to maintain the level of service on the roadways and thereby make them safer for travelers. Finally, although this model is just a prototype, it provides a framework for the development of a model which could be used to measure the effectiveness in costs savings and expected safety (as measured by crash reductions) of a roadway, thereby providing an agency with objective and predictable measures for determining whether an MDSS deployment is necessary. Prior to and after the deployment, the State DOT should collect data on system performance to be able to compare the changes brought about by the deployment. Those performance changes reveal impacts on both freeway and MDSS performance. These realized changes are what a pre-project deployment analysis needs in order to estimate the expected project benefits and costs. Once the project is deployed, performance indicators and their changes are known and can be used as an estimate of what might be expected if a similar project is deployments. ReferenceResearch and Innovative Technology Administration, Benefit—Cost Assessment of a Maintenance Decision Support System (MDSS) Implementation: The City and County of Denver, FHWA-JPO-10-018 (Washington, DC: 2009). Available at: https://ntl.bts.gov/lib/33000/33100/33156/denver_mdss_bca_report_final.pdf CASE STUDY 7.4 — WASHINGTON'S AUTOMATED ANTI-ICING SYSTEM STUDY66
Project Technology or StrategyTo address weather-related crashes on a section of Interstate 90 near Vantage, Washington, WSDOT assessed the benefits and costs of deploying an automated anti-icing system to prevent the formation of pavement frost and black ice and to reduce the impact of freezing rain. The system design included the following transportation system management and operations (TSMO) strategies:
Project Goals and ObjectivesThe primary purpose of winter highway maintenance is to provide vehicular traffic with a roadway surface that can be safely traveled. Roadway geometrics and an icy surface may create specific locations that are particularly susceptible to snow- and ice-related accidents. WSDOT developed a benefit cost analysis (BCA) to explore the feasibility of incorporating an intelligent transportation system (ITS) method to assist maintenance operations at a high accident location on Interstate 90 in Washington State. It is proposed to address ice- and snow-related accidents by preventing the formation of ice on the roadway surface. The process explored by this case is with anti-icing chemicals applied to the roadway surface by an automatic anti-icing system. This BCA identifies the system costs and cost savings due to accident prevention and calculates a benefit cost ratio. WSDOT selected the key measures of effectiveness in the BCA to be Safety. MethodologyThe value of the anti-icing system approach to reducing snow- and ice-related accidents is assessed using a benefit cost ratio, where the present worth of benefits (PWOB) divided by the present worth of costs (PWOC) equals the benefit cost ratio. The PWOB, PWOC, and benefit cost ratio are calculated using the WSDOT Benefit/Cost Worksheet for Collision Reduction. Cost elements include design, construction, power and communication, operations and maintenance costs. Benefits are the estimated reduction in snow, ice, and wet pavement crashes. Using historical crash data, the annual rate of collisions over a 3-year period was determined and compared to the expected rate of collisions after system implementation. It was estimated that 80 percent of the snow, ice, and wet pavement crashes would be eliminated.67 The cost per collision was used to determine the annual safety benefit. BENEFIT COST ANALYSIS Project Cost. Project cost is the estimated total cost to develop and construct the system. It includes the anti-icing system (control system, chemical storage tank, distribution lines, pump, and nozzles), RWMIS, camera, connection to power and communications, and design and construction engineering. Operations and Maintenance Costs. Annual Operations and Maintenance Costs are the sum of materials, power, communications, weather forecasting, training, and system maintenance. The material is the liquid chemical. The amount needed per year was estimated by calculating the amount of chemical required to melt the expected freezing precipitation. The expected freezing precipitation was estimated to be half the weekly average winter precipitation, assuming that over a 4-month period half the precipitation would occur during periods when air and surface temperatures were above 32 degrees F. It was determined, by using this method, that approximately 12,000 gallons of liquid chemical was needed to treat the 2.4 lane miles of roadway for a 16-week winter period. Safety Benefits. Annual safety benefits are the estimated benefits of accident reduction. Only the snow- or ice-related accidents occurring during the winter time period over the 3 year study period were considered. The annual rate of collisions over a 3-year period, categorized by collision type (fatality, disabling injury, property damage only, etc.), was determined, and the expected rate of collisions after implementing the safety improvement was estimated. Estimates were based on the analyst's assumptions and data obtained from Pennsylvania DOT, which had used similar systems with positive results. The annual crash estimate was determined by multiplying the annual collision rate by the resultant factor, which is the estimated percentage of collisions expected after the improvement is implemented. According to the report, there is no history in Washington of the resultant rate of collision reduction accountable to an automatic anti-icing system. Therefore, the analysis selected a mid-range resultant factor of 0.40 based on the assumption that 60 percent of snow or ice accidents (but not wet roadway accidents) would be eliminated. The assumption was based on information from maintenance managers at Pennsylvania DOT, who had observed systems in place in Pennsylvania and indicated that accident reduction due to automatic anti-icing systems was closer to 100 percent. Given that information, further consideration was warranted. Allowing for wet pavement accidents and the possibility of ice-related accidents during a refreeze or heavy snow conditions, a higher resultant factor of 0.20 was used. Thus the study analysts presumed that 80 percent of snow- and ice-related accidents would be eliminated. Collision Costs. The cost per collision by type was determined by WSDOT. The methodology used was not described in the report. The sum of these costs represents the total cost of collisions. Service Life and Salvage Value. Service life and salvage value are derived from discussions with representatives of the private sector marketing automatic anti-icing systems. Model Run ResultsWSDOT calculated the PWOC and PWOB using a spreadsheet incorporating the present worth factor of a uniform series, as shown in Figure 57. The calculated cost-benefit ratio and net benefit are the result of the worksheet. Using this worksheet, a benefit cost ratio of 2.36 and a net benefit of $1,179,274 was calculated. This ratio validated the viability of the proposed solution. In addition to cost savings from crash reductions, WSDOT management expects that the use of abrasives will be significantly reduced, resulting in lower cleanup costs and less damage to drainage structures. Improved levels of service should also result from the deployment, enhancing mobility. 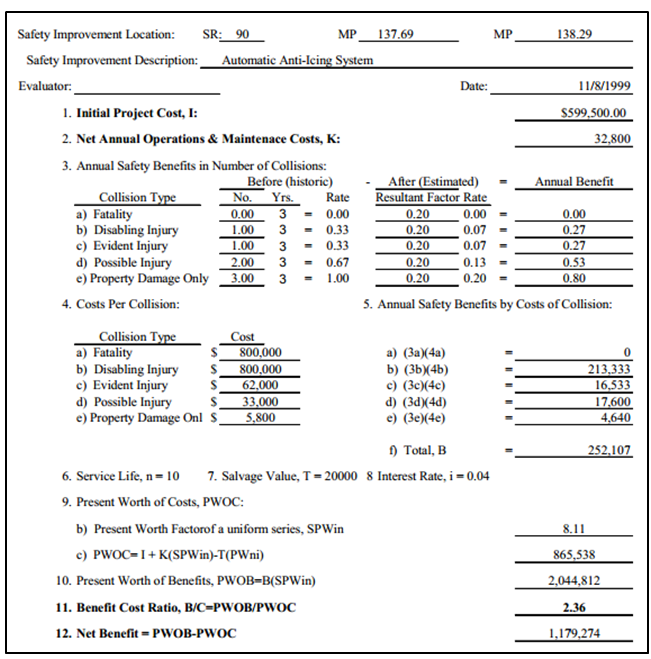 Figure 57. Screenshot. Washington State Department of Transportation benefit-cost worksheet for collision reduction. Key ObservationsThe analysis indicates that the proposed automatic anti-icing system is a viable and cost-effective method of reducing the snow- and ice-related accidents in the Interstate 90 high crash corridor, with a resulting benefit cost ratio being greater than two, and the net benefit being more than $1 million. ITS solutions to winter maintenance and operations problems are considered experimental in Washington State. This project could be considered a model to evaluate other areas on the State highway system that are prone to snow- and ice-related accidents. Overall, this ITS solution has the potential to significantly reduce accidents within this high-accident corridor and should be considered as more practical than high-cost alignment revisions. ReferenceRobert Stowe, "A Benefit/Cost Analysis of Intelligent Transportation System Applications for Winter Maintenance," Paper No. 01-0158, presented to the Transportation Research Board 80th Annual Meeting, Washington, DC, January 7-11, 2001. CASE STUDY 7.5 — BRIDGE PRIORITIZATION FOR INSTALLATION OF ANTI-ICING SYSTEMS IN NEBRASKA68
Project Technology or StrategyDuring severe winter conditions, bridges freeze before the surrounding roadways, often catching unsuspecting drivers off guard. To mitigate this issue, the NDOR evaluated installing automatic bridge deck anti-icing systems on various bridges statewide. Bridge deck anti-icing systems are one type of the road weather treatment strategies, which supply de-icing liquid chemicals to bridge decks when icing conditions are detected, thereby preventing moisture from freezing on the bridge deck. Project Goals and ObjectivesThe NDOR was interested in installing automatic bridge deck anti-icing systems as a safety enhancement. However, the presence of 2,193 bridges in Nebraska and the limited availability of funding created a need for prioritization in installing automatic anti-icing systems. Therefore, the NDOR along with the University of Nebraska-Lincoln initiated the BCA to prioritize bridges for the installation of anti-icing systems, with the objective of developing a decision-aid tool that could aid NDOR with the prioritization of bridges for most effective installation. As part of the process, NDOR selected accidents avoided as the key measure of effectiveness, and cost estimation was based on the purchase price of such systems. MethodologyTo achieve the project objective, NDOR extensively reviewed literature on automatic bridge deck anti-icing systems as well as the experiences of various transportation agencies with such systems. Based on this review, a two-step methodology was developed to guide the construction of an appropriate database and the development of the decision-aid tool for bridge prioritization. Data from diverse sources were integrated in a geographic information system (GIS) to construct the needed database and a benefit cost method was conducted as the decision-aid tool. Figure 58 presents the methodology used for database construction from various sources and development of the decision-aid tool. Database construction was accomplished in a GIS while the decision-aid tool was developed in a spreadsheet. The data utilized included bridge inventory, State accident data, weather information, traffic information, maintenance yard information, and Nebraska streets, rivers, and streams data. Additional elements were added to the integrated data to enhance its effectiveness for use by the decision-aid tool, which utilized the integrated database to provide prioritized lists of candidate bridges for the installation of automatic bridge deck anti-icing systems. 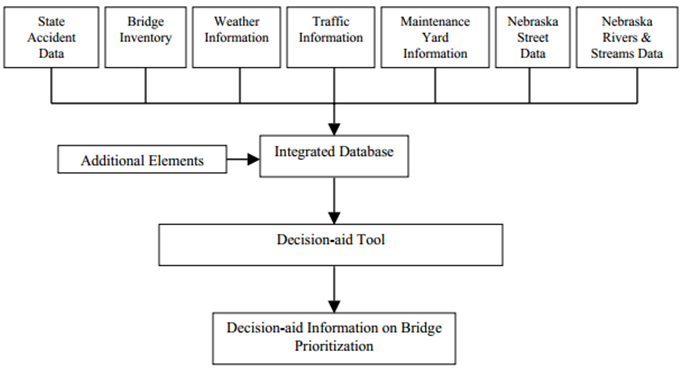 Figure 58. Diagram. Adopted research methodology. In the BCA, bridges were prioritized based on the ratio of benefits generated from the installation of anti-icing systems and the associated costs. Bridges with higher benefit cost ratios were given higher priorities. Benefits and costs were quantified in monetary terms; estimation of benefits involved looking at avoided accidents due to installation of automatic anti-icing systems while estimation of costs was based on the purchase cost of such systems. Based on information gleaned from the literature, it was assumed that installation of anti-icing systems would result in a 60 percent reduction in accidents. Benefits were then calculated by using accident costs for different injury levels. Avoided traffic delays due to fewer accidents would also contribute to benefits; however, data required to estimate traffic delays due to accidents were not readily available and, therefore, benefits from avoided traffic delays were not included in this method. Amongst the various criteria considered important in the installation of automatic anti-icing systems, the prioritization by simple accident frequency provided the most realistic and useful results for Nebraska. As such, the decision-aid tool was modified to first limit candidate bridges to those that experienced 13 or more accidents during the study period and then prioritized those bridges on simple accident frequency. Model Run ResultsUsing the BCA model, NDOR examined the experiences of several transportation agencies that deploy such systems. It found that:
In summary:
Finally, NDOR generated two priority lists, one each for Omaha and non-Omaha bridges, based on this method. NDOR will consider bridges at the top of these lists for the installation of automatic bridge deck anti-icing systems. Key ObservationsThrough the BCA, the Nebraska study proved that the bridge deck automatic anti-icing system technology has the potential to reduce accidents on bridge decks statewide significantly. In the end, NDOR used a relatively straightforward ranking by accident frequency in the production of the two priority lists of candidate bridges. The major benefit of these systems was crash reduction and consequent improvement in travel times. Lacking data and a modeling framework that would incorporate benefits other than crash reduction, NDOR opted for a process that only considered crash frequency. Such a decision system may prove functional for NDOR, but as resources continue to be limited, NDOR may want to include these other benefits in its decision process. Instruments like the Intelligent Transportation System Deployment Analysis System, the Tool for Operations Benefit/Cost and the Clear Roads BCA Toolkit now offer user-friendly systems to support the inclusion of all identified agency and user benefits in the deployment decision process. The bridge deck automatic anti-icing systems were experimental in Nebraska. The methodology and database integration processes presented in this case should be useful to transportation agencies contemplating installation of similar anti-icing systems for highway mobility and safety enhancement. ReferenceKhattak, A.P., Geza Pesti. "Bridge Prioritization for Installation of Automatic Anti-icing Systems in Nebraska," Proceedings of the 2003 Mid-Continent Transportation Research Symposium, Iowa State University, August 2001. CASE STUDY 7.6 — DE-ICING IN IOWA69
Project Technology or StrategyDe-icing is the practice of removing snow, ice and slush from a roadway surface. De-icers are employed (along with plowing) in this process to melt existing snow and ice, as well as to prevent snow and ice from forming a bond/freezing to pavements. De-icers can take on either a solid (granular) or liquid form. De-icer materials include road salt, calcium chloride, calcium magnesium acetate (CMA), magnesium chloride, potassium chloride, sodium acetate, and others. Additionally, some agencies employ abrasives, such as sand or similar grit materials, to improve surface friction; these materials do not however, perform a de-icer function (unless combined with a de-icer product, such as road salt). According to the Iowa DOT, the State uses rock salt as the primary material to combat winter storms. The department uses approximately 200,000 tons of rock salt annually to keep Iowa highways clear of snow and ice. De-icing material is deployed using trucks. Project Goals and ObjectivesTo determine cost-effective strategies for winter maintenance practices, equipment and operations agencies must quantify the value of each strategy's benefits and compare it to the costs of implementation. The Clear Roads Pooled Fund took kit was developed to facilitate and streamline BCA for various winter maintenance strategies. The Clear Roads pooled fund project began in early 2004 in response to a need for real world testing in the field of winter highway operations. This ongoing research program has already attracted 26 member States and is funding practical, usable winter maintenance research. The following case study, reproduced and adapted with permission from the Clear Roads Pooled Fund's Development of a Toolkit for Cost-Benefit Analysis of Specific Winter Maintenance Practices, Equipment and Operations: User Manual, presents the results of a BCA completed with the toolkit for de-icing operations.70 MethodologyFor this example, data provided by the Iowa DOT will be employed. Table 33 represents the basic project parameters information that the user must have available for input during the course of the evaluation.
To begin, the user will select the "Anti-icing" link under the Operations heading on the Technology Selection page. This displayed in Figure 59. 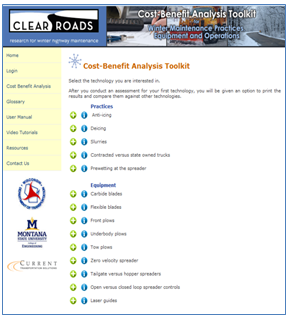 Figure 59. Screenshot. Clear Roads benefit-cost analysis tool anti-icing selection. PROJECT PARAMETERS Once anti-icing has been selected for evaluation, the user will be directed to the Project Parameters page. Here the user will define basic information for report purposes, including their name, their agency, and a brief project description. Note that certain items are set to default values, including the date, discount rate (7 percent), and life cycle (5 years in this example, although the toolkit defaults to a life cycle of 12 years). However, the user is encouraged to employ the values presently of their respective agency. For this example, the 7 percent rate and 5-year life cycle will be employed, as they are reasonable for demonstration purposes. Note that when establishing an interest rate and service life for an item, different approaches will yield different benefit cost ratios. For example, if a low interest rate and longer life are employed/assumed for an item, a higher benefit cost ratio will typically result. The same is true for when a high interest rate and long life are employed, as the costs and benefits of that item are being accrued over a longer time frame. Conversely, when a high or low interest rate is combined with a short life for an item, benefit cost ratios will fall. In addition to basic reporting information, this page also requires the user to enter specific data input parameters for later calculations. These include:
These various data items are entered into their respective places on the project parameters screen, with the user selecting the next arrow at the bottom of the screen when complete. The Tab key may be used to progress through the data entry boxes. Note that when entering values in, commas and dollar signs should not be included. For example, a material cost should be entered as 373186, as opposed to $373,186. The completed data entry is displayed in Figure 60. 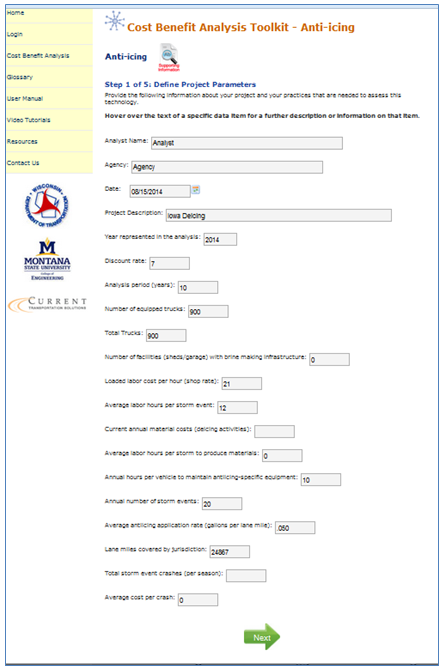 Figure 60. Screenshot. Clear Roads anti-icing benefit cost analysis tool project parameters page. COSTS ENTRY Following the entry of initial project parameters, the user is required to enter costs associated with their prospective project. Toolkit costs are divided into three categories: agency costs, user costs, and society costs. Agency costs are those associated with the purchase, maintenance and use of the specific item. User costs are those carried by the motorist, such as delay or crash costs. Society costs are those associated with the entire society, such as environmental degradation (i.e. the impacts of salt on the environment). For anti-icing, the initial steps for the user are to establish initial and annual costs to their agency. This is accomplished through the use of the two calculators provided under Agency costs. In clicking on the initial costs calculator icon, the user will be presented with a spreadsheet which determines the costs associated with the anti-icing equipment, its controller, and brine-making infrastructure. The spreadsheet is designed to automatically populate using the data entered by the user, as shown in Table 34. However, the user is encouraged to enter information, specifically manufacturer quotes, obtained specifically for their evaluation scenario. These specifics can be entered in any of the grayed boxes displayed by the spreadsheet. In the example below, the cost per vehicle for anti-icing equipment is $8,000, its controller $2,389, and brine-making infrastructure $20,000. Once the user has completed data entry or verified automated data population, the green check mark may be selected to return to the main cost screen. Upon doing so, the initial agency costs will appear on the page.
Next, the user will complete a similar procedure for annual costs. The Annual costs calculator is selected, and the user will be presented with spreadsheet automatically populated with the project parameters. In this case the user will need to enter the annual cost of brine materials, brine plant maintenance and corrosion/environmental costs. The calculator automatically populates the spreadsheet with the costs associated with brine production and annual vehicle maintenance. For this example, the annual brine material cost is estimated to be $0.07 per gallon, brine plant maintenance $2,000, and corrosion/environmental costs $0 per ton of material used. Note that for this example, no environmental/corrosion costs were employed because such costs would greatly outweigh any benefits achieved given the small expenditures on materials and labor at the subdistrict level, as well as in the absence of expected crash savings, producing a benefit cost ratio of much less than 1.0 (in reality, 0.0). Additionally, the user may enter the annual cost of sanding/grit materials used, as these would be reduced or eliminated by anti-icing. In this example, it is assumed that no such costs exist. Once the user has examined the spreadsheet, they should select the green check mark to return to the main cost page, which will be updated automatically.
In the case of anti-icing, no tangible societal costs have been identified. As a result, the user will not need to enter any information for these items, unless they choose to do so. At present, the toolkit is set up to accept a brief description of what the cost being entered is, as well as what the value of that cost is. Note that if the user chooses to add a societal or user cost, they will need to determine the entire value associated with it; the toolkit cannot calculate such costs given the lack of published information on the subject. Each cost button works in an identical fashion. 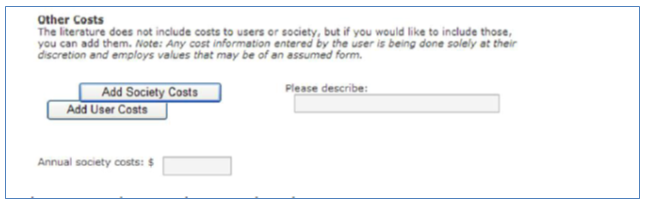 Figure 61. Screenshot. Clear Roads anti-icing benefit cost analysis tool other cost buttons selected. Once any potential societal or user costs have been entered, the cost entry page is complete. At the bottom of the page, a summary of the annualized costs associated with the anti-icing are displayed, as shown in Figure 62. 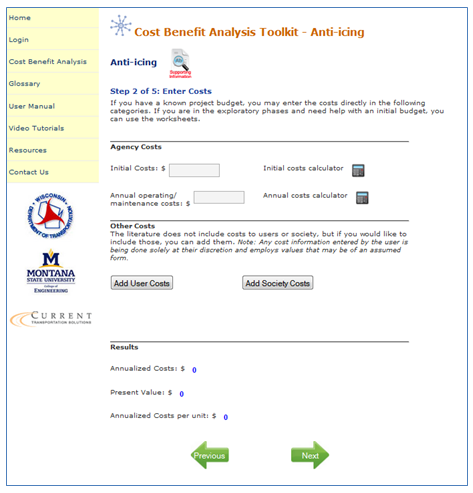 Figure 62. Screenshot. Clear Roads anti-icing benefit cost analysis tool cost page. BENEFITS ENTRY Next, the user will be presented with a screen associated with step 3 of 5, simply labeled "Benefits." This screen presents the user with a list of quantified and non-quantified benefits associated with anti-icing. A screen shot of these benefits is presented in Figure 63. At this point, the user should select the next arrow and proceed to screen 4 of 5, "Benefit Quantification." 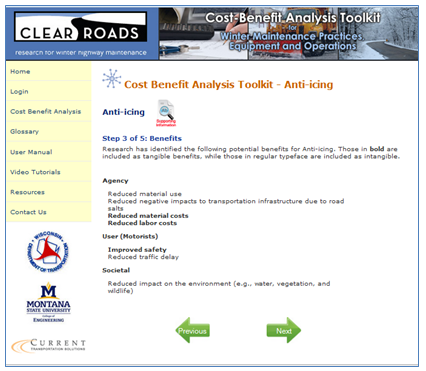 Figure 63. Clear Roads anti-icing benefit cost analysis tool benefits page. The "Benefit Quantification" screen allows the user to specify agency, user and society benefits. Agency benefits are the expected savings that an agency might expect through the use of an item. User benefits are savings that motorists might receive, such as reduced crashes or improved mobility. Societal benefits are savings such as reduced damage to the environment. When quantifying benefits, the user will often only be able to quantify those at the agency level. This is because of the lack of existing, published research detailing the accrued user and societal benefits of many toolkit items. In this example, the primary quantified benefits are material and labor savings. A conservative value of 15 percent material cost savings has been employed, while a labor savings of 50 percent has been employed based on past reported savings by agencies. In the case of anti-icing, user benefits, specifically crash reductions, have also been quantified. To include this benefit, the user will select the user benefits calculator by clicking inside the user benefits text box. For anti-icing, a conservative crash reduction of 10 percent has been employed, although no crashes were reported for this example. The user benefits calculator is shown in Figure 64. 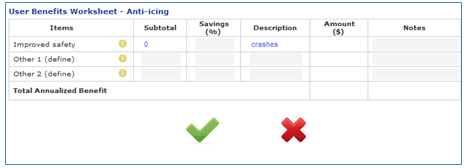 Figure 64. Clear Roads anti-icing user benefits calculator. No known tangible societal benefits have been quantified for anti-icing. Of course, if any societal benefits are known to the user, a cumulative dollar value for these may be entered in the appropriate text box on the present screen. Once all data entry related to quantified benefits is complete, the user is presented with calculations of the agency and total benefit cost ratios. The agency ratio is derived strictly from the costs and benefits associated with the agency's expenditures and savings. The total ratio is derived from the agency's costs and benefits, as well as the costs and benefits associated with users and society. Once the user has completed all data entry, including any modifications which may have required using the previous arrow, they may proceed to screen 5 of 5, the "Results" page. The user should note that they need to be absolutely certain they are finished entering or modifying input data, as there is no mechanism to move back from the report page without losing all entered data. BENEFIT COST EVALUATION The final screen presents the results of the analysis in a report format. This includes a description of the item, its components, complimentary items (other items it can be used in conjunction with), and a summary of the potential benefits the item offers. Additionally, the report presents the project parameter, cost and benefit data entered by the user. This includes all values and text entered, as well as the results of calculations made by the toolkit. Finally, the user is presented with the calculated benefit cost ratios for both the agency and in total (including user and societal inputs, if available). Due to the length of this report, a screen shot of this final page cannot be presented here. However, a key input and output information tables are presented in Tables 36 through 41.
As the results indicate, the benefit cost ratio is 34.1. The agency incurred costs of infrastructure requirements, operation and maintenance and material costs associated with anti-icing are outweighed by the benefits experienced by motorists. While step 5 presents the results of the analysis in a report format, it does so as part of the website itself. In most cases, the user will likely wish to present the final output in a Word or .pdf document. As part of the second phase of the toolkit development, an option to create a Word version of the project report has been added. Report documents can be accessed in html format via the printer icon and Word via the Word icon. The toolkit does not have the direct capability to save files in a .pdf format. The html formatted report accessed by the printer icon can be directly printed to a .pdf if the user has that capability on the machine they are accessing the toolkit on. The Word file may be converted directly into a PDF if the user holds a license for a PDF maker. Key ObservationsThis chapter has presented a step by step overview of the process employed in using the cost-benefit toolkit to evaluate anti-icing. The agency parameters and values (monetary values and percentages) used as inputs are for demonstration purposes only. These values, as well as the benefit cost ratios consequently generated only represent a potential outcome under a theoretical scenario and do not represent a recommended configuration for anti-icing. Rather, they are intended to provide prospective users with an overview of the process necessary to complete an analysis using the toolkit. For more information on the Clear Roads pooled fund tool kit, please visit: http://www.clearroads.org. ReferencesDavid Veneziano, Xianming Shi, and Lisa Ballard, Development of a Toolkit for Cost-Benefit Analysis of Specific Winter Maintenance Practices, Equipment and Operations: User Manual" (Clear Roads Pooled Fund: November 2010). Clear Roads Pooled Fund, "Cost-Benefit Analysis Toolkit for Winter Maintenance Practices Equipment and Operations" web page, available at: http://clearroads.org/cba-toolkit/terms.html CASE STUDY 7.7 — EVALUATION OF NORTH DAKOTA'S FIXED AUTOMATED SPRAY TECHNOLOGY SYSTEMS71
Project Technology or StrategyThe NDDOT installed two FAST systems, which are also known as roadway anti-icing systems, to eliminate or reduce the formation of frost, ice, and snow on the road surface through the use of chemical agents. These systems are used to improve roadway safety and reduce maintenance costs compared to traditional manual surface treatments (sand, salt, etc.). Frost, ice, and snow on roadways create dangerous driving conditions. Bridge decks can be especially dangerous because the cold air flowing underneath the structure can freeze moisture on the deck, which may not freeze on adjacent roadways. Therefore, road crews must treat roads and bridges with sand, salt, or other chemicals to improve traction and melt the accumulated ice/snow. Because manual treatments of bridge decks can be expensive and unfeasible at times, transportation departments can deploy automated anti-icing systems. Project Goals and ObjectivesThe NDDOT has installed two fixed automated spray technology (FAST) systems. One system is installed at the Interstate 29 (I-29) Buxton Bridge (near Buxton, ND), while the second installation is at the Interstate 94 (I-94) Red River Bridge between Fargo, ND, and Moorhead, MN. As part of this process, NDDOT performed a benefit cost analysis (BCA) for the two existing FAST installations to assist in determining if additional systems are feasible. In order to provide comparable benefits and costs within the analysis, NDDOT carefully selected the following key measures of effectiveness to fully capture the benefits of the program:
MethodologyFixed automated spray technology systems are intended to provide several qualitative and quantitative benefits for both motorists and transportation departments. The main quantitative benefit of FAST systems relates to reductions in societal costs from crash occurrences. Societal costs include the loss of life and quality of life, loss of productivity, legal costs, and property damage costs. The crash analyses in this section will be based on crash vehicles (the number of vehicles involved in each crash category) and factored for average annual daily traffic (AADT). In addition, transportation agencies can experience reductions in maintenance costs by using less staff, equipment, and material (sand, salt, etc.). Since frost typically develops late at night or early in the morning, which is outside of normal working hours, FAST systems reduce staff overtime, truck costs, and material/chemical costs. The main costs of FAST systems include initial implementation, anti-icing chemicals, and annual maintenance. Manual application costs include the cost of the operator, truck, and chemical/material (GEOMELT® or sand/salt). If treatment occurs after normal hours of operation, overtime pay is required. The cost analyses for manual and automated treatment methods will be based on the spray applications for the winter of 2007. The actual cost savings of reduced manual treatments is difficult to determine since maintenance staff also would be treating other road surfaces, especially during freeze conditions. However, manual treatments for frost and freeze conditions that occur outside of normal hours of operation will be considered as a quantitative benefit of the FAST system. The labor costs for these treatments would include overtime and would have a 3-hour minimum. Model Run ResultsBUXTON BRIDGE FAST SYSTEM – BENEFIT/COSTS Due to the reduction in crashes attributed to the installation of the FAST system on Buxton Bridge, there is an annual safety benefit of $78,735. Reduced maintenance costs from NDDOT employees no longer needing to manually spray the area, particularly after normal hours of operation, saves NDDOT $31,860 per year in staff overtime, truck, and material/chemicals costs. The Buxton Bridge FAST system costs over the 20-year lifecycle are nearly $400,000, including installation, maintenance and replacement, utilities, and chemical costs. Dollar values in this study are in 2002 dollars, but can be adjusted to any year by applying an appropriate price index. See Chapter 2 of this Compendium for a discussion of discount rates and inflation. This results in a 20-year net benefit of $1,257,869. The Buxton Bridge FAST system shows an estimated benefit cost ratio of 4.3 over a 20-year lifecycle. A summary of the system benefits and costs include: System Costs
System Benefits
Benefit Cost Ratio
RED RIVER BRIDGE FAST SYSTEM – BENEFIT/COSTS Due to the reduction in crashes attributed to the installation of the FAST system on Red River Bridge, there is an annual safety benefit of $162,578. Reduced congestion due to lower crash rates also attributes to $4,060 annually in benefits. Reduced maintenance costs due to employees of NDDOT and the Minnesota Department of Transportation (MNDOT) no longer needing to manually spray the area, particularly after normal hours of operation, saves NDDOT and MNDOT $48,983 per year in staff overtime, truck, and material/chemicals costs. The Red River Bridge FAST system costs over the 20-year lifecycle are $2,520,963, including installation, maintenance and replacement, utilities, and chemical costs. This results in a 20-year net benefit of $675,184. The Red River Bridge FAST shows an estimated benefit cost ratio of 1.3 over a 20 year lifecycle. A summary of the system benefits and costs are shown below: System Costs
System Benefits
Benefit Cost Ratio
The NDDOT — Fargo District believes the two FAST systems are very effective in treating the bridge structures, especially for frost conditions. Both systems have operated as expected in terms of spraying at the appropriate time and applying the proper amount of chemical agent. Key ObservationsThe benefit cost analyses produced favorable results for both FAST system installations. The major benefits of the FAST systems relate to reductions in societal (resulting from vehicle crashes) and transportation agency costs (maintenance activities). The costs for FAST systems include initial implementation, anti-icing chemicals, and annual maintenance. The two ND FAST system installations appear to be working as intended based on the results from the benefit cost analyses. Several factors contribute to these successful systems, such as selecting appropriate locations for FAST systems (primarily based on winter crash data); and having knowledgeable and dedicated staff to assist in the design and implementation of the system, monitor its operation, and perform the required maintenance procedures. ReferenceShawn Birst and Mohamed Smadi, Evaluation of North Dakota's Fixed Automated Spray Technology Systems (Advanced Traffic Analysis Center, Upper Great Plains Transportation Institute, North Dakota State University: October 2009). Available at: http://www.ugpti.org/pubs/pdf/DP219.pdf CASE STUDY 7.8 — AUTOMATIC VEHICLE LOCATION SYSTEM DEPLOYMENT IN KANSAS73
Project Technology or StrategySeveral State DOTs and municipal public works departments have implemented AVL and found it to be a valuable tool for maintenance and operations activities. AVL systems are a fleet management tool that integrates several technologies to allow a fleet manager or dispatcher to see the location of their vehicles at any given time. Many systems can also indicate the status of each vehicle. Project Goals and ObjectivesSponsored by the Kansas DOT, the University of Kansas conducted a study of the use of AVL for highway maintenance activities, especially snow removal. As part of the process, the study included a BCA associated with implementing AVL in their maintenance and operations. Toward this end, researchers carefully selected key measures of effectiveness to identify strategies that would achieve the following objectives:
MethodologyTo evaluate the cost-effectiveness of AVL for highway maintenance, cost data and qualitative and perceived benefits data were collected from State and local transportation agencies in the United States and Canada. Initially, all 50 State DOTs, all Canadian provinces, and 6 municipal public works departments were contacted to evaluate their experience with AVL for highway maintenance. Researchers found that 15 agencies were actively using AVL to track highway maintenance vehicles, and eight of them were State DOTs. Questionnaires and follow-up emails and telephone calls were provided to these agencies to further explore the technologies being used, benefits and costs experienced, and obstacles encountered. The benefit cost analysis (BCA) included four components:
Two risk perspectives were examined: very low risk translated into conservative assumptions and low risk translated into moderate (but somewhat conservative) assumptions. Costs remained constant across the scenarios. EXPECTED COSTS This study assumed that KDOT's existing 800 MHz radio system would be used, and a dedicated channel would be added for data transmissions. The implementation cost for the dedicated data channel was approximately $750,000 for a pilot project and $6 million for a statewide deployment. The KDOT Bureau of Maintenance and Construction provided these estimates based on current equipment costs. Costs will vary based on the specific deployment anticipated. In vehicles, expenditures included an In-Vehicle Unit (IVU) consisting of a GPS receiver, a data modem, and a Mobile Data Terminal (MDT). These were estimated to cost approximately $3,500, including installation. A total of 24 units were considered for the pilot project—23 maintenance vehicles and one paint truck. Road and air temperature sensors were estimated to cost $600 per vehicle. The operating costs generally involve the monthly fees for the Cellular digital packet data (CDPD) connection, if a CDPD based communication system is used. For an implementation of AVL using KDOT's radio system, operation and maintenance costs are comprised primarily of maintenance and repair for the radio system's dedicated data channel, the in-vehicle units, and the base station equipment. Annual maintenance costs were estimated to be the purchase price of the equipment divided by the typical service life. Only equipment unique to the AVL system was considered. That is, the cost of maintaining the 800 MHz radio system is a cost that would be incurred regardless of whether or not an AVL system was implemented. Consequently, the implementation of AVL adds no incremental cost to the maintenance of the existing radio system. As stated earlier, the cost of the in-vehicle units is estimated to be $3,500 each. Assuming one base station at each area office with an initial cost of $7,000, also with a service life of 7 years, the annual maintenance cost of the base stations would be $26,000. The incremental maintenance costs incurred by the addition of a dedicated data channel were estimated based on the KDOT Replacement Life Cycle of 12 years, assuming that an average of 1/12 of the equipment will be replaced each year. Under this assumption, each year's maintenance would be equal to the cost of the entire system times the percentage of the system deployed divided by 12. The total annual maintenance cost of the system, once fully deployed, would be $818,500. EXPECTED BENEFITS The nature of the expected benefits can be drawn from the experience of other agencies combined with the operational characteristics of KDOT maintenance crews. Expected benefits include the following.
Model Run ResultsThree implementation scenarios were considered. After the pilot test completion in 2004, the aggressive implementation schedule assumes one district is added to the system each year until the system is complete. The moderate implementation schedule assumes full implementation occurs over 10 years, and the conservative implementation schedule assumes full implementation occurs over 20 years. The assessment indicated that the application of AVL in highway maintenance has a benefit-to-cost ratio ranging from 2.6:1 using conservative assumptions, to 24:1 (or higher) using moderate assumptions. A moderate estimate of the net present value of statewide implementation ranges from $233 million to more than $433 million over 20 years, depending on the implementation schedule. The annual efficiency savings for the department are estimated to be nearly twice the annual maintenance cost of the system. Overall, the analysis conducted suggests that AVL can provide a significant benefit to highway maintenance operations. Key ObservationsThe study showed that the potential for AVL to improve the efficiency and effectiveness of highway maintenance operations appears to be significant. Because the technology is well established and there is some precedent among transportation agencies from which to learn, AVL implementation can be cost-effectively accomplished with a high level of confidence that the system will prove beneficial. The agency and user cost savings afforded by AVL make the technology a very appealing tool for highway maintenance activities, and the state of the practice is ready to support reliable deployment. With proper attention to planning and evaluation, AVL can help KDOT and other transportation agencies further improve the quality of highway transportation. This case demonstrates some of the fundamental building blocks of a BCA. The study team developed clear project objectives and selected alternative deployment strategies that allowed the comparison of different management decisions. In this case, both strategies proved to be efficient, even when very conservative assumptions were made for the input data. The completion of this analysis allows management not only to compare alternative AVL deployments, but to compare the benefits of AVL deployment to other TSMO investments. ReferenceEric Meyer and I. Ahmed, "Benefit Cost Assessment of Automatic Vehicle Location (AVL) in Highway Maintenance," presented to the 83rd Annual Meeting of the Transportation Research Board, Washington, DC, January 2004. CASE STUDY 7.9 — HYPOTHETICAL STUDY OF THE USE OF AUTOMATIC VEHICLE LOCATION (AVL) FOR HIGHWAY MAINTENANCE ACTIVITIES74
Project Technology or StrategySeveral State DOTs and municipal public works departments have implemented AVL system and found it to be a valuable tool for maintenance and operations activities. AVL systems are a fleet management tool that integrates several technologies to allow a fleet manager or dispatcher to see the location of their vehicles at any given time. Many systems can also indicate the status of each vehicle. Project Goals and ObjectivesThis case study assumes a hypothetical Midwestern traffic management agency is conducting a study on the use of AVL for highway maintenance activities, especially snow removal. The overall goal of the system is to facilitate the following:
MethodologyTo evaluate the cost-effectiveness of AVL for highway maintenance, cost data, and qualitative and perceived benefits data were collected from State and local transportation agencies in the United States and Canada. Questionnaires and follow-up emails and telephone calls were provided to these agencies to further explore the technologies being used, benefits and costs experienced, and obstacles encountered. In this case study we used these data to demonstrate a BCA of AVL for road weather maintenance (RWM) in TOPS-BC. The BCA includes four components:
A moderate implementation plan assumes full implementation occurs over 10 years. BENEFIT COST ANALYSIS A BCA to determine whether to implement the AVL strategy can be conducted using TOPS-BC. TOPS-BC provides the framework for conducting a BCA of an RWM alternative like AVL. For many technologies, TOPS-BC provides a rich database of likely TSMO costs and benefits. FHWA also periodically adds new information to TOPS-BC, including both entirely new technologies as well as new benefit and cost information on technologies already in the system. In this case, the user can utilize the TOPS-BC spreadsheets to set up the BCA, to estimate annualized costs and benefits, to apply alternate discount rates, to estimate some benefits and to display the results. Since TOPS-BC does not now provide cost and benefit data unique to an RWM AVL application, the user must supply much of this data. The information can be collected from other DOTs that have implemented AVL programs or the data can be produced from engineering estimates. A search of the Federal Highway Administration (FHWA) Intelligent Transportation System (ITS) Database may provide much of this information. To set up TOPS-BC to conduct this analysis, the user will open the spreadsheet modeling tool to the start page (Figure 65) and click on "Estimate Life-Cycle Costs" and in the left hand column of the Cost Page, click on "Road Weather Management." Depending on the current version of TOPS-BC, you may or may not see any information on the costs of AVL systems. If no AVL costs are displayed, the user can input cost data from available information on the specific project or may locate information on the FHWA ITS Cost database. (http://www.itscosts.its.dot.gov/its/benecost.nsf/ByLink/CostDocs). 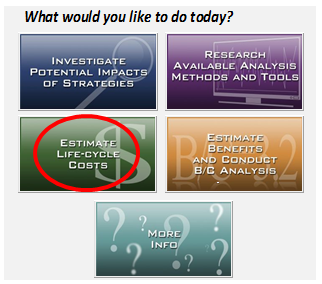 Figure 65. Screenshot. Tool for Operations Benefit/Cost start page — estimate life-cycle costs. 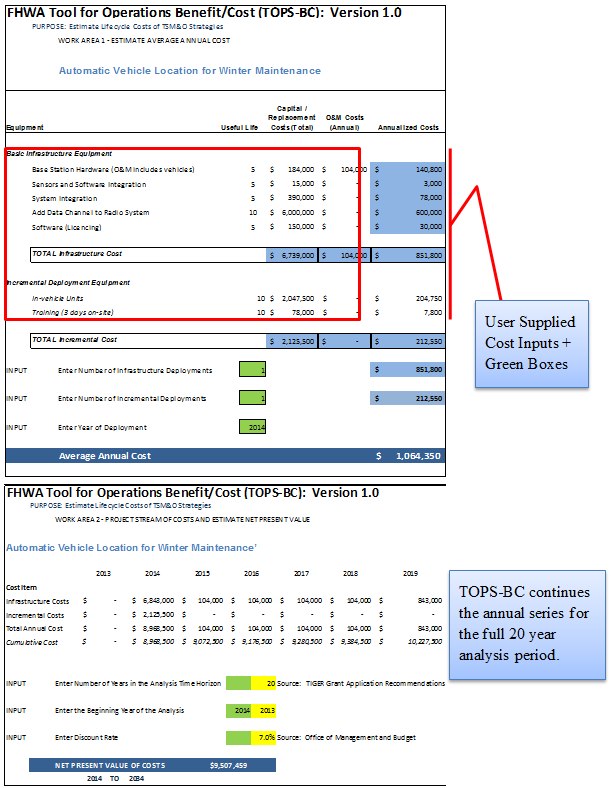 Figure 66. Screenshot. Tool for Operations Benefit/Cost new cost estimation worksheet for road weather management automatic vehicle location statewide deployment. If the user needs to input new cost information, TOPS-BC maintains a blank cost estimation worksheet that can be used to create cost estimation capabilities for new strategies that may not currently be included. A blank cost estimation worksheet is provided as a hidden sheet titled "Cost Template," shown in Figure 66 with new user provided AVL cost data included. This worksheet has all the analysis capabilities present in all other strategy worksheets, but lacks any default equipment or cost data. You may copy the data in this worksheet in its entirety and paste it into a new worksheet. This new worksheet may then be renamed and populated with your customized defined equipment and cost data as shown in Figure 67, to create new strategies, assuming that the new data is entered in the same format (e.g., equipment name, capital cost, useful life, annual operations and maintenance costs). 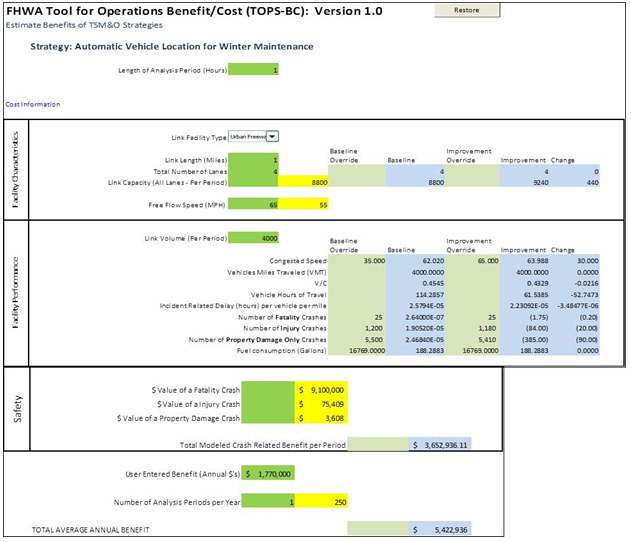 Figure 67. Screenshot. Input variables and user-supplied data for use of automatic vehicle location for highway maintenance activities. Unneeded rows may be deleted. You will need to manually modify the navigation capabilities and link the new worksheet to the SUMMARY sheet or other worksheets where they intend to use the output cost data. These procedures are explained in the TOPS-BC User's Manual. It can be found at: https://ops.fhwa.dot.gov/publications/fhwahop13041/fhwahop13041.pdf. If we take the cost estimates for a statewide deployment of AVL to support the maintenance vehicle fleet as shown in Table 42, the user can create a cost sheet in TOPS-BC. TOPS-BC will take the basic cost information provided and generate the annual costs as well as the net present value (NPV) of cost for use in a BCA (more information about calculating NPV can be found in Chapter 2 — Fundamentals of Benefit Cost Analysis). The user also provides a start date, an analysis period and a discount rate.
Note: These estimates are provided as representative. In actuality, the costs will be unique based on each deployment's characteristics.
The deployment of an AVL system is expected to provide a range of benefits. These include:
In this example, we are running TOPS-BC and we would like to modify the inputs to reflect new data. We might do this because of the similarity of an existing deployment to the one we are considering or because we have more recent or project specific information than TOPS-BC provides. In this case, by using the navigation column again we can go to the benefit inputs page for RWM and input the data for TOPS-BC to calculate certain benefits or enter benefit values we have calculated outside of TOPS-BC. These values will be used in all calculations calling for these values in TOPS-BC. In addition to the characteristics that describe your project such as technology specific costs, roadway descriptions, number of installations, etc., you may also want to input values different from the TOPS-BC defaults for economic parameters related to the measures of benefits for the project. Examples may be the value of time or reliability. Others include the price of fuel, the cost of crashes or dollar value of other benefits you may have data to support their inclusion simply to add the estimated value of these benefits to the "User Entered Benefit." Entering your own data allows you to make the analysis as specific as you can for your project. In addition, it provides a simple process for testing the sensitivity of the results to a particular variable or set of variables. Figure 66 and Figure 67 illustrate both user-supplied data inputs (Green) and TOPS-BC supplied inputs (Yellow). While there are many benefits of AVL that should be estimated in a full BCA, in this case we will use TOPS-BC to calculate only the dollar benefits of a reduction in crashes. Some other hypothetical benefit estimates will be entered directly from a previous study for Kansas DOT and will be referred to as User Supplied Benefits. These include:
Figure 67 depicts the benefit calculation input page from TOPS-BC. In this case we are only using the Facility Performance and Safety sections of the inputs to describe the change in crash rates by crash type. If we had traffic data on before and after deployments, TOPS-BC could assist in calculating travel time savings or reliability benefits. In this case, we are just focused on the procedures for calculating safety benefits, and other benefits are added as User Estimated Benefits. The safety impacts we are assuming are input to the light green cells for: Number of Fatality Crashes, Number of Injury Crashes and Number of Property Damage Only Crashes. TOPS-BC uses this information to estimate the annual safety benefits from our AVL deployment. You should note that this analysis is overriding the usual VMT change based safety impacts with the safety impacts estimated for AVL in other studies. The override makes immaterial some usual TOPS-BC inputs such as the Length of the Analysis Period which is related to the peak traffic period. TOPS-BC requires a number in this cell to move forward with the analysis, but it is not used in this case due to the override. The user can also test the inputs to see where additional benefits may be realized. This can be accomplished by modifying assumptions about the project costs, size or other dimension. The user can get a range of estimated benefits and costs. One can also test the value of assumptions such as crash rates, prices and discount rates. For example, an alternative set of crash costs by type (fatality, injury or property damage) only that reflects local crash cost experience would improve the applicability of this tool for your project. Model Run ResultsThe TOPS-BC Cost Effectiveness analysis indicates that the average annual cost for this AVL technology will be $1,064,350 with total annual benefits of $5,422,936 per period (Table 43) for a total annual net benefit of $4,358,586. This results in a benefit cost ratio of 5.10.
BENEFITS The two primary benefits of AVL deployments are improvements in operating efficiency of the fleet and a reduction in expected crashes. Together they result in net annual benefits of about $5.5 million. Each project plan is different and the realized benefits can be impacted by the plan. By varying the assumptions in the plan, BCA models like TOPS-BC allow you to see how plan assumptions will impact the expected benefits. In this case, TOPS-BC estimates that the project benefits exceed the costs. This results from the gain in operating efficiency for the system under study. This case study also demonstrated that with AVL there was better allocation of maintenance resources, resulting in less energy use. Key ObservationsThis case discussed the development of a TOPS-BC analysis model that tested AVL feasibility on an urban interstate freeway. Although this model is just a prototype, it provides a framework for the development of a model which could be used as a measure of effectiveness in fuel costs and expected safety (as measured by crash reductions) of an AVL managed roadway, thereby providing an agency with objective and predictable measures for determining whether an AVL deployment is cost effective. Prior to and after the deployment, a State department of transportation can collect data on system performance to be able to compare the changes brought about by the deployment. Those performance changes revealed impacts on both freeway and agency cost performance. These realized changes are what a pre-project deployment analysis needs in order to estimate the expected project benefits and costs. Once the project is deployed, performance indicators and their changes are known and can be used as an estimate of what might be expected if a similar project is deployed. CASE STUDY 7.10 — ENHANCED MAINTENANCE DECISION SUPPORT SYSTEM (CONNECTED VEHICLE APPLICATION)75
Project Technology or StrategyThe EMDSS application incorporates road weather data from connected vehicles into an agency's existing capabilities for maintenance decision making. The data may come from either vehicles operated by the general public and commercial entities, including passenger cars and trucks, or specialty vehicles and public fleet vehicles such as snowplows and maintenance trucks. The data is processed, either at the field or control center, to generate road segment-based outputs such as forecasts and treatment recommendations.76 Project Goals and ObjectivesThis CV application provides data to road managers to help optimize the treatment of roads using the additional information, resulting in improved maintenance operations and increased safety. MethodologyCOSTS We used the information from the 2013 Road Weather Management Connected Vehicle Applications report77 (CV BCA report) to perform a benefit cost analysis (BCA) of the EMDSS application. Based on this data, new cost line items were added to the existing cost sheet within TOPS-BC.78 Figure 68 shows the different cost items that were added. The exhibit is taken from a spreadsheet within TOPS-BC that calculates the costs of specific CV strategies. Basic Infrastructure refers to the required common infrastructure investments to support multiple CV transportation system management and operations (TSMO) projects while the Incremental Deployment section includes cost items that are application-specific. The Basic Infrastructure and Incremental Deployment sections include estimated annualized costs, operations and maintenance costs, item-specific counts, and the user-selected quantities used in this analysis. Since the case study CV deployments, including EMDSS, are assumed to take place in a hypothetical State, the distinction between necessary basic CV infrastructure investments and incremental or strategy-specific deployments needs to be clear. For the purpose of this analysis, each CV deployment BCA assumes that the respective State or metropolitan planning organization needs to acquire both basic infrastructure and incremental or strategy-specific infrastructure. However, since the basic deployment investment supports many projects and strategies, only a portion of the total basic infrastructure cost is assigned to a specific CV technology. The percentage assumes that a set of CV technologies are deployed and the specific technology's basic infrastructure cost equals that technology's share of expected benefits in the set of deployed technologies. This cost assignment would vary depending on the full set of CV technologies deployed and supported by the basic infrastructure investment. For the EMDSS case study, the assumed percentage of total basic infrastructure costs is 26 percent. The CV BCA report focused on the entire United States, so for the individual CV case studies in this compendium, the hypothetical State is assumed to have 2 percent (1 of 50 States) of the total U.S. population. The basic infrastructure quantities used in the analysis were derived from that assumption and are shown in Figure 68. When the new cost items are entered into TOPS-BC, the CV BCA report is used to identify which cost elements are needed to perform the appropriate cost analysis. If users want to analyze a specific connected vehicle application deployment strategy, the table allows for a quick identification of the cost items needed. The EMDSS application has several cost items that need to be included in a BCA. The following basic infrastructure cost items are included in this case study:
Figure 68 includes quantities and dollar values for two cost items that are specific to this strategy:
Education and outreach are necessary to inform the public about the implementation of the strategy. It is calculated on a per capita-basis, which means a cost occurs for every individual in the service area. Since the hypothetical State is assumed to have 2 percent of the U.S. population, this analysis uses the value of 6.4 million inhabitants, assuming that the U.S. population is 320 million. Furthermore, the amount of maintenance vehicles is assumed to be in relation to the length of the segment that is analyzed. The relation of maintenance vehicles per distance is assumed to be one vehicle for every 5 miles of roadway. Since this analysis assumes the entire CV environment will embrace about 100 miles of roadway, 20 maintenance vehicles are necessary for a successful deployment of an EMDSS. 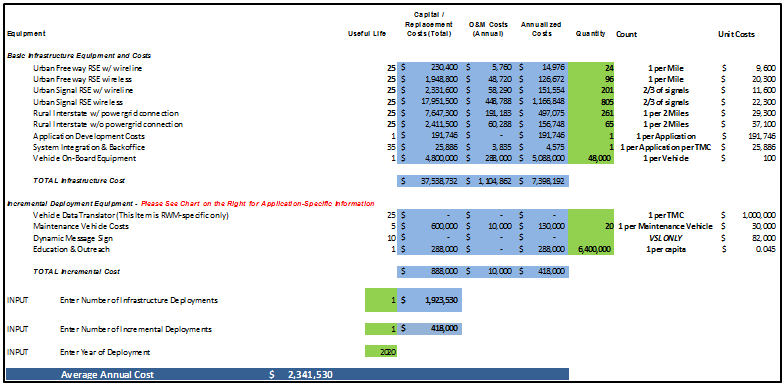 Figure 68. Screenshot. Annualized costs for enhanced maintenance decision support system. Finally, the number of infrastructure and incremental deployments was set to 1 each, because the extent of the roadway structure for the entire CV system and for this strategy in particular is already considered in the quantities shown in each cost line. The project is assumed to be in place in 2020. As Figure 68 shows, these assumptions result in annualized project costs of about $2.34 million. BENEFITS In order to estimate the benefits of this strategy, we utilized the data from the CV BCA report, which estimates the effectiveness of this strategy to be 7 percent. This means that crashes are likely to be reduced by 7 percent when the strategy is in place. Alongside this assumption is the assumed increase in capacity due to a lower amount of incidents that slow down traffic. The report set this number to 10 percent for all applications. Furthermore, crashes include three different types of incidents: property damage only, injury and fatality. Since TOPS-BC calculates the number of each of these types of incidents for all weather conditions and not just for adverse weather conditions, these values needed to be adjusted. For the purpose of this analysis, and based on the CV BCA report, it is assumed that 24 percent of incidents are related to adverse weather conditions. Hence this analysis applies to 24 percent of property damage only, injury, and fatality incidents. Figure 69 shows the CV benefit sheet within the tool. The adjusted values for property damage only, injury, and fatality crashes were entered into the green cells in the Facility Performance section of the tool. The green cells can be changed by the user and override the default values used by TOPS-BC. The capacity increase and crash reduction assumptions were implemented below the section Impacts due to Strategy. These values were also entered in the green cells, since TOPS-BC regularly does not consider any changes in capacity and uses a different crash reduction rate. For this reason, the given data within the tools were overridden. These data could come from travel demand models, freeway simulations, counts, or other sources. Note that other agency benefits, such as benefits from reduced maintenance costs due to the EMDSS are not reflected in the benefit estimation. We are aware that these savings are often the primary purpose for using EMDSS; for example, to reduce the amount of chemicals applied and number of plow passes. Analysts are encouraged to calculate such benefits independently and add them into the TOPS-BC estimates. 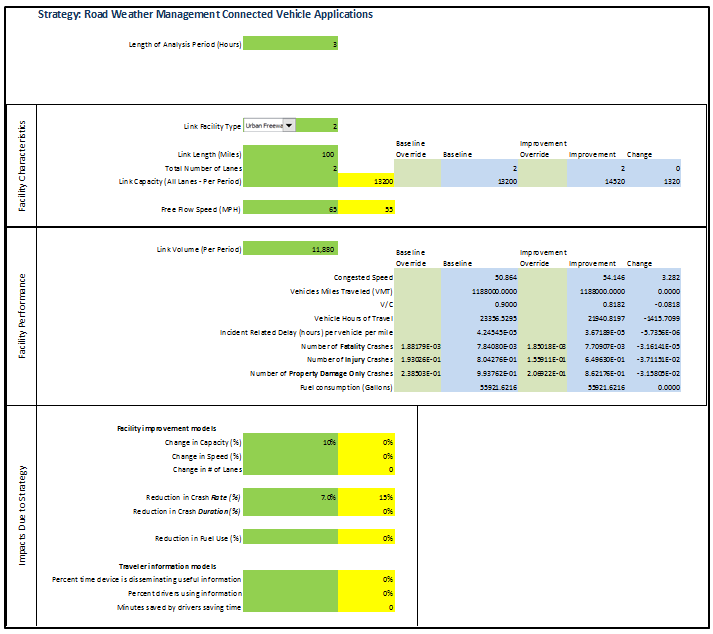 Figure 69. Screenshot. Benefit estimation assumptions for enhanced maintenance decision support system. Finally, Figure 70 shows the lower half of the CV benefit estimation page. It includes additional sections on travel time, energy and other safety benefits. The user is able to refine any TOPS-BC calculation using these sections in case more specific data is at hand. Through this flexible user interface, the user can generate refined and more accurate results. The total average annual benefit is calculated automatically by TOPS-BC and can be found the bottom of the benefit estimation sheet. The total average annual benefit for this application is $13.35 million. 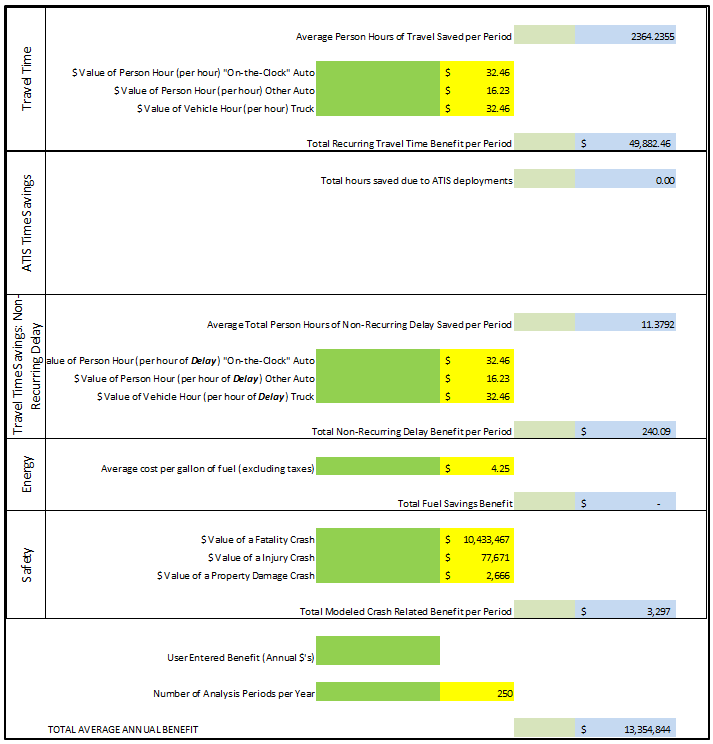 Figure 70. Screenshot. Benefit estimation result for enhanced maintenance decision support system. Model Run ResultsIn this section, the analysis compares the results of the benefits calculation with the results of the cost calculations. Note that this case study merely analyzes a specific set of costs and benefits for demonstration purposes. A full benefit cost analysis will include a wide range of additional costs and benefits that are not separately listed or analyzed in this case study. Figure 71 shows the section of TOPS-BC that compares benefits and costs for this CV EMDSS strategy. The exhibit indicates that the deployment of an Enhanced Maintenance Decision Support System in a hypothetical State, considering the various assumptions, is cost effective, since the resulting BCR for the strategy is 5.70. The resulting net benefits for this analysis are about $11.01 million. 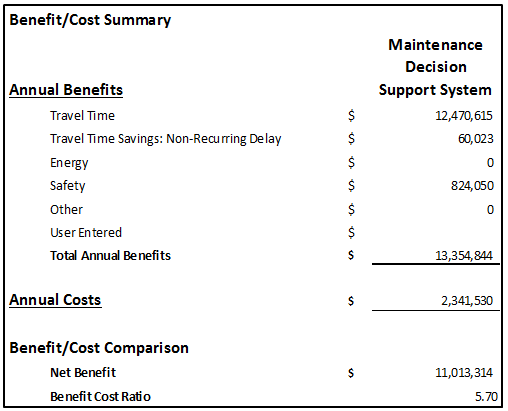 Figure 71. Screenshot. Results for connected vehicle maintenance decision support system. 63 Chapters 2 and 3 of this Compendium contain a discussion of the fundamentals of BCAs and an introduction to BCA modeling tools. These sections also contain additional BCA references. [ Return to note 63. ] 64 Ibid. [ Return to note 64. ] 65 Ibid. [ Return to note 65. ] 66 Ibid. [ Return to note 66. ] 67 Initially, it was estimated that 60 percent of snow and ice crashes would be eliminated by the proposed system, with no reduction in wet-pavement crashes. Based upon discussions with Pennsylvania DOT maintenance managers, this estimate was revised to 80 percent of snow and ice crashes. [ Return to note 67. ] 68 Chapters 2 and 3 of this Compendium contain a discussion of the fundamentals of BCAs and an introduction to BCA modeling tools. These sections also contain additional BCA references. [ Return to note 68. ] 69 Ibid. [ Return to note 69. ] 70 David Veneziano, Xianming Shi, and Lisa Ballard, Development of a Toolkit for Cost-Benefit Analysis of Specific Winter Maintenance Practices, Equipment and Operations: User Manual" (Clear Roads Pooled Fund: November 2010). Available at: http://clearroads.org/cba-toolkit/documents/user-manual/user-manual.pdf. Additional information on the Clear Roads Pooled Fund and resources are available at http://clearroads.org [ Return to note 70. ] 71 Chapters 2 and 3 of this Compendium contain a discussion of the fundamentals of BCAs and an introduction to BCA modeling tools. These sections also contain additional BCA references. [ Return to note 71. ] 72 Using a 20-year design life, the lower benefit cost ratio of the Red River Bridge FAST system, when compared to the Buxton Bridge FAST system, is a result of the significantly higher installation cost. The higher installation cost causes the chemical agent costs to have a smaller impact on the BCA. [ Return to note 72. ] 73 Chapters 2 and 3 of this Compendium contain a discussion of the fundamentals of BCAs and an introduction to BCA modeling tools. These sections also contain additional BCA references. [ Return to note 73. ] 74 Ibid. [ Return to note 74. ] 75 Ibid. [ Return to note 75. ] 76 Connected Vehicle Reference Implementation Architecture, Enhanced Maintenance Decision Support System, available at https://www.iteris.com/cvria/html/applications/app25.html [ Return to note 76. ] 77 FHWA, Road Weather Management Connected Vehicle Applications, FHWA-JPO-14-124. Available at https://ntl.bts.gov/lib/54000/54400/54480/Road_Weather_Connected_Vehicle_Applications_Benefit-508-v8.pdf [ Return to note 77. ] 78 FHWA, Tool for Operations Benefit/Cost Analysis, available at https://ops.fhwa.dot.gov/plan4ops/topsbctool/index.htm [ Return to note 78. ] | |||||||||||||||||||||||||||||||||||||||||||||||||||||||||||||||||||||||||||||||||||||||||||||||||||||||||||||||||||||||||||||||||||||||||||||||||||||||||||||||||||||||||||||||||||||||||||||||||||||||||||||||||||||||||||||||||||||||||||||||||||||||||||||||||||||||||||||||||||||||||||||||||||||||||||||||||||||||||||||||||||||||||||||||||||||||||||||||||||||||||||||||||||||||||||||||||||||||||||||||||||||||||||||||||||||||||||||||||||||||||||||||||||||||||||||||||||||||||||||||||||||||||||||||||||||||||||||||||||
|
United States Department of Transportation - Federal Highway Administration |
||