Road Weather Management Benefit Cost Analysis CompendiumCHAPTER 2. FUNDAMENTALS OF BENEFIT COST ANALYSISThis chapter explains the basic approach to economic analysis as applied to transportation decision making and how it is useful for understanding and evaluating transportation systems management and operations (TSMO) and road weather management (RWM) projects. This is not intended to replace more extensive documents on economic analysis and benefit cost analysis (BCA) available from the Federal Highway Administration (FHWA) and other sources (see box at right). This section addresses some of the fundamental concepts required for the economic analysis of projects (e.g. inflation and discounting) and then describes the fundamental components of BCA. These methods are demonstrated in the subsequent sections of this Compendium in a series of BCA studies conducted around the country on RWM projects. Note that this chapter provides a summary of portions of the FHWA Economics Primer, which is available at: http://www.webpages.uidaho.edu/~mlowry/Teaching/EngineeringEconomy/Supplemental/USDOT_Economic_Analysis_Primer.pdf FHWA BCA References Economic Analysis Primer - Operations Benefit/Cost Analysis Desk Reference – TIGER BCA Resource Guide – Economic analysis is a critical component of a comprehensive project or program evaluation methodology that considers all key quantitative and qualitative impacts of TSMO and RWM investments. It allows highway agencies to identify, quantify, and assign a value to the economic benefits and costs of highway projects and programs over a multi-year timeframe. With this information, highway agencies are able both to allocate scarce resources to maximize public benefits as well as to show a rational basis for their decisions. Economic analysis can inform many different phases of the transportation decision-making process. It can assist engineers in the development of more cost-effective designs once a decision has been made to go forward with an RWM project. In planning, it can be applied to basic cost and performance data to screen a large number of potential project alternatives, assisting in the development of program budgets and areas of program emphasis. Similarly, economic analysis can play a critical role in screening alternatives to accomplish a specific project and provide information for the environmental assessment process. The application of economic analysis to highway investments is not a new concept. The American Association of State Highway Officials published information on road-user-benefit analysis in 1952, showing that economic methods and procedures for transportation project evaluation were well understood and described 60 years ago. Of course, significant progress has been made since that time in areas as diverse as modeling future traffic flows, estimating the consequences of highway projects on safety, and the application of computer technologies to support improved economic methods. Today, many States and metropolitan planning organizations (MPO) and some local governments use economic tools in some capacity. There is, however, much diversity in application. Most agencies will occasionally quantify the life-cycle costs or net benefits of projects or investigate their economic impacts on communities. Only a minority of agencies, however, regularly measure project net benefits in monetary terms. Also, most agencies do not consider the full range of costs and benefits when conducting their analyses. In general, there is significant potential for the broader application of economic methods to TSMO and RWM decision making. The FHWA has a long tradition of promoting the application of economic analysis to project planning, design, construction, preservation, and operation. FHWA has strongly encouraged the use of life-cycle cost applications as part of its pavement design and preservation initiatives as well as in the Value Engineering program. It has also published the Operations Benefit/Cost Desk Reference cited above. In addition, the U.S. Department of Transportation (USDOT) requires a BCA to accompany all applications for Transportation Investment Generating Economic Recovery (TIGER) funding. As part of its long-term commitment to improving operations investment and management practices, FHWA will continue to develop and advance economic tools and guidance. This RWM Compendium of BCAs is part of an FHWA Office of Operations initiative referred to as "Planning for Operations" (P4O). The use of an economic analysis to compare costs and benefits in dollar terms over multiyear periods provides vital information about RWM and other comprehensive infrastructure management strategies. Benefits of Using of Economic Analysis for RWM Projects Among the beneficial applications of economic analysis to RWM projects are the following:
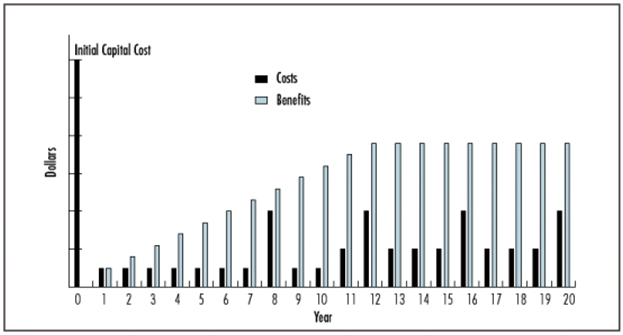
ECONOMIC FUNDAMENTALSThe most basic economic questions that people face in their day-to-day personal and business lives involve the tradeoffs between dollars earned, spent, or invested today and those dollars they hope to earn, spend, or invest in the future. Such tradeoffs must also be considered when evaluating TSMO and RWM investments. Project life cycle evaluation is important for TSMO projects—including RWM projects—as these activities can be long lived and require initial and periodic capital investments as well as ongoing materials and maintenance expenditures. A typical distribution of costs and benefits over time is presented in Figure 1.
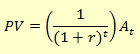
Comparison of benefits to costs over the project life cycle would be a simple issue of summation except for one problem: the value of a dollar changes over time. In particular, a dollar that an individual or agency will spend or earn in the future is almost always worth less to them today than a dollar they spend or earn now. This changing value of the dollar must be understood and quantified to enable meaningful comparisons of multiyear dollar streams. Two separate and distinct factors account for why the value of a dollar, as seen from the present, diminishes over time. These factors are inflation and the time value of resources. InflationInflation is a continuous rise in prices. This is distinct from changes in relative prices that might be caused by changes in supply or demand for specific products or services. Furthermore, technological advances and consumer preferences change over time impacting market prices. Economists usually measure inflation by comparing the price of groupings or "market baskets" of goods and services from year to year. The prices of some goods and services in the grouping will go up, while the prices of others may go down. It is the overall price level of the grouping that captures the effect of inflation. A price or inflation index is constructed by dividing the price of the grouping in each year by its price in a fixed base year and multiplying the result by 100. The change in the index value from year to year reveals the trend and scale of inflation. The Consumer Price Index (CPI) is probably the best-known price or inflation index to most Americans, but there are many others. Dollars from one year can be converted into equivalent dollars of another year (as measured by purchasing power) by using price indices to add or remove the effects of inflation. Dollars from which the inflation component has been removed are known as "real," "constant," or "base year" dollars. A real dollar is able to buy the same amount of goods and services in a future year as in the base year of the analysis. Dollars that include the effects of inflation are known as "nominal," "current," or "data year" dollars. A nominal dollar will typically buy a different amount of goods and services in each year of the analysis period. In the case of economic analysis of investments by a public agency, it is best practice to forecast life-cycle costs and benefits of a project without inflation (i.e., in real or base year dollars). Inflation is very hard to predict, particularly more than a few years into the future. More importantly, if inflation is added to benefits and costs projected for future years, it will only have to be removed again before these benefits and costs can be compared in the form of dollars of any given base year. Time Value of ResourcesMost people have a day-to-day familiarity with inflation. They are less familiar, however, with the separate and distinct concept of the time value of resources. The time value of resources is also referred to as the time value of money or the opportunity cost (or value) of resources. It reflects the fact that there is a cost associated with diverting the resources needed for an investment from other productive uses or planned consumption within the economy. This cost is equal to the economic return that could be earned on the invested resources (or the dollars used to buy them) in their next best alternative use. Equivalently, the time value of resources can be interpreted as the amount of compensation that must be paid to people to induce them not to consume their resources in the current year, but rather to make them available for future investment. The Role of the Discount RateThe time value of resources is measured by an annual percentage factor known as the discount rate. If an analyst knows the appropriate discount rate, he or she can calculate the "present value" of any sum of resources or money to be spent or received in the future. The application of the discount rate to future sums to calculate their present value is known as "discounting" (see the box on the next page). Through discounting, different investment alternatives can be objectively compared based on their respective present values, even though each has a different stream of future benefits and costs. Formula for Discounting The standard formula for discounting is as follows:
where: PV = present value at time zero (the base year); The formula above is the most basic calculation of present value. The term
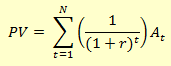
which incorporates the discount rate "r" is called the discount factor. Multiplying a future sum by the appropriate discount factor for that future year will yield the present value of that sum at time zero (e.g., the year in which the analysis is being done). Of course, most RWM projects generate costs and benefits over their entire life-cycles. This entire series of costs and benefits must be discounted to the present by multiple applications of the PV formula for each applicable year of the life-cycle (see formula below). These discounted values are then summed together (as represented by Σ) for each year of the life-cycle analysis period ("N") to yield an overall present value. The formula for doing this is as follows:
The present value of a series of numbers is often described as the "net present value," reflecting the fact that the discounted amount often reflects the net value of benefits after costs are subtracted from them. Selecting a Discount RateAs a rule of best practice, economic analysis should be performed in real terms; i.e., using dollars and discount rates that do not include the effects of inflation. A real discount rate can be estimated by removing the rate of inflation (as measured by a general price index such as the CPI) from a market (or nominal) interest rate for government borrowing. The selected market rate for government borrowing should be based on government bonds with maturities comparable in length to the analysis period used for the economic analysis. Real discount rates calculated in this manner have historically ranged from just below 0 percent to 5 percent - the rates most often used by States for discounting highway investments. The U.S. Office of Management and Budget (OMB) currently requires U.S. Federal agencies to use a 7 percent real discount rate to evaluate public investments and regulations. BENEFIT COST ANALYSISA BCA attempts to capture all benefits and costs accruing to society from a project or course of action, regardless of which particular party realizes the benefits or costs, or the form these benefits and costs take. Used properly, a BCA reveals the most economically efficient investment alternative; i.e., the one that maximizes the net benefits to the public from an allocation of resources. Useful Applications of Benefit Cost Analyses A BCA considers the changes in benefits and costs that would be caused by a potential improvement to the status quo facility. In highway and TSMO decision-making, BCA may be used to help determine the following:
The Benefit Cost Analysis ProcessIn conducting a BCA, the analyst applies a discount rate to the benefits and costs incurred in each year of the project's life cycle. This exercise yields one or more alternative measures of a project's economic merit. Major Steps in the Benefit Cost Analysis Process
The BCA process begins with the establishment of objectives for an improvement to the operation and management of transportation assets. A clear statement of the objective(s) is essential to reducing the number of alternatives considered. The next step is to identify constraints (policy, legal, natural, or other) on potential agency options and specify assumptions about the future, such as expected regional traffic growth and vehicle mixes over the projected lifespan of the improvement. Having identified objectives and assumptions, the analyst (or analytical team) then develops a full set of reasonable improvement alternatives to meet the objectives. This process begins with the development of a "do minimal" option, known as the base case. The base case represents the continued operation of the current facility under good management practices but without the RWM improvements anticipated. Under these "do minimal" conditions, the condition and performance of the base case would be expected to decline over time. Reasonable improvement alternatives to the base case can include a range of RWM options under consideration. To ensure that the alternatives can be compared fairly, the analyst specifies a multiyear analysis period over which the life-cycle costs and benefits of all alternatives will be measured. The analysis period selected is long enough to include at least one major rehabilitation activity for each alternative. Ideally, the level of effort allocated to quantifying benefits and costs in the BCA is proportional to the expense, complexity, and controversy of the project. Also, to reduce effort, the analyst should initially screen the alternatives to ensure that the greatest share of analytical effort is allocated to the most promising scenarios. Detailed analysis of all alternatives is usually not necessary. When an alternative is expected to generate significant net benefits to users, particularly in the form of congestion relief, the analyst evaluates the effect that the alternative would have on the future traffic levels and patterns projected for the base case. Changes in future traffic flows in response to an alternative will affect the calculation of project benefits and costs. The investment costs, hours of delay, crash rates, and other effects of each alternative are measured using engineering methods and then compared to those of the base case, and the differences relative to the base case are quantified by year for each alternative. The analyst assigns dollar values to the different effects (e.g., the fewer hours of delay associated with an alternative relative to the base case are multiplied by a dollar value per hour) and discounts them to a present value amount. Risk associated with uncertain costs, traffic levels, and economic values also is assessed. Any alternative where the value of discounted benefits exceeds the value of discounted costs is worth pursuing from an economic standpoint. For any given project, however, only one design alternative can be selected. Usually, this alternative will be the economically efficient one, for which benefits exceed costs by the largest amount. Based on the results of the BCA and associated risk analysis, the analyst prepares a recommendation concerning the best alternative from an economic standpoint. It is good practice to document the recommendation with a summary of the analysis process conducted. Benefit and Cost Elements to IncludeTable 1 lists the benefit and cost categories and elements that are generally included in a BCA.
The impacts of a particular alternative do not always fall neatly into benefit or cost categories. An alternative may reduce agency costs, which is a benefit. Similarly an alternative may reduce crash rates (a benefit) relative to the base case while another alternative may increase crash rates (a cost, also called a negative benefit or disbenefit) relative to the base case. Care must be taken to ensure that all costs and benefits of each alternative are fully and accurately accounted for. Note that toll receipts and other user fees are not listed as benefits or costs in Table 1. Rather, they represent transfers of some of a project's benefits from users to the agency operating the project. Many people are puzzled about how economists assign monetary values to highway project benefits and costs. For instance, how does one value an hour of travel time, or a crash? The valuation of each of the major elements listed in Table 1 is described below. Agency Costs: The assignment of monetary values to the design and construction of a project is perhaps the easiest valuation concept to understand. Engineers estimate these costs based on past experience, bid prices, design specifications, materials costs, and other information. Care must be taken to make a complete capital cost estimation, including contingencies and administrative expenses such as internal staff planning and overhead costs. A common error in economic analysis and budgeting is the underestimation of project construction and development costs. Particular care should be used when costing large or complicated projects. Expenses associated with a project's financing, such as depreciation and interest payments, are not included in the BCA. The equivalent value of such expenses is already captured in the BCA through the application of the discount rate to the agency cost of the project. Adding depreciation or interest expenses to agency costs in a BCA in most cases would lead to double counting costs. Travel Time, Delay, and Reliability: An hour of travel associated with a business trip or commerce is usually valued at the average traveler's wage plus overhead—representing the cost to the traveler's employer. Personal travel time (either for commuting or leisure) is usually valued as a percentage of average personal wage or through estimates of what travelers would be willing to pay to reduce travel time. Recently researchers have identified another important benefit: travel time reliability. Due to uncertainty in travel time, travelers add "buffer time" to their trips to ensure they arrive at their destination on time. Some TSMO and RWM projects reduce travel time, some reduce buffer time, and some reduce both. Both are benefits. Treatment of Revenues, Tolls, Taxes, and Other Transfers in Benefit Cost Analysis Tolls, taxes, and other user charges for transportation projects constitute important potential revenue sources to State agencies for financing transportation projects. However, these revenue sources are not "benefits" of a project as measured by economic analysis such as BCA. Rather, these charges represent a means by which some of the benefits to the users of the transportation project (as measured by their implicit willingness to pay for reduced travel time or improved safety) can be transferred in whole or in part (in the form of cash payments by the users) to the State or private agency that operates the facility. Adding toll or tax revenues to the value of travel time, safety, and vehicle operating cost benefits already included in the BCA would be double-counting benefits. Crashes: The assignment of monetary values to changes in crash rates or severities can provoke controversy because crashes often involve injury or loss of life. The use of reasonable crash values is critical, however, to avoid underinvesting in highway safety. Economists often use the dollar amounts that travelers are willing to pay to reduce their risk of injury or death to estimate monetary values for fatalities and injuries associated with crashes. Medical, property, legal, and other crash-related costs are also calculated and added to these amounts. The U.S. Department of Transportation (USDOT) offers extensive guidance on this subject in the current TIGER funding application guidance. (See also "Revision of Departmental Guidance on Treatment of the Value of Life and Injuries,"1 and "The Economic Impact of Motor Vehicle Crashes."2) Vehicle Operating Costs: The cost of owning and operating vehicles can be affected by a project due to the changes that it causes in highway speeds, traffic congestion, pavement surface, and other conditions that affect vehicle fuel consumption and wear and tear. Accurate calculations of a project's effects on vehicle operating costs (VOC) require good information on the relationship of vehicle performance to highway conditions and clear assumptions about future vehicle fleet fuel efficiency and performance. The USDOT does not provide official guidance on estimating VOC, but useful information on the valuation of VOC (and other BCA elements) is provided in AASHTO's 2010 "User and Non-User Benefit Analysis for Highways" and in the "Highway Economic Requirements System Volume IV: Technical Report" (FHWA-PL-00-028), Chapter 7. Benefits attributable to lower VOC are usually not a major component of a project's benefit stream. Externalities: One of the more challenging areas of BCA is the treatment and valuation of the "externalities" of transportation projects. In economics, an externality is the uncompensated impact of one person's actions on the well-being of a bystander. In the case of transportation investments, "bystanders" are the nonusers of the project. When the impact benefits the nonuser, this is called a positive externality. When the impact is adverse, this is called a negative externality. Often, when there is talk about externalities of highways, the focus is on negative externalities. Negative externalities include the undesirable effects of a project on air and water quality, noise and construction disruptions, and various community and aesthetic impacts. Positive externalities, however, also exist. A project may serve to reduce air or noise pollution from previously existing or projected levels. Several methods exist for including externalities in a BCA. In some cases, scientific and economic studies have revealed per-unit costs for air pollutants, for example, that can be incorporated directly into the BCA. Much uncertainty surrounds these valuations, however. Values can vary from project to project due to location, climate, and pre-existing environmental conditions. Risk analysis techniques can yield helpful information about the sensitivity of results to these uncertain values. Externalities are specifically dealt with in environmental assessments required by the National Environmental Policy Act (NEPA). Where adverse impacts are identified, mitigation is required to avoid, minimize, or compensate for them. Required mitigation is part of the environmental decision, and the costs of mitigation will become "internalized" in the project's cost in the BCA. The BCA effort should be coordinated closely with the NEPA assessment. When an externality cannot be put into dollar terms, it can often be dealt with on a qualitative basis relative to other, monetized components of the BCA. If the measurable net benefits of a project are highly positive, the presence of minor unquantified externalities can be tolerated from an economic standpoint even if they are perceived to be negative. On the other hand, if the net benefits are very low, then the existence of significant unquantified negative externalities may tip the economic balance against the project. Externalities Versus Indirect Effects Externalities considered in a BCA are the uncompensated direct impacts of the project on nonusers of the project. These effects are additive to other direct costs and benefits (such as the value of time saving or reduced crashes and saved lives) measured in the BCA. Direct effects, however, usually lead to indirect effects on the regional economy through the actions of the marketplace. Indirect impacts of a transportation project could include local changes in employment or land use. The value of indirect effects is not additional to that of direct effects measured in BCA; rather, indirect effects are a restatement or transfer to other parties of the value of direct effects. Comparing Benefits to CostsOnce the analyst has calculated all benefits and costs of the project alternatives and discounted them, there are several measures to compare benefits to costs in the BCA. The two most widely used measures are described below.
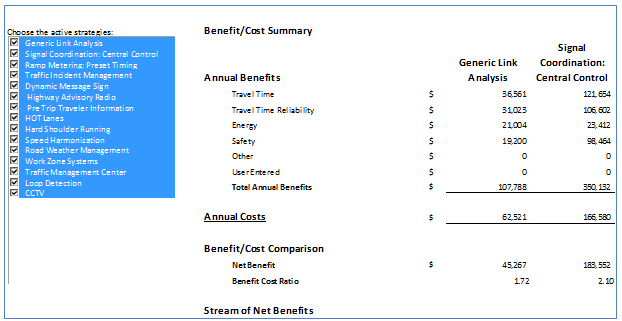
FHWA recommends the use of either the NPV or BCR measures for most economic evaluations. Other BCA measures are available and may be used, however, depending on agency preference. For example, the equivalent uniform annual value approach converts the NPV measure into an annuity amount. The internal rate of return measure represents the discount rate necessary to yield an NPV of zero from a project's multiyear benefit and cost stream. Appropriate Use of the Benefit Cost Ratio The benefit cost ratio (BCR) is often used to select among competing projects when an agency is operating under budget constraints. In particular, use of the BCR can identify a collection of projects that yields the greatest multiple of benefits to costs where the ability to incur costs is limited by available funds. However, care must be taken when relying on the BCR as the primary BCA measure. The FHWA recommends that only the initial agency investment cost be included in the denominator of the ratio. All other BCA values, including periodic rehabilitation costs or user costs, such as delays associated with construction, should be included in the ratio's numerator as positive or negative benefits. Adherence to this guidance facilitates consistent project comparisons. Use of specialized procedures such as incremental BCA, in which the increments in benefits and costs of one alternative relative to another are compared in ratio format and prioritized subject to budget constraints, can minimize the risk of selecting inferior alternatives using BCRs. A good description of the incremental BCA approach is provided in Chapter 7 of the HERS-ST Highway Economic Requirements System-State Version: Technical Report by FHWA, which is available at: https://www.fhwa.dot.gov/asset/hersst/pubs/tech/tech07.cfm. MisunderstandingsThe BCA is a powerful, informative tool available to assist planners, engineers, and decision makers. Agencies often avoid or underutilize the BCA due to misconceptions about it. In some cases, agency personnel are skeptical about the accuracy of a BCA due to perceived uncertainties in measuring or valuing costs and benefits. In reality, there is much more substance to economic analysis techniques and values than is generally understood. Where uncertainty does exist, it can usually be measured and managed. It is helpful to remember that sound economic analysis reduces uncertainty. Not performing the analysis only serves to hide uncertainty from decision makers. Another concern is that the workload involved in conducting a BCA may be excessive relative to agency resources. Once the engineering and economic capabilities are in place, however, BCA workloads diminish markedly. The level of effort to conduct a BCA should also reflect project cost, complexity, and controversy; routine projects may be analyzed with minimal effort. Finally, some agencies are concerned that the results of BCA could conflict with preferred or mandated outcomes. In any situation, an objective and independent assessment of a project's economic consequences can contribute valuable information to the decision process. There are, however, valid reasons why decision makers may choose to override or constrain economic information. For example, if there are concerns that BCA results would disproportionately favor projects in urban areas, policy makers can initially apportion funds between urban and rural areas based on equity considerations. Urban projects would then compete based on their economic merits for the urban funds; rural projects would similarly compete for the rural funds. Avoiding PitfallsAs with any analytic method, the BCA can give erroneous results if it is misused. Perhaps the foremost cause of error in a BCA is the selection of an unrealistic base case. The base case must be founded on intelligent use and management of each TSMO alternative under consideration during the analysis period. For instance, allowances should be made for traffic diversion and changing peak periods as congestion builds in the base case. Failure to factor in these elements can lead to overly pessimistic estimates of delay levels in the base case, by comparison to which any alternative would look attractive. BCA results can also be biased by the comparison of only one design alternative to the base case, even though less costly alternatives exist. A correctly conducted BCA considers a full range of reasonable alternatives. Another common hurdle involves the evaluation of a "project" that is actually a combination of two or more independent or separable projects. This is very common in TSMO and RWM projects, where maximum benefits are often achieved by the joint deployment of multiple synergistic technologies or strategies. In such cases, the net benefits of one project may hide the net costs of the other, or vice versa. Both of the projects would either be built or rejected if incorrectly considered individually, when in fact both should be built as a result of their synergy. BCA results can be erroneous if they do not include the correct cost or benefit elements or amounts associated with a project. This occurs most often when user costs or major externalities (if present) are omitted. In some cases, an agency may focus only on local costs and benefits, failing to include those that accrue outside its jurisdiction. Care must also be taken not to include "benefits" that are simply restatements of other benefits (or costs) measured elsewhere in the BCA. This latter error, a form of double counting, can occur when employment, business, or land use effects that are measured using an economic impact analysis are added to the benefits of travel-time saving, safety, and vehicle operating cost reductions. Presenting the Results of a BCAThe BCA provides information for decision makers that demonstrate whether or not a particular project is efficient and how that project compares to other projects. The analysis can be performed for a new project or for an already deployed project. The results of the BCA inform the decision maker, who considers these results along with other investment alternatives, available budgets, and other information to decide if the project will move forward. This may mean that further research is needed to refine the estimates or that the project is ready for deployment. As discussed above, findings from a BCA can include the dollar value of costs and benefits, the estimated benefit cost ratio (BCR), the net benefits, and the return on investment. There may also be comparisons of these values for project alternatives. Most BCA software tools provide a tabular summary of the results as standard tool output. Figure 5 and Table 2 provide example tabular displays of the BCA results from the Tool for Operations Benefit/Cost (TOPS-BC) and the Clear Roads BCA Toolkit.
In addition to spreadsheet tools developed for specific projects or with modifications to TOPS-BC and the Clear Roads BCA Toolkit, these tabular displays can provide the summary data to demonstrate how results vary across selected project assumptions. Table 3 was developed by the NJDOT to evaluate the benefits and costs of their Incident Manage System. NJDOT was planning to request Federal funding for an Incident Management Program. In their summary of the BCA results, they chose to compare the BCA results that could be achieved with a 15-minute verses a 30-minute reduction in incident duration.
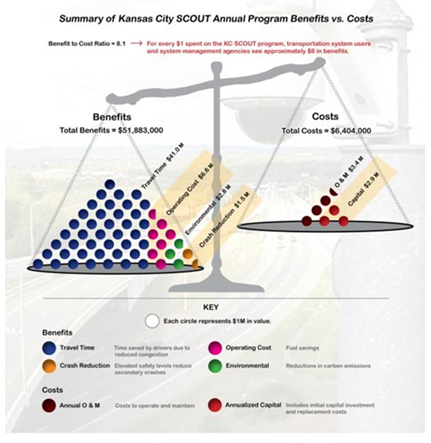
This tabular output may be all that is needed by the decision maker. However, graphic displays often provide a visually informative display of results that assists decision makers, public officials, and the public to understand the results. This is particularly true where the project or analysis is complex and the tabular display is hard to interpret. Several such graphic displays are discussed and displayed below. Figure 6 is from a Kansas City SCOUT program benefit cost study. This graphic captures the fundamental goal of a BCA to provide a comparison of the benefits received from an expenditure of costs. It also allows for the presentation of the relative importance of benefit and cost components to the overall benefit-to-cost ratio.
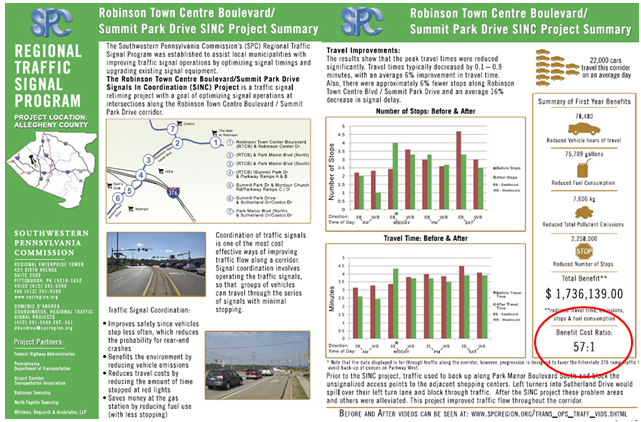
In another BCA, the Southwest Pennsylvania Regional Traffic Signal Program used a "newsletter" approach to highlight the results of their study. Figure 7 is an example of this BCA display technique.
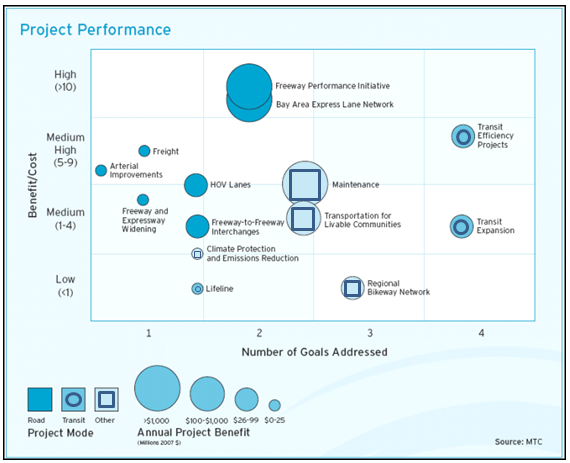
Finally, graphic displays can seek to present a large amount of information in a single display. The Metropolitan Transportation Commission (MTC) in the San Francisco Bay Area provided multi-modal BCA evaluation results where the magnitude of the BCA results and achieving stated planning goals were displayed concurrently (see Figure 8). Depending on the purpose of the presentation of the results, analysts can balance simplicity of tabular information with creative displays that present multiple dimensions of the analysis.
1 Federal Aviation Administration, "Revised Departmental Guidance: Treatment of the Value of Preventing Fatalities and Injuries in Preparing Economic Analyses," February 2008. Available at: https://www.faa.gov/regulations_policies/policy_guidance/benefit_cost/media/Revised%20Value%20Of%20Life%20Guidance%20Feburary%202008.pdf [ Return to note 1. ] 2 National Highway Transportation Safety Administration, "New NHTSA Study Shows Motor Vehicle Crashes Have $871 Billion Economic and Societal Impact on U.S. Citizens," (press release), May 28, 2014. Available at: https://www.nhtsa.gov/press-releases/new-nhtsa-study-shows-motor-vehicle-crashes-have-871-billion-economic-and-societal [ Return to note 2. ] | |||||||||||||||||||||||||||||||||||||||||||||||||||||||||||||||||||||||||||||
|
United States Department of Transportation - Federal Highway Administration |
||