Road Weather Management Benefit Cost Analysis CompendiumCHAPTER 3. INTRODUCTION TO BENEFIT COST ANALYSIS TOOLSConducting a benefit cost analysis (BCA) for one or more RWM strategies can be accomplished with the support of several available software tools. Some of these tools are generic and support the analyst in organizing their data for BCA. Others are more focused on the needs of analysts examining road weather management (RWM) strategies and options. These include tools developed by regional, State, and Federal agencies as well as proprietary tools developed by many private sector enterprises. These software tools range from simple methods intended for one-time analysis to more complex tools that are continually maintained and updated. Additionally, several emerging tools and methods are currently undergoing development as part of parallel efforts by the U.S. Department of Transportation (USDOT), American Association of State Highway and Transportation Officials (AASHTO), the Strategic Highway Research Program 2 (SHRP2), individual States and regions, and research organizations. For example, the Clear Roads Pooled Fund Study has developed a detailed internet-based Winter Weather Road Management BCA Tool. Some of the most widely distributed and applied tools used for conducting benefit cost analysis of RWM strategies include those summarized (in alphabetical order) in Table 4. This listing summarizes those major tools developed by Federal, State, or regional transportation agencies (or affiliated research organizations) that are available within the public realm. This listing does not include proprietary offerings of private-sector vendors. Specific descriptions of the various tools follow.
The following sections provide a brief introductory description of the tools and methods presented in Table 4. More detailed information can be accessed by following the links provided.
The above tools and research efforts represent a sample of the available methods that may be used for supporting and conducting benefit cost analysis of TSMO strategies. The capabilities of many of these tools and the findings of the research efforts are more fully described in the Operations Benefit/Cost Analysis Desk Reference (this publication is available at: https://ops.fhwa.dot.gov/publications/fhwahop12028/index.htm). In addition, these developed tools and associated published research often form the basis for the benefit and cost estimation capabilities incorporated in the TOPS-BC tool developed for the FHWA Office of Operations Planning for Operations initiative. TOOL FOR OPERATIONS BENEFIT/COST — A TOOL FOR BENEFIT COST ANALYSIS OF ROAD WEATHER MANAGEMENT STRATEGIESTOPS-BC provides an analysis framework and many default parameters that offer the capability to conduct simple sketch-planning-level BCAs for selected TSMO strategies, including a framework for addressing RWM strategies. This capability provides practitioners with the ability to conduct a BCA quickly, simply, and with generally available input data. A number of the sketch-planning tools and analysis frameworks described above give analysts the ability to assess the benefits of a particular strategy or small sets of strategies. TOPS-BC leverages many of these existing tools to identify best practices and synthesizes their capabilities into a more standardized format for analyzing a broader range of strategies within a single tool. Compendium users should familiarize themselves with TOPS-BC. This can be accomplished by:
FHWA also maintains an information base on TSMO including RWM costs and benefits that provides links to a variety of previous studies and data on TSMO strategies and deployments. TOPS-BC also links the estimation of sketch-level benefits with life-cycle cost estimates. This ability to estimate benefits and costs directly within a single tool is uncommon in existing tools. Further, the TOPS-BC benefit estimation methodology was developed to incorporate the assessment of new performance measures (e.g., travel time reliability) that are more capable of capturing the unique impacts of many operations strategies. Finally, the benefits estimation capability of TOPS-BC incorporated much of the latest research on the benefits of TSMO and RWM, particularly for many new and emerging strategies. TOPS-BC provides the ability to assess the sketch-planning level benefits of various TSMO and RWM strategies using minimal user data input. Changes in performance measures, such as throughput, speeds, and number of crashes, are based on simple and established relationships used in numerous other models. With generally available data such as corridor speeds, volumes, and capacities, TOPS-BC can produce an estimate of the change in performance resulting from the implementation of TSMO strategies. This change in performance can then be used to generate enhanced metrics, and the estimated benefits can be monetized within the tool and compared with estimated life-cycle costs for the strategy. While the sketch-planning-level analysis provided by TOPS-BC may be suitable for many planning studies, TOPS-BC was not intended to serve as a single analysis tool to be used for all situations. The Desk Reference discusses conducting BCAs for those deployments that require detailed output and high levels of confidence in the accuracy of the results as well as how these studies may require more advanced analysis capabilities than provided directly within TOPS-BC. Even in these situations, however, TOPS-BC may provide value in serving as a framework for monetizing benefits and comparing them with costs. Outputs from more advanced simulation or dynamic traffic assignment tools may be used as inputs to TOPS-BC, overriding the performance impacts normally calculated within the tool. TOPS-BC is intended to provide a framework for analysts that can be modified and configured to match the needs of their regions and the characteristics of the area being analyzed. Default data is provided for many impact parameters, performance relationships, and benefit valuations. Such default data are typically based on national averages or accepted values. However, opportunities are provided, and users are encouraged, to use locally configured or regionally relevant data where appropriate and desired. The TOPS-BC life-cycle cost estimation capabilities and benefit estimation capabilities provide a common instructional worksheet with links to individual strategies housed on separate worksheets. The outputs from the benefits estimation function include the Average Annual Benefit and the Stream of Benefits time horizon (up to 50 years). The estimated benefits for all strategy sheets are rolled up in a summary sheet that estimates the cumulative benefit for all strategies deployed in the selected analysis. The cases provided in the compendium cover many of the strategies included in TOPS-BC. In some cases the strategies analyzed are evaluated with custom-developed tools or with benefit cost analysis software such as those identified above. In other cases, the strategy is evaluated with TOPS-BC where model input and output data are provided. Still other cases offer examples setting up, modifying, and running TOPS-BC for TSMO strategies. TOOL FOR OPERATIONS BENEFIT/COST CURRENT SAFETY IMPACT DEFAULTSIn the TOPS-BC methodology, the number of crashes is generally estimated by applying a crash rate based on crashes per vehicle miles traveled. The overall crash rates are based on crash rates from the FHWA's ITS Deployment Analysis System (IDAS) analysis tool. Different rates are provided by roadway type (freeway or arterial) and for three different crash severity levels (fatality, injury, and property-damage-only (PDO)). For selected categories (freeway injury and PDO crashes) the rates are sensitive to the volume/capacity ratio of the analyzed facility and increase at higher levels of congestion. Table 5 shows the safety rates use for the different categories. Table 6 shows the volume-to-capacity-ratio-sensitive rates used for estimating the freeway injury and PDO crashes.
Using this general methodology, the number of crashes is predicted to change for any strategy that results in a change in VMT or for any strategies that result in a change to the volume-capacity (V/C) level of freeway facilities. In addition to this general estimation methodology, some RWM-related strategies available for analysis in TOPS-BC also have specific default safety impacts associated with them that are applied on top of any crash change resulting from a change in VMT or V/C ratio. Table 7 presents these default impacts currently used in the tool. TOPS-BC provides the user the ability to accept all defaults and complete a run or to modify defaults with other available data and run the analysis with the new assumptions. This also allows the user to conduct a simple results sensitivity analysis based on specific assumptions.
BENEFIT COST ANALYSIS FOR ROAD WEATHER CONNECTED VEHICLE APPLICATIONSIn 2013, FHWA published the document Road Weather Connected Vehicle Applications – Benefit-Cost Analysis.3 This report, herein referred to as the CV BCA Study, explains the purpose of connected vehicle (CV) applications that support RWM practices. The report describes seven road weather CV applications, including their concepts of operations. The applications are fully defined in the companion report, Concept of Operations for Road Weather Connected Vehicle Applications.4 Table 8 lists all seven applications and provides a brief description of each.
FHWA also conducted a number of informational BCA workshops in 2015 and 2016. The goal of the workshops was to familiarize agency staff with benefit cost analysis (BCA) as an economic evaluation tool for TSMO planning and decision-making. For these workshops, FHWA developed an expanded version of TOPS-BC for demonstration purposes. This version, called TOPS-BC 1.2 Beta – Connected Vehicles, includes the CV strategies listed in Table 8. In this compendium, BCA of five CV strategies are added as follows:
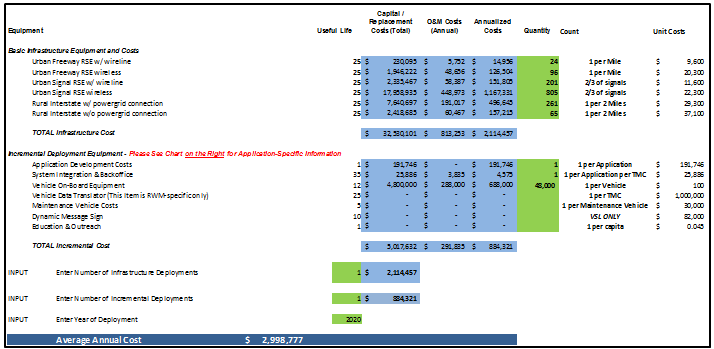
By evaluating these different strategies in a hypothetical CV environment, the compendium aims to provide guidance on how to measure the costs and benefits of Road Weather CV applications, what information or data are needed in to run a BCA, and how TOPS-BC can be used. The case studies analyze each of the five strategies in the same hypothetical State. The next section describes the basic infrastructure investments needed to implement CV applications. This infrastructure serves as backbone for all strategies analyzed in this document. Each case study provides a description of the different costs and benefits associated with deployment. Note that the CV BCA report considers deploying CV applications at the national level. In contrast, the individual case studies presented in this compendium look at a hypothetical State. This State is assumed to have 2 percent of the U.S. population. Connected Vehicle System Basic Infrastructure CostsThere are three categories of costs considered in the analysis: basic infrastructure costs, road weather specific CV costs, and application specific costs. The first set of costs is incurred regardless of which applications are deployed and can be used by all CV applications including those designed for a purpose other than road weather management. The basic infrastructure CV environment will require the deployment of several types of equipment to wirelessly connect vehicle-to-vehicle (V2V) and vehicle-to-infrastructure (V2I). Vehicles will have on-board equipment (OBE) units which broadcast and capture signals from other vehicles and from the infrastructure. To collect and collate information from multiple vehicles in an area, roadside equipment (RSE) is expected to be required to receive and broadcast signals between vehicles and traffic management centers (TMC). Currently OBEs and RSEs are not widely developed or deployed; therefore to assess the coverage of a CV system, the deployment scenario must assume a set of projections for the deployment of these technologies. We used the 2013 CV BCA report to gather basic background information needed to perform BCA of CV applications. Based on this data, new cost line items were added to an existing cost sheet within TOPS-BC.5 Figure 9 shows the different cost items that were added. The illustration is extracted from a spreadsheet within TOPS-BC that calculates the costs of specific CV strategies. Basic Infrastructure refers to the required infrastructure investments while the Incremental Deployment section includes cost items that are application-specific. The Basic Infrastructure and Incremental Deployment sections include estimated annualized costs, operations and maintenance (O&M) costs, item-specific counts and the user-selected quantities used in this analysis.
While the CV BCA report focused on the entire United States, the case studies assumed the hypothetical State contains 2 percent (1 of 50 States) of the entire population of the United States. The basic infrastructure quantities used in the analysis were derived from that assumption and are shown in Figure 9. When the new cost lines shown in Figure 9 are entered into the Excel-based tool, the CV BCA report contains a table, shown in Figure 10, that identifies the cost elements needed to perform a proper cost analysis. If users want to analyze a specific CV application deployment strategy, the table allows for a quick identification of those costs.
The quantities shown in Figure 9 are assumptions made for the hypothetical State being analyzed. Different regions or States in the United States will likely have a different set of characteristics. Care must be taken when applying this analytic approach to other locations. However, when these characteristics are known, the tool offers a high-level insight into the relationships and trade-offs between benefits and costs that are useful in decision-making. Finally, the number of infrastructure and incremental deployments was set to 1, because the extent of the roadway structure for the entire CV system is already represented in the quantities shown in every cost line. Note that the three incremental cost elements (Application Development, System Integration and Backoffice Costs) as well as Incremental On-Board Equipment are shown in Figure 9, even though they do not constitute basic infrastructure costs. They are listed in the illustration nevertheless, since they are necessary for all applications mentioned in the case studies. Application Development is set to 1, since each application is analyzed individually. It is also assumed that every application needs 1 traffic management center (TMC), which is why the quantity for System Integration and Backoffice is set to 1 as well. Finally, the average amount of cars per 1000 people in the United States was used in the case studies, which for the hypothetical State is assumed to have 2 percent of the U.S. population, or 6 million inhabitants. One percent of this number was assumed to be early adopters of vehicle on-board equipment, or about 48,000 vehicles. The combination of basic and incremental deployment equipment costs necessary for each CV application in this compendium leads to total average annual costs of about $3 million. Additional costs will be added for each application as shown in Table 9.
Source: Booz Allen Hamilton, January 2013.
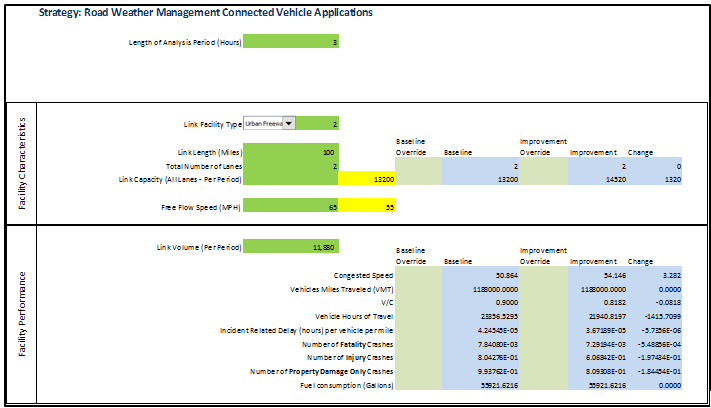
Connected Vehicle Applications Benefits EstimationThe CV BCA report made several general assumptions that are valid for benefits estimation of weather-related CV applications. Figure 10 shows a portion of the CV Benefit worksheet in TOPS-BC that includes these preset assumptions. Since TOPS-BC focuses on peak periods as opposed to the entire day, the length of the analysis period is set to 3 hours, as this constitutes a standard peak period in a metropolitan area. Subsequently, the link facility type is set to Type 2 – Urban Freeway, as most of the benefits of CV applications will likely be generated in urban areas. The total link length of urban freeways in the hypothetical State is assumed to be 100 miles. The average number of lanes is set to two. This assumption offers a conservative estimation of benefits, since more lanes generally yield higher benefits when traffic conditions improve. The link capacity in the yellow cell is calculated by the tool depending on the number of lanes, length of the analysis period, and the link facility type. Free flow speed is set to 65 mph instead of the standard value of 55 mph, because the analysis assumes that the average roadway user exceeds the official speed limit on a regular basis, and some metropolitan areas allow for higher speed limits than 55 mph. Finally, the link volume is set to 11,880, which is derived by calculating 90 percent of the link capacity. This assumption ensures that the traffic flow is heavy and close to the maximum capacity of the roadway structure for the peak period. Each case study describes the costs and benefits of the CV application. The cost section explains the incremental costs since the basic infrastructure costs are already discussed above. The analysis includes specific incremental cost elements for each application as presented in Table 9. The case studies also describe several assumptions made regarding costs and benefits. HOW TO USE THE COMPENDIUMThe RWM Compendium is designed to work with the Desk Reference and the TOPS-BC User's Manual. Together the Desk Reference and the TOPS-BC User's Manual provide the basic instructions for conducting a RWM BCA. The RWM Compendium complements these resources by providing case references where BCAs have been completed for RWM projects. In addition, the hypothetical examples demonstrate particular uses and modifications of TOPS-BC. A model like TOPS-BC is designed to cover a range of projects and include cost and benefit computations for each technology. Notably, some models are developed for a specific technology or strategy. For example, the Clear Roads Pooled Fund Decision Support System (PFDSS) provides a specific analysis of maintenance decisions, including RWM technologies.6 A technology- or strategy-specific model usually contains more detail about the deployment of the technology and may require more specific information from the user. Such a model is usually applied closer to deployment than a sketch planning tool. Users who have a particular strategy or technology they are interested in evaluating can check Table 10 to see if their strategy is included in this compendium. This table lists types of strategies and technologies along with an indication of the project title if it is a previous BCA. If it is a hypothetical case, the description is more generic. The table also indicates the kind of information addressed by each case study to assist the user in locating the example that will be most suited to their current needs. Each case presented is an example of a BCA previously conducted for an RWM strategy or technology or an example of how such an analysis could be undertaken in TOPS-BC. The column headings indicate some of the areas addressed in each case. These include:
TOPS-BC was released by FHWA in late 2013. As such, not many completed and published analyses using the software exist. Few of the real-world cases presented in the RWM Compendium use TOPS-BC. As with any analysis, finding the right tool is critical. In many cases this is a custom application developed for the particular project under review. In the future, TOPS-BC will facilitate this process by providing a model with default data and algorithms that allow the user to get started quickly and to easily modify the tool as new data and methods evolve during the planning process. Some BCA models are generic by design. They allow the user to construct the analysis of a particular project, and the models assist with the calculation. An example of this type of model is BCA.Net, which is available at https://fhwaapps.fhwa.dot.gov/bcap/BaseLogin/LoginReg.aspx.
3 FHWA, Road Weather Connected Vehicle Applications (2013), FHWA-JPO-14-124. Available at https://ntl.bts.gov/lib/54000/54400/54480/Road_Weather_Connected_Vehicle_Applications_Benefit-508-v8.pdf [ Return to note 3. ] 4 FHWA, Concept of Operations for Road Weather Connected Vehicle Applications (2013), FHWA-JPO-13-047. Available at https://ntl.bts.gov/lib/47000/47300/47330/74CD2020.pdf [ Return to note 4. ] 5 FHWA, Tool for Operations Benefit/Cost Analysis, available at https://ops.fhwa.dot.gov/plan4ops/topsbctool/index.htm [ Return to note 5. ] 6 FHWA, Road Weather Management Program Projects and Activities Web page, "Maintenance Decision Support System (MDSS) Prototype." Available at: https://ops.fhwa.dot.gov/weather/mitigating_impacts/programs.htm#p3 [ Return to note 6. ] | |||||||||||||||||||||||||||||||||||||||||||||||||||||||||||||||||||||||||||||||||||||||||||||||||||||||||||||||||||||||||||||||||||||||||||||||||||||||||||||||||||||||||||||||||||||||||||||||||||||||||||||||||||||||||||||||||||||||||||||||||||||||||||||||||||||||||||||||||||||||||||||||||||||||||||||||||||||||||||||||||||||||||||||||||||||||||||||||||||||||||||||||||||||||||||||||||||||||||||||||||||||||||||||||||||||||||||||||||||||||||||||||||||||||||||||||||||||||||||||||||||||||||||||||||||||||||||||||||||||||||||||||||||||||||||||||
|
United States Department of Transportation - Federal Highway Administration |
||