Applying Archived Operations Data in Transportation Planning: A Primer4. OBTAINING ARCHIVED DATA THAT PLANNERS NEEDThis chapter provides information aimed to help planners understand where they can obtain archived operations data, which data elements are particularly useful for planning, and basic information on how data can be processed to become useful information. This chapter also identifies critical considerations for agencies looking to implement a data archive to support planning. Locating and Accessing Archived Operations DataPlanners who are interested in obtaining archived operations data have several options. Depending on the type of operations data desired, planners may find it within their organization, other public agencies (e.g., State departments of transportation (DOTs), metropolitan planning organizations (MPOs), local traffic departments), university research laboratories, or from the private sector. If critical data is not available, planners may be able to get the resources needed to collect the data; although, this primer does not provide guidance in data collection. Chapter 6 provides a detailed list of specific sources for archived operations data, including some that are available for no cost. For example, the Federal Highway Administration (FHWA) provides the National Performance Measures Research Data Set (NPMRDS), which contains archived speed and travel time data for the National Highway System, to MPOs and State DOTs for free. The four cases below provide examples of where planners at MPOs and State DOTs are obtaining archived operations data to advance their planning activities.  Figure 6. Map. Outline of New York State. Capital District Transportation CommitteeThe Capital District Transportation Committee (CDTC) is the MPO for New York's Capital Region operating out of Albany, New York. CDTC maintains a summary of traffic volume data for Capital District roadways in its Traffic Volume Report. The Traffic Volume Report includes data for all State and non-State roadways with functional classifications greaterthan local. CDTC collects data for this report through different mechanisms, including obtaining traffic counts from the MPO's member agencies and the New York State DOT's Management Information System for Transportation (MIST) data set.7 Table 3 contains highlights of the operations data obtained by CDTC and its use in planning.
CDTC has found value in using archived operations data for identifying transportation needs and problems. Specifically, it has access to the MIST data set that provides volume, speed, and incident data along I-87 and I-90. The committee has used its travel demand model to identify and quantify congestion problems. The model is focused on AM and PM peak-hour traffic on a typical weekday. The MIST data provides a more comprehensive understanding of weekday congestion patterns on the Interstate system. For example, MIST data demonstrated that average operating speeds on the Interstate system, in the absence of incidents, were generally higher than predicted by the model. The Northway (I-87) had a similar amount of delay as I-90, but the MIST data indicated that reliability was worse on the Northway, consistent with a popular perception that the Northway has worse congestion. The MIST data also highlighted that congestion was especially severe on Fridays in the summer, when vacation travel mixes with commuter travel. This perspective was overlooked by focusing on typical PM peak-hour data. MIST data allows the MPO to understand and weigh the costs and benefits of investments to address non-recurring and recurring delay. It contributed to CDTC establishing a strong priority for operations and incident management and a strong policy in the congestion management process and regional transportation plan that expressways in the region will not be widened to address congestion except in the context of managed lanes.
The MIST archived data including volumes, speed, and incident data allow the CDTC to understand and weigh the costs and benefits of investments to address nonrecurring and recurring delay.
CDTC has used archived operations data to better understand its travel demand model. Comparing the outputs from their model with the archived data, CDTC learned that its models were not as effective in predicting delay as they had believed. CDTC intends to use archived data to improve these models. CDTC contracted with a consultant to develop a tool to assist in the analysis of archived operations data. A previous challenge to analyzing the data was that the MIST data set was large and consisted of many unlinked tables within the database. Prior to the development of the tool, conducting analysis was a labor-intensive process requiring coordination between many of these different tables to understand the data. Maricopa Association of Governments Figure 7. Map. Outline of Arizona. The Maricopa Association of Governments (MAG) is the MPO for the metropolitan Phoenix area. The primary sources of archived data used at MAG come from the Arizona Department of Transportation's (ADOT's) Freeway Management System (FMS) and private sector probe data. The ADOT FMS data provides volume, speed, and vehicle classification, but is limited to approximately 69 percent of the urban freeway system. The data purchased from the private sector and NPMRDS data provides speeds for the for the entire freeway and arterial system, but does not provide volumes. MAG has purchased probe data for the last 4 years. MAG has been using the NPMRDS data for travel model validation as well as for calculating congestion-related performance metrics. Table 4 identifies the operations data types obtained by MAG and how MAG uses the data to support its planning activities.
In 2012, MAG developed in-house an interactive performance dashboard that allows all audiences to access the various multimodal performance outcomes at the system and corridor levels. The dashboard, called MAGnitude, is supported through a partnership between ADOT, MAG, and Valley Metro. It provides reliability, delay, congestion, volume, speed, and other measures on a map-based interface that can be tailored to specific corridors or system wide. Users can look at data each year from 2009 to 2015 on maps, bar charts, and infographics. Archived ADOT FMS data, MAG counts, safety, and private-sector probe data fuel the website. Maryland DOT State Highway Administration Figure 8. Map. Outline of Maryland. The State Highway Administration (SHA) is a transportation business unit of the Maryland DOT that owns and operates the State's the State's highways outside of Baltimore City. SHA's data collection program is comprised of both private-sector and public-sector data to evaluate existing projects and programs and identify short-term and long-term improvements. It applies multiple analysis and visualization tools to inform transportation decision-making and "tell a story" with archived operations data that clearly communicates the need for projects and outcomes of implementation in high-priority locations. Maryland DOT SHA gathers archived operations data from multiple sources:
All of the above-mentioned incident, volume, speed, and ITS device data are fused and archived through the Regional Integrated Transportation Information System (RITIS) and SHA systems. A list of archived operations data types and sources available to SHA are described in Table 5.
Oregon Department of Transportation Figure 9. Map. Outline of Oregon. The Oregon DOT (ODOT) manages over 19,000 lane-miles of highway. Among other ITS equipment, ODOT has deployed over 384 highway cameras, 150 freeway ramp meters, 126 portable message signs, 117 road and weather information stations, and 220 permanent variable message signs.8 Along with the corresponding sensors and support systems, many of these deployments assist ODOT in collecting and using archived operations data. Portland State University (PSU) archives data from ODOT's freeways, including volume, speed, occupancy per lane, and vehicle classification. ODOT recently upgraded its ramp meter firmware and software to collect vehicle classification data by length and speed (four length categories with average speed per category) for all ramp meter locations. In addition, PSU archives all available traffic signal data, including Bluetooth and bus information from the arterials in Oregon, under the Portland Oregon Regional Transportation Archive Listing (PORTAL) effort. ODOT is actively adding new locations to install Bluetooth sensors on arterials and freeways to get a better understanding of travel times on the arterials. Once available, the intent is to archive this data in PORTAL. ODOT has also purchased private sector probe speed data. Table 6 lists the types of archived operations data available for ODOT planning and its sources. PSU manages and conducts all quality control (QC) and quality assurance of the archived data. ODOT has a steering committee to provide oversight for the PORTAL effort. While some of the ODOT data systems have built-in processes that alert ODOT to potential issues (e.g., sensor damaged or not functioning), PSU monitors the quality of the PORTAL data and sends alerts to ODOT when it detects data that may not be accurate (e.g., unrealistic travel speeds).
Obtaining Third-party Data and ToolsThird-party data is becoming increasingly popular among DOTs and MPOs as a way to more economically collect data on a wide geographic scale. Examples of third-party data can include:
The procurement of these data sets can dramatically improve capabilities within an agency, making it easier to measure system-wide performance, identify problems, prioritize projects, and have greater situational awareness. Whenever an agency is considering the procurement of third-party data—whether that be probe-based speed or travel time data, incident and event data, weather data, etc.—the most critical component of any procurement will be contract language controlling acceptable use. Far too often, agencies procure data without specifying terms of use in the request for proposal (RFP). If terms of use are not specified, then the data provider will specify their own terms of use. When this happens, the following can occur:
When developing RFPs, agencies frequently overlook their position of power. If the agency proposes its own desired acceptable use terms, the private-sector data providers will respond and price the data accordingly.  Figure 10. Photo. Interstate highway shield for I-95. Source: Thinkstock/Rex Wholster. The I-95 Corridor Coalition has set a standard for acceptable use when acquiring third-party probe data, and their language could be considered in other State procurements of probe and other data (weather, incident, etc.). A copy of the coalition's data use agreement can be found online (http://i95coalition.org/wp-content/uploads/2015/02/VPPII_DUAv9_signed.pdf?dd650d) and as can a copy of the actual RFP (http://i95coalition.org/wp-content/uploads/2015/02/RFP-83794N-FINAL-2.pdf?dd650d). As archived operations data sets continue to increase in size, quality, and availability, planners are realizing that data alone is not sufficient to spark innovation and use in the planning process. Sophisticated analytics technologies, decision support tools, accessibility mechanisms, or other visualization tools are needed to leverage these archives, understand systems performance, make informed investment choices, and realize the full benefits of these archives. Visualization has far-reaching potential for communicating transportation needs to leaders who must prioritize budgets, enhance the ability of transportation organizations to deliver timely and ever-more complex programs within those budgets, educate the engineers who will make it all happen, and communicate to the traveling public the implications of transportation investments. Numerous archived operations data analytics tools are available today. These tools can be purchased as-is, with existing data already incorporated into them from around the world. They also can be purchased and integrated within an agency's existing archived data sets and can be highly customized to meet agency-specific goals and criteria. Examples of these products include the Iteris Performance Measurement System (iPeMS) suite of products and the University of Maryland Center for Advanced Transportation Technology (CATT) Laboratory's RITIS suite of products. Data Elements Useful for PlanningIntelligent Transportation System Roadway (Point) Detectors: Volume, Speed, and Lane OccupancyITS roadway detectors have been deployed on freeways for several decades. Detectors provide lane-specific measurements of volume, speed, and lane occupancy. The data is transmitted from the field as 20- to 30-second summaries and is archived at levels up to 15 minutes (5-minute aggregations are very common). Detectors are spaced at roughly1/2-mile intervals in dense urban areas and include mainline lanes, as well as HOV and ramp lanes in some systems. A variety of technologies are used to collect the data, including inductance loops, radar, and video image processing, but they all result in the same basic data elements. Speeds are measured over very short distances—the length of the detection zone—so they are essentially "spot" speeds (time mean speeds). The speeds are usually transformed to travel times by assuming a length of highway where the speed is constant, usually half the distance to the next upstream and downstream detectors. On signalized highways, use of data from roadway-based detectors is far less direct. Some detectors are placed at midblock locations (away from signals) and measure the same conditions as freeway detectors. However, midblock speeds are not indicative of signalized highway performance, as the effect of the signals is not included. Probe Detection - Travel TimesToll tag reader and roadway-based vehicle re-identification technologies can provide travel times measured between two fixed points. Global Positioning System (GPS) vehicle re-identification provides travel times between two points in time or instantaneous speeds. These measurements are usually "snapped" to a roadway segment, as vendor-supplied travel time data is. As discussed above, companion volume measurements are not available with these technologies, as only a sample of vehicles are collected. Incident DataIncident characteristics are an extremely important data source for conducting planning analyses. This data describes incident location, characteristics, and the nature of blockages (duration of lane or shoulder blockages). Although incident data is being collected today by transportation and emergency response agencies, complete uniformity has not yet been achieved. In general, the types of data available are shown in Figure 11. 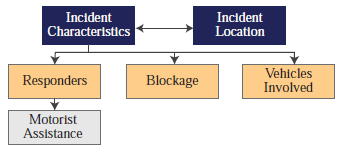 Figure 11. Diagram. Incident data model for performance monitoring.9 Source: Transportation Research Board, National Cooperative Highway Research Program. The most important data elements in these categories are:
The duration of the blockages caused by incidents is the most important piece of information needed for planning applications, but others affect adjacent traffic flow conditions. Also, some incident data may be incomplete, and the type of incident may be used as an indicator of the lane closure impacts (e.g., for data-checking purposes). This data is usually as readily available from databases, especially those that already have incident blockage/duration information; therefore, there is no additional effort involved in assembling this data. Possible sources of data include the following (these are not mutually exclusive, and multiples may be used in combination to feed data into the system):  Figure 12. Photo. Incident clearance. Source: Thinkstock/csakisit.
Work Zone DataFor planning applications, work zone data is useful in understanding congestion patterns and explaining why certain congestion trends emerged. Work zone data is sometimes collected as part of incident data, but also independently by construction and maintenance personnel. Figure 13 shows the basic categories and structure for work zone data. Major types of data on work zone characteristics are lane information, shoulder information, and sign information. For each of those categories, there is data such as lane modification, lane shift, and shoulder restrictions. Work zone characteristics – The actual and planned changes in the roadway environment created by the work zone. These are used to measure the extent of work zones in time (duration) and space (amount of existing highway removed for the work zone) and their impact on safety and mobility. They also can be used in traveler information services to alert motorists to expected work zone conditions. In general, the types of information that should be collected are work zone type, longitudinal characteristics and extent (including details on transition zones and tapers), duration of work zone characteristics, and major cross-section characteristics of the work zone. Both actual and planned changes should be tracked separately. 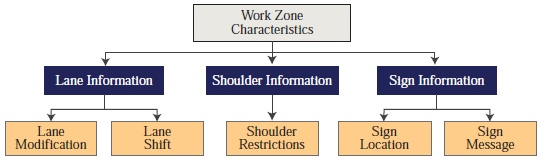 Figure 13. Diagram. Work zone data for planning applications.11 Source: Transportation Research Board, National Cooperative Highway Research Program. Work zone activity – The activities related to traffic management and construction/rehabilitation in a work zone. These are used to assess mobility and safety impacts of traffic control plans and motorist guidance as well as improvements in construction planning and execution. Data includes specifications in traffic control plans, times traffic control plans are in effect, traffic control device placement in the field and times used (e.g., pavement markings, dynamic message signs (DMS) and static signage, positive guidance devices, barriers, and other new technologies), construction and rehabilitation field activities (e.g., crew size by task, task duration, and equipment used on-scene), and time-of-day and where in the work zone the work occurred. This level of detail is usually not necessary for planning applications unless evaluations of work zone management practices are undertaken. Special Event DataThese kinds of events are somewhat different than work zone events in that they occur repeatedly and more often in the same location (e.g., sports stadiums, concert halls). Only a minimum amount of data on special events is required and is used primarily to document surges in traffic volumes:
As with work zone data, special event data is useful in explaining and understanding congestion patterns; that is, continuously collected volume data will detect the volume increases due to special events, but planners will want to tag those surges as special events for performance reporting. Weather DataUnlike volumes, travel times, incidents, and work zones, the vast majority of weather data collection is conducted by non-transportation agencies. There has been limited activity in developing performance measures for weather activities; of those that do exist, they relate to the duration/extent of weather events, weather prediction versus actual weather that materialized, and snow and ice removal activities. However, the influence of weather on traffic flow, safety, and customer satisfaction is substantial. Details on the nature of weather events that influence traffic characteristics, travel decisions by users, and activities by agencies need to be collected:
Signal Control DataThis data includes:
 Figure 14. Photo. Traffic signal. Source: Thinkstock/Carsten Reisinger. For planning applications, signal timing and phasing can be used to set the capacity used in travel demand forecasting (TDF) and mesoscopic simulation models. In addition, recent work has highlighted how data from signals and approaches can be used to develop certain types of arterial performance measures. Day et al. developed an approach based on using high-resolution controller event data.12 They developed a portfolio of performance measures for system maintenance and asset management; signal operations; non-vehicle modes, including pedestrians; and travel time-based performance measures for assessing arterial performance. The focus of this work is clearly on the signal operation and maintenance, but several aspects are of interest to measuring arterial corridor performance. Other Operations Data Useful for EvaluationsPlanners are increasingly relied upon to conduct evaluations of completed projects and new policies. In fact, an ongoing evaluation program is a hallmark of performance management. Several other sources of operations data are available for these evaluations, even if this data is not useful for other traditional planning applications:
Connected Vehicle Data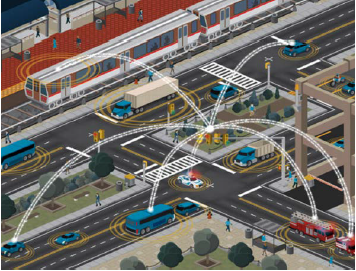 Figure 15. Image. An illustration of interconnected infrastructure. Source: Federal Highway Administration. Data from connected vehicles, once considered a futuristic data source, is now available through both third-party vendors at the national level and from connected-vehicle pilot sites in several States. Presently, at the national level, commercial vehicles rolling off of the assembly line have the ability to provide connected vehicle data in real-time. This can be information about driver behavior and vehicle diagnostics, including:
The same providers also are able to furnish real-time intersection turning movements and near-real-time O-D data in an anonymized way. This real-time operations O-D data reflects actual trip-making patterns between a subset of nodes. At the smallest scale, this data can include turning movements at interchanges. At medium scales, it can track corridor distribution of traffic. At the largest scale, it reflects region-to-region trip demand. Having access to this type of data has significant impacts on real-time operations, but can also have major implications for planners and researchers. Having increased access to O-D data and safety condition information from connected vehicles will enable new safety analytics, new methods of problem identification, and more extensive model validation data sets. Data Sources and Collection Techniques to Ensure Usefulness in PlanningArchived operations data exists at very detailed temporal and spatial scales. Continuous data from ITS roadway detectors can be archived at as low a level as 20-second intervals by lane. Currently, available data from commercial travel time vendors exists at 1- to 5-minute intervals by roadway link. As vendors increase the sophistication of their products, additional detail may become available. Data from traffic signals can include phase-by-phase and, sometimes, second-by-second conditions. Processing this data into a useable form poses several challenges. What levels of aggregation should be used for storing the data? Aggregation is a tradeoff between computational efficiency and storage capacity versus level of detail available for applications. Developers should carefully consider what level of aggregation best balances these tradeoffs. Sound archiving practice suggests that all raw or originally collected data should also be maintained for a period of time, even if it is offline.13 When aggregating for storage, data is often transformed by combining it with other data (e.g., delay is a combination of travel time and demand). For both straight aggregation and transformations, it is useful to document the "lineage" of the data so that users can better understand its structure. This documentation requires that structured metadata be maintained as part of system that houses the data.14 What QC procedures should be used to check the data for accuracy? True QC procedures would be based on comparison to independently collected data, even if it is on an audit basis, as is done for the I-95 Corridor Coalition.15 However, most agencies do not have the resources to conduct continuous data audits, although some limited one-time tests may be conducted. Instead, the majority of QC processing must be done post-hoc with reasonableness checks, comparison to traffic flow theory, and outlier detection. Once potential data errors are detected, it must be decided if the data should be deleted or flagged as erroneous. (Flagging is preferred so as to preserve the original data for other uses.) Then, a decision has to be made if the erroneous data are to be replaced with imputation.16 Imputation carries its own set of issues, and users must decide if imputed data should be used. For example, performance measures that are "counts" or "sums" require complete data for the time period in question (e.g., traffic volume and delay). Other measures, such as speed, may be treated as a sample and computed without imputed data, if users determine a sufficient sample size exists. How should the data be turned into measures? The starting point for developing performance measures for mobility is travel time data. Over the past 15 years, travel time data availability has increased exponentially, starting with data from ITS roadway detectors and continuing to the current generation of vehicle probe data from private vendors. However, none of this data represents directly measured travel times as defined by measuring the passage of individual vehicles as they traverse the network. To create travel times from this data, transformations are required. For roadway detectors and the current generation of privately-supplied vehicle probes, this means assuming that the measurements of speeds apply equally over some distance, usually the length of the reporting segment. Users should be aware that the travel times so created are an approximation of actual travel times. These restrictions do not apply to data collected from individual vehicle probes, such as GPS-equipped "floating cars," roadway systems that measure the passage of individual vehicles via electronic signatures (e.g., Bluetooth readers), and toll tag systems. In the near future, it is expected that directly measured travel times will become available from private sources. As of this writing, some vendors are developing travel times for origin-destination pairs. In the longer term, data from connected or automated vehicles could supply origindestination travel times. As this data becomes available, it should replace the current generation of data used for performance measurement. Until that time, the following guidance is offered. Performance measures and data inputs to models typically are summarized temporally and spatially. For example, mobility performance often is computed for "facilities," usually several miles in length and encompassing several ITS roadway detectors or probe data links. Two methods can be used to compute performance measures on such facilities. The first method computes the measures for each spatial unit, and then combines them to get facility performance (e.g., speed and travel time distributions). The problem posed by this method is that, while it is possible to combine means from links on the facility (the harmonic mean would be used for speed), statistical theory indicates that variances and percentiles cannot be combined because speeds (or travel times) on successive links are correlated.17 The second method is based on first developing travel times (and vehicle miles of travel (VMT) where available) for the entire facility by the temporal level in the original data. The distributions from which measures are produced are then based on the entire facility, not stitched together from its components. Figure 16 presents a graphic summary for how facility travel times are computed from ITS roadway detectors reporting data by individual lanes.18 (Note: A computation procedure for developing the measures using this approach will likely be included in Chapter 24 of the 2016 update to the Highway Capacity Manual (HCM).) 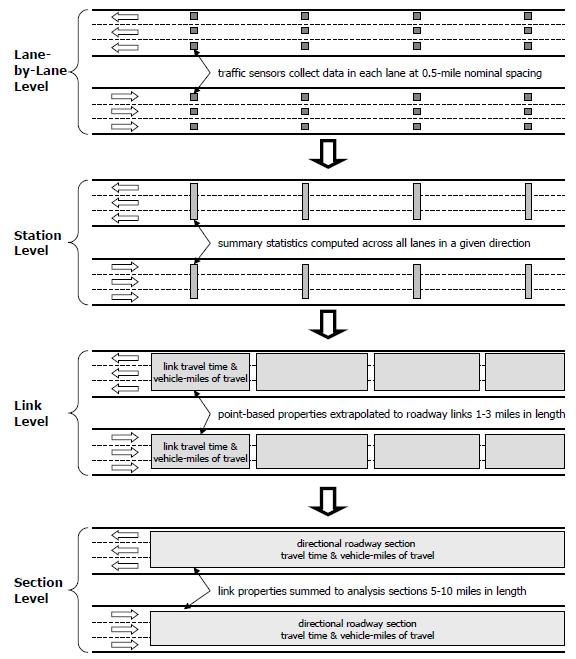 Figure 16. Diagram. Computing facility travel times from intelligent transportation system roadway detectors. Source: Federal Highway Administration. However, the second method is not a complete reflection of travel time conditions on the facility, because it is not based on the actual passage of vehicles over time. That is, it is a single "snapshot" of conditions for a given time period. To more closely replicate true travel times, the "virtual probe" (also known as "vehicle trajectory") method can be used to synthesize travel times. The virtual probe method "traces" the vehicle trip in time and applies the link travel time corresponding to the precise time in which a vehicle is expected to traverse the link. For example, a section travel time that begins at 7:00 AM will use a link travel time for 7:00 to 7:05 at the trip origin, but could use a link travel time from 7:05 to 7:10, or 7:10 to 7:15 at the trip destination. The virtual probe method attempts to more closely model the actual link travel times experienced by motorists as they traverse the freeway system. For relatively short segments, the difference in results of the snapshot versus the virtual probe method is thought to be small. As the length of the facility increases, the differences are exaggerated by the time/space offset. For example, the Florida DOT (FDOT) recently developed a monitoring program for long-distance freight trips in the state based on the trajectory method to address this problem.19 The virtual probe method also can be applied to signalized arterials to develop performance measures from signal system and control data. This data is "event-based," as it relates to either the presence or absence of a vehicle at a point on or near the signal approach, or the status of the signal phasing. Liu et al. used the virtual probe method with both vehicle-actuation and signal phase change data in a synchronized manner.20 This data is time-stamped, thus allowing the reconstruction of the history of traffic signal events along the arterial street. In the simulation, the virtual probe vehicle's trajectory is traced in time and space, and its status at any point in time is dependent on the underlying data. When the vehicle "completes" its trip, total travel time is recorded. In the absence of directly measured travel times and delays, this approach would work for measuring arterial performance. Another major issue in the development of mobility performance measures is developing a complete data set from which to compute the measures. Such a complete set would include simultaneous measurements of both speed (or travel time) and traffic volumes. Volumes are used to compute some measures (VMT and delay) and are used to weight the results for sections with varying amount of traffic. ITS roadway detectors provide this structure, but vendor-supplied vehicle probe data does not; this data should be treated as a sample. As mentioned above in the section, Challenges in Changing Planning Methods and Products, vehicle probe and traffic count data sets are conflated to provide the complete set of data. Conflation brings its own problems, especially when many-to-many spatial relationships require allocation of the traffic data. Further, nearly all traffic counts are daily counts, which have to be decomposed into the time periods represented by the probe data. For this process, default temporal distributions are used that are developed from continuous count stations.21 Data Archives: Implementation Options and Common Mistakes Associated with EachThere are two options from which to choose when deciding how to implement an operations data archive (Figure 17):
In addition, it may be possible to find another agency that is willing to build and deploy the data archive; however, that agency becomes responsible for operations and maintenance moving forward.  Figure 17. Diagram. Operations data archives built in-house or hosted by a third party. Source: University of Maryland CATT Laboratory. There are pros and cons to each of these approaches, some of which may not be obvious at first. In-HouseIf an agency believes it has the capacity and drive to develop, deploy, and host its own archived operations data, then it is important to keep the following in mind:
Costs for databases vary greatly. Licensing of the database engine alone can range from no cost (for open-source database technologies) to several hundred thousand dollars per year. Databases are well suited for storing smaller data sets that are relational in nature. However, with massive amounts of data (hundreds of terabytes, petabytes, etc.), it begins to become quite expensive to implement fast search. To combat these growing costs and the need for speed and failover capabilities, Google developed some algorithms that allowed data to be divided into smaller "chunks" that were mapped to many computers. When calculations needed to be made, the data "chunks" were brought back together and processed rapidly. These algorithms were eventually open sourced and named Hadoop, which is available on many cloud platforms. Many public and private-sector companies have now adopted Hadoop-style technologies. Third-party HostingOften, one or more archives will be implemented through consultant support. This could be as simple as drafting a new task order for an existing ATMS provider, or it may be more complex and involve a new procurement going out to bid. If bidding a new procurement, there are a few things to consider, including:
Common Mistakes: Mistakes made while procuring new data collection systems. When procuring a new system (e.g., ATMS, 511, or other), ensuring the "home" agency has access to and ownership of any data that is created is essential. With software-as-a-service-type contracts for some of these systems, it is not uncommon for commercial off-the-shelf products to claim ownership of all data created in a particular system. This is a particular issue for transit system operators who have purchased systems from third parties. These third parties have historically claimed all of the automated vehicle location (AVL), routing, and other data as "proprietary," and have either refused to allow it to be archived for other agency use or have charged exceedingly high fees to make the data available to other archives and for other use. All agency systems (e.g., ATMS, AVL, 511, CAD, or other) should be capable of sharing, in real-time, all data fields in their database in some sort of data feed to trusted third parties (e.g., other DOTs, public safety agencies, trusted university partners). This includes any device configuration information, lookup codes, incident information, detector data, operator actions, static and dynamic Geographic Information System information (e.g., device locations, mile marker locations, etc.), or video. Making these statements within individual systems procurement documents will assist in avoiding large future expenses or being unable to access data in the desired ways. Data ownership and acceptable use. As mentioned above, it is imperative for an agency to ensure ownership of all data entered into any of its systems. In other words, the agency should ensure that it is freely available to share the data with any third parties it so chooses. The one exception to this requirement is with third-party data that the agency may choose to purchase from a private company (e.g., Waze, SpeedInfo, Traffic.com, INRIX, HERE, TomTom). Whenever possible, the agency should negotiate terms of use for sharing third-party or privately collected data, so that the agency is free to share the data with any other non-commercial entity (e.g., other operational agencies, universities, public safety agencies). For agency-created and -owned data, the agency should always make every effort to be able to share their data with external parties without the need for complex legal agreements. If a data sharing agreement is necessary, the DOT should only reference Federal laws and should remain silent on governing law so that inter-State data sharing will be possible. Persistence of data. All data feeds to an archive should be persistent, such that eventual data delivery to the data archive is guaranteed and no data is lost. Should there be a network connectivity issue or a power failure at the archive, the providing system should continue to hold the data in a queue until such time as the connection can be re-established and all of the data can be sent. 7 Capital District Transportation Committee (CDTC), CDTC Traffic Volume Report Data, September 2011. Available at: http://www.cdtcmpo. org/tvr/tvrdes.htm. [ Return to note 7. ] 8 Oregon Department of Transportation, Key Facts 2012. Available at: https://www.oregon.gov/ODOT/docs/keyfacts_2012.pdf. [ Return to note 8. ] 9 Cambridge Systematics et al., Guide to Effective Freeway Performance Measurement: Final Report and Guidebook, Web-Only Document 97, Transportation Research Board, Washington, D.C., 2006. Available at: http://onlinepubs.trb.org/onlinepubs/nchrp/nchrp_w97.pdf. [ Return to note 9. ] 10 Ideally, blockage is updated every time it changes during a given incident. [ Return to note 10. ] 11 Cambridge Systematics, et al., Guide to Effective Freeway Performance Measurement: Final Report and Guidebook, Web-Only Document 97, Transportation Research Board, Washington, D.C., 2006. Available at: http://onlinepubs.trb.org/onlinepubs/nchrp/nchrp_w97.pdf. [ Return to note 11. ] 12 Day, C.M., E.J. Smaglik, D.M. Bullock, and J.R. Sturdevant, Real-Time Arterial Traffic Signal Performance Measures, Publication FHWA/IN/JTRP-2008/09, Joint Transportation Research Program, Indiana Department of Transportation and Purdue University, West Lafayette, Indiana, 2008. doi: 10.5703/1288284313439. [ Return to note 12. ] 13 As specified in ASTM Standard Guide for Archiving and Retrieving ITS-Generated Data. Available at: http://www.astm.org/Standards/E2259.htm. [ Return to note 13. ] 14 As specified in ASTM Standard Practice for Metadata to Support Archived Data Management Systems. Available at: http://www.astm.org/Standards/E2468.htm. [ Return to note 14. ] 15 Hamedi, M., Haghani, A., Zamir, K., and Wang, Z., I-95 Corridor Coalition Vehicle Probe Project: Validation of HERE Data, Report for North Carolina (#7) US-29 and US-74, February 2016. Available at: http://i95coalition.org/wp-content/uploads/2015/02/I-95-CCValidation_Report-NC07-HERE-FINAL2.pdf?dd650d. [ Return to note 15. ] 16 See Chapter 3 of the Strategic Highway Research Program 2 L02 Final Report. Available at: http://onlinepubs.trb.org/onlinepubs/shrp2/SHRP2_S2-L02-RR-2.pdf. [ Return to note 16. ] 17 A summary discussion and extension of this phenomenon can be found in the Strategic Highway Research Program 2 L04 Final Report. Available at: http://onlinepubs.trb.org/onlinepubs/shrp2/SHRP2_S2-L04-RR-1.pdf. [ Return to note 17. ] 18 Turner, S., R. Margiotta, and T. Lomax, Monitoring Urban Freeways in 2003: Current Conditions and Trends from Archived Operations Data, Report No. FHWA-HOP-05-018, December 2004. Available at: http://mobility.tamu.edu/mmp/FHWA-HOP-05-018/. [ Return to note 18. ] 19 Cambridge Systematics, Inc., Trip-Oriented Mobility Monitoring Framework Development Final Report, Prepared for Florida Department of Transportation, November 5, 2014. Available at: http://floridampms.com/Final%20Reports/Task%2012%20Trip%20Based%20Travel%20Time%20Reliability.docx. [ Return to note 19. ] 20 Liu, H.X., W. Ma, X. Wu, and H. Hu, Development of a Real-Time Arterial Performance Monitoring System Using Traffic Data Available from Existing Signal Systems, Prepared for Minnesota Department of Transportation, December 2008. Available at: http://www.lrrb.org/PDF/200901.pdf. [ Return to note 20. ] 21 See Appendix A of Texas Agricultural and Mechanical University's 2012 Urban Mobility Report. Available at: http://d2dtl5nnlpfr0r.cloudfront.net/tti.tamu.edu/documents/mobility-report-2012-appx-a.pdf. [ Return to note 21. ] | |||||||||||||||||||||||||||||||||||||||||||||||||||||||||||||||||||||||||||||||||||||||||||||||||||||||
|
United States Department of Transportation - Federal Highway Administration |
||