Travel and Emissions Impacts of Highway Operations Strategies
Chapter 3. Atlanta Case Study: Demand Effects of Operational Improvements
Purpose of The Case Study Analysis
Several previous studies of the effect of transportation improvements on induced demand undertook an empirical approach that considered time series data on facilities or on an areawide basis; Cervero provides a summary of these and other types of study designs used to examine induced demand. (Cervero, Robert, Induced Travel Demand: Research Design, Empirical Evidence, and Normative Policies, Journal of Planning Literature, Vol. 17, No. 1, August 2002.) Facility-based studies most commonly track changes in demand over time in relation to the physical expansion of the facility, as measured in lane-miles. The concept is that increasing capacity (lane-miles) leads to a decrease in travel time, which in turn effects both short- and long-term demand changes. However, due to do data limitations in the past, the size of the actual travel time change is not monitored over time, and lane-miles is used as a surrogate (indicator) variable. Further, no previous studies have considered the effect of operational strategies on induced demand, with the exception of NCHRP Report 535, but the strategies covered there were land additions (general purpose and high-occupancy vehicle), access management, intersection channelization, and signal timing. Clearly, the state of the operations practice has advanced to include other forms of operations that need to be addressed.
This analysis was undertaken to address both of these issues using the Atlanta, Georgia region as a case study. It is based on using demand measurements from several sources (mostly continuous) and continuous travel time measurements. It considers three types of operational strategies limited to urban interstates in the Atlanta region:
- Ramp metering.
- Routine incident management and dynamic message signs (DMS).
- Travel times posted on DMSs.
- Quick clearance incentive program for large truck incidents.
Background
Operations in the Atlanta Region
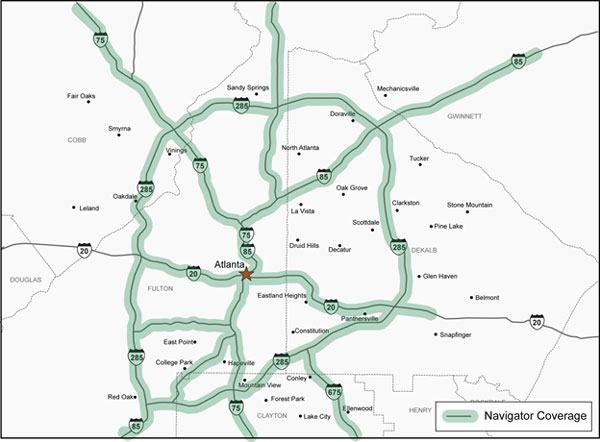
Operations on Atlanta freeways is controlled by the Georgia Department of Transportation (GDOT) under its NaviGAtor program. It was first activated in April 1996, just before the 1996 Summer Olympics in Atlanta. It includes traffic cameras, dynamic message signs, ramp meters, and a traffic speed sensor system. A highly structured incident management program, Highway Emergency Response Operator (HERO), has evolved as well and is coordinated with other NaviGAtor activities. As of early 2011, 508 directional miles (approximately 254 centerline miles) of freeways in the Atlanta region were covered by cameras and traffic sensors. Figure 12 shows this coverage.
Figure 12. Map. Atlanta NaviGAtor Coverage, 2011.
(Source: Georgia Department of Transportation.)
Study Period and Study Sections
The study period is from 2001 (the first year for which archived data from the NaviGAtor system is available) to 2010. Only nonholiday weekdays were analyzed. Study periods were defined to represent “extended peak periods” in order to capture queuing and trips that may have been diverted in time. The AM period was 6:00 to 11:00 a.m. and the PM period was 3:00 to 8:00 p.m. The analysis was done for each direction individually, so directions of travel were defined as peaking in either the AM or PM periods.
A wide array of study sections was defined to include both study and control/regional sections. A study section is defined as a unidirectional highway segment approximately 4-6 miles long, except the I-85 study sections which are 9.8 miles long. The exact length depends on the network typology and local travel patterns. For example, a major freeway-to-freeway interchange should be located at the terminus of a segment, not in the middle. The treatment sections used in the analysis are defined as following:
- 1 = I-75 NB from I-285 to Roswell Rd (5.19 miles).
- 2 = I-75 SB from I-285 to Roswell Rd (5.19 miles).
- 5 = I-285 EB from GA-400 to I-75 (6.50 miles).
- 6 = I-285 WB from GA-400 to I-75 (6.50 miles).
- 7 = I-285 EB from GA-400 to I-85 (6.03 miles).
- 8 = I-285 WB from GA-400 to I-85 (6.03 miles).
- 9 = I-75 NB from Roswell Rd to Barrett Pkwy (5.18 miles).
- 10 = I-75 SB from Roswell Rd to Barrett Pkwy (5.18 miles).
- 11 = I 85 NB after Brookwood Split to I-285 (9.80 miles).
- 12 = I 85 SB after Brookwood Split to I-285 (9.80 miles).
Two comparison groups were formed: a control group which included locations where ramp metering had not been installed as of mid-2010, and a regional group which included all of the control sites plus other locations around the area which did receive ramp metering prior to 2010.
Highway Improvements During the Study Period
- Freeway Ramp Metering Project. GDOT began a regional freeway ramp metering program in early 2008. The goal of the program is to provide ramp meters on most all freeway entrance ramps in the 10 county Atlanta Region, freeway-to-freeway ramps are not planned to be metered. Currently there are 169 interchanges metered. GDOT is continuing to add meters to the program. Since mid-2009, the ramp meters have been upgraded and are running as traffic responsive devices, allowing each meter to respond to local traffic conditions on the ramp and interstate based on ramp and mainline detection. The meters are still operating in an isolated manner and have no coordination with other ramps in the system. Future planned upgrades will deploy the SWARM software that will allow the ramp meters to be operated in groups, allowing for a systemwide response to traffic conditions. On all study sections, ramp meter installation was completed by September 2008.
- Towing Recovery and Incentive Program (TRIP). GDOT introduced TRIP in early 2008 to provide monetary incentives to qualified towing operators for the quick clearance of large commercial vehicle incidents. This program is a critical component of the metropolitan Atlanta traffic incident management quick clearance program. TRIP incidents involve large vehicles and complicated debris or hazardous material (HAZMAT) spills, which would normally take a significant amount of time to clear from a roadway. TRIP can only be activated by designated personnel, such as a GDOT Highway Emergency Response Operator (HERO) supervisor or a police officer on-scene, based upon specific criteria and procedures. Once declared a TRIP incident, the designated TRIP company for that area is notified. The TRIP company supervisor must arrive on scene within 30 minutes of notification and all basic equipment must arrive within 45 minutes if called between 5:30 a.m. and 7:00 p.m., Monday through Friday; at other times, the equipment is allowed 60 minutes to arrive. The TRIP company remains on scene until they receive an official notice to proceed to clear the incident from the roadway. Upon receiving the notice to proceed, the TRIP company must have the roadway cleared and open to traffic within 90 minutes. When the program began in 2008 it covered I-285 and all interstates inside I-285. The coverage boundaries were expanded in June 2009 and again in April 2010.
- Expected Travel Times on DMS Displays. Beginning in 2008, GDOT began posting expected travel times to recognizable destinations on their DMSs.
- Capital Expansion. A limited amount of lane additions were conducted on the study and control sections during the study period. The major project was a re-design of the “Downtown Connector” from 2007 to 2009 (Chapters 3 and 4) and for his reason they have been excluded from this analysis. The other noteworthy capital expansion project was the addition of auxiliary lanes on I-75 north of its interchange with I-285 in 2004 (Chapters 1 and 2).
Table 10 shows the deployment of operations strategies on the sections by year. Note that the study sections have had multiple treatments, making it impossible to break out the effect of individual strategies. However, as operations strategies usually have much smaller congestion relief impacts than capital expansion, having multiple treatments makes it more likely that the effect can be observed. The deployment of operations strategies on the control segments is less than ideal – it would be best if they had received no operational treatment. As discussed in the next section, for this and other reasons, additional control sections for demand were selected using the automatic traffic recorder (ATR) data.
Table 10. Deployment of operational strategies on Atlanta study sections.
| Section Nos. |
Ramp Meters |
Towing Recovery and Incentive Program (TRIP) |
Travel Times on Dynamic Message Signs |
Routine Incident Management |
| Treatment – 1/2 |
mid-2008 |
2009 |
2008 |
2000 |
| Treatment – 5/6 |
mid-2008 |
early 2008 |
2008 |
2000 |
| Treatment – 7/8 |
mid-2008 |
early 2008 |
2008 |
2000 |
| Treatment – 9/10 |
mid-2008 |
2009 |
2008 |
2000 |
| Treatment – I-85 Study Sections |
 |
|
|
|
| Control/Regional – 21 |
2011 |
2010 |
2008 |
2000 |
| Control/Regional – 23/24 |
2011 |
2010 |
2008 |
2000 |
| Control/Regional – 31 |
(none) |
2010 |
2008 |
2000 |
| Control/Regional – 32/33 |
2010 |
2010 |
2008 |
2000 |
| Control/Regional – 34/35 |
2010 |
2010 |
2008 |
2000 |
Data Sources
NaviGAtor Data
The Atlanta Region has been collecting detector data, including speed and volumes, since the Summer Olympics in 1996. The original archiving was at 15-minute intervals, and during the summer of 2007, the archiving interval was changed to 5-minute. The data are speed, volume, and lane occupancy measurements taken at very closely spaced (1/3 to 1/2-mile) intervals. From the speed measurements, travel times are computed for the entire section, and from there a variety of travel time-based performance metrics can be computed, including reliability metrics because the data are continuously collected.
ATR Data
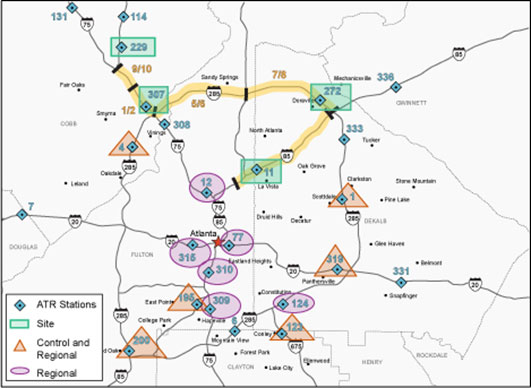
State DOTs maintain continuously operating traffic count devices at fixed locations around their states for a variety of purposes. These data are reported to FHWA monthly and serve as the basis for the Traffic Volume Trends report. Data are reported as hourly volumes by lane at the ATR locations. Data for Georgia was obtained from FHWA for this study. ATR data are available for the 2000-2010 period, but there is inconsistency in the years present at different stations. Only a few stations have data for all 11 years, and there are many more stations for the 2007-2010 period as GDOT increased their traffic counting activity. Figure 13 shows the location of the urban interstate ATRs that were used in the Atlanta analysis.
Figure 13. Urban Interstate ATRs in the Atlanta region.
(Source: Cambridge Systematics, Inc.)
Results
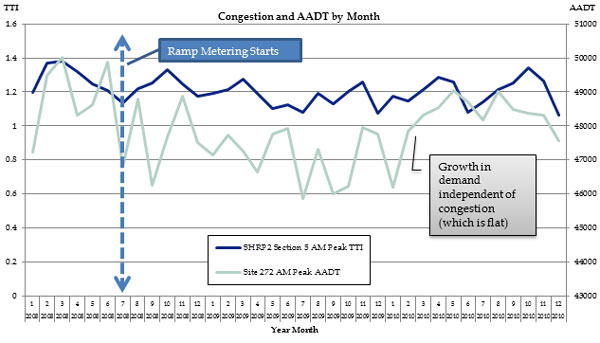
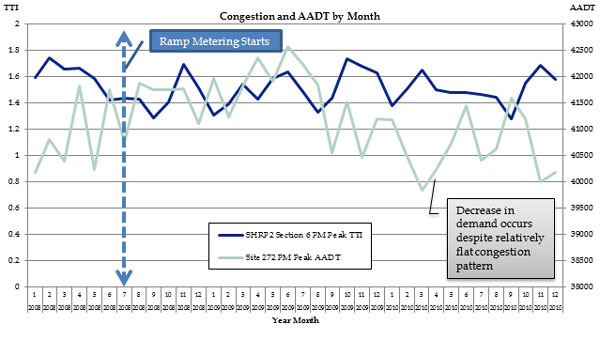
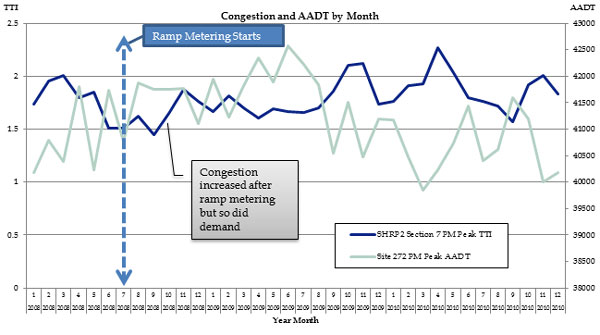
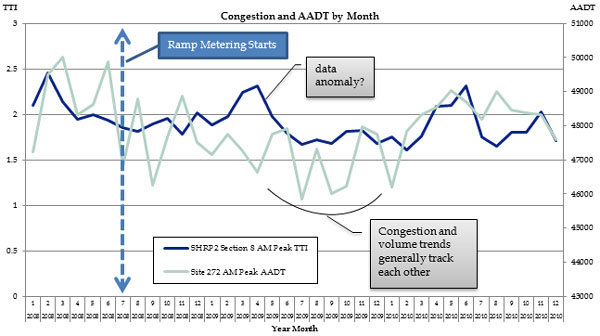
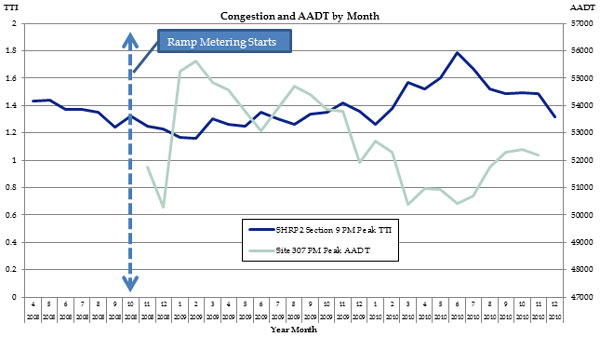
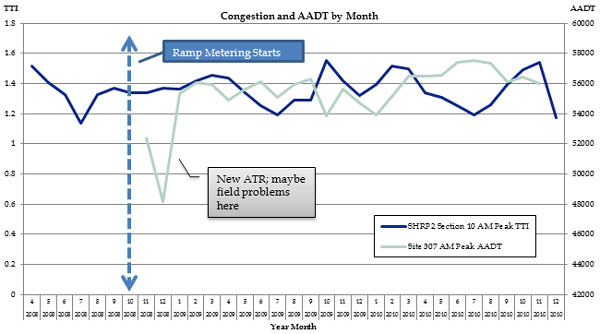
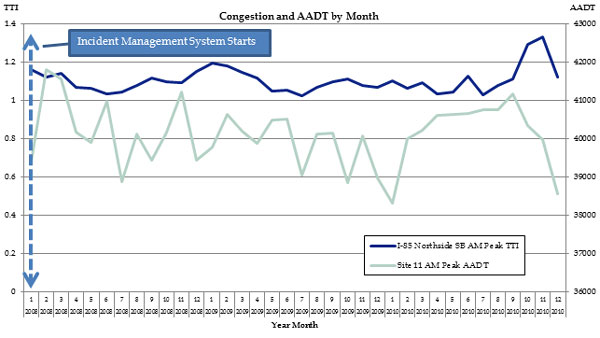
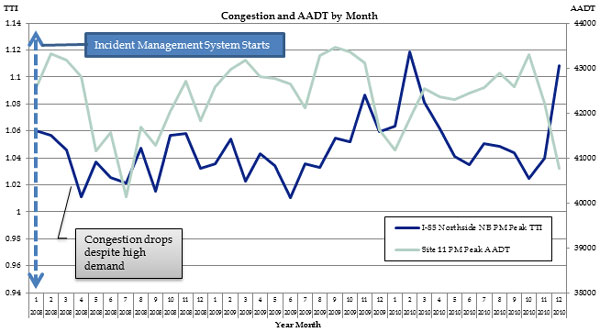
Table 11 shows the growth in congestion level, as measured by the TTI, and demand, as measured by the peak period AADT; the first two quarters of 2008 and 2010 are averaged for this comparison to smooth the data. Table 12 shows a summary of the quarterly volume trend results, Figure 14 through Figure 23 show the quarterly volume (demand) patterns, and Figure 14 through Figure 23 show the congestion trends. Note that the plots show the growth in demand from the previous quarter. Therefore, all comparisons must be made relative to the zero percent line. For example, if growth in one quarter is negative, a rising trend from this quarter to the next may still represent negative growth if it does not cross the zero percent line. Table 13 through 17 show the net growths in demand over the entire before and after periods. Figure 14 through Figure 23 show monthly congestion and volume statistics for each site.
For context, regional VMT for freeways and arterials fluctuated over the period for the before/after studies, based on data from Texas A&M’s Urban Mobility Study:
- 2006 – 92,685
- 2007 – 92,630
- 2008 – 88,500
- 2009 – 89,373
- 2010 – 91,511
The effect of the economic downturn can be seen in the 4.7 percent decrease from 2006 to 2008. Then, VMT in the subsequent recovery increased by 3.4 percent from 2008 to 2010.
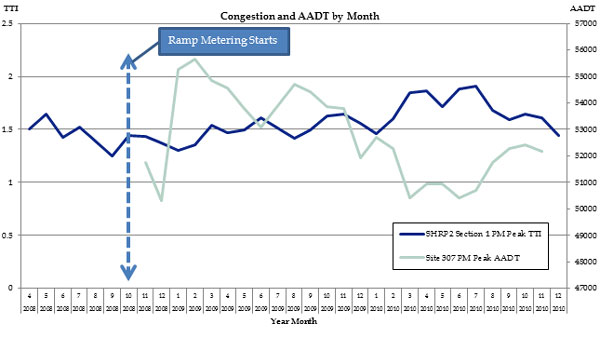
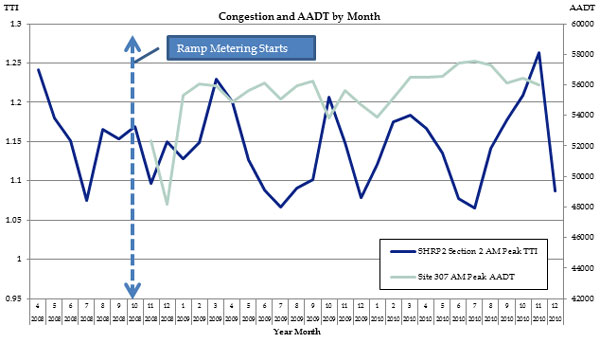
The two types of operations treatments studied – ramp metering and towing incentives – were implemented at various times during 2008; these are indicated on the plots. Table 11 provides a synopsis of the volume and congestion plots. Several observations can be made about these results:
- As measured on a quarterly basis (Table 11 and Figure 14 through Figure 23), ramp metering and the large truck towing incentive program have only a small effect on congestion levels at best, and in many instances, no discernible impact was detected, especially when factoring in changes in demand over the same period. It should be pointed out that the treatment sites are all on highway sections that are routinely moderately to severely congested, and this may be limiting the ramp meters’ effectiveness. (Once traffic flow has broken down, ramp meters become largely ineffective.)
- When the before/after treatment conditions are measured on a monthly basis (Figure 14 through Figure 23), in most cases, the effect of ramp metering on congestion is positive over the first few months after implementation, i.e., congestion was reduced slightly.
- Demand at the treatment sites appears to be most heavily influenced by regional trends, rather than anything specific to the site. The fact that demand patterns at the treatment sites follow the same pattern as for the region in all but a few cases is evidence of this.
- In cases where ramp metering and towing incentives appear to have a discernible impact on congestion trends, the effect is small and demand does not appear to respond to the small change in congestion.
Table 11. Change in Congestion Level and Demand on Study Sections
|
Percent Change, 1st Two Quarters 2008 versus 1st Two Quarters 2010 – TTI |
Percent Change, 1st Two Quarters 2008 versus 1st Two Quarters 2010 – Peak AADT |
| AM Peak – Regional |
-2.6% |
+0.2% |
AM Peak – I-85 between GA-400 and I-285 (towing incentive program)
ATR Site 11 |
+7.7% |
+2.0% |
AM Peak – I-75 between Roswell Road and Barrett Parkway
ATR Site 229/SHRP Section 10 |
-5.0% |
-3.8% |
AM Peak – I-285 between GA-400 and I-285
ATR Site 272/SHRP Section 8 |
-4.5% |
-0.5% |
AM Peak – I-75 from I-285 to Roswell Road
ATR Site 307/SHRP Section 2 |
+2.0% |
-3.0% |
AM Peak – I-285 between I-75 and GA-400
ATR Site 272/SHRP Section 5 |
+3.5% |
-1.7% |
| PM Peak – Regional |
+4.4% |
+1.4% |
PM Peak – I-85 between GA-400 and I-285 (towing incentive program)
ATR Site 11 |
+5.9% |
-3.4% |
PM Peak – I-75 between Roswell Road and Barrett Parkway
ATR Site 229/SHRP Section 9 |
0.0% |
+0.4% |
PM Peak – I-285 between GA-400 and I-285
ATR Site 272/SHRP Section 7 |
0.2% |
-1.7% |
PM Peak – I-75 from I-285 to Roswell Road
ATR Site 307/SHRP Section 1 |
-1.9% |
+2.4% |
PM Peak – I-285 between I-75 and GA-400
ATR Site 272/SHRP Section 6 |
+1.7% |
-0.5% |
Table 12. Change in Congestion Level and Demand on Study Sections
|
Short-Term Effects (12 months) |
Long-Term Effects (see also Table 13) |
AM Peak –I-85 between GA-400 and I-285 (towing incentive program)
ATR Site 11 |
Congestion Impacts: 10 percent drop in first quarter then slight increases, mirror control, and regional growths.
Demand Changes: Demand growth was slightly negative in first two quarters, then slightly positive, generally follows control and regional trends.
Minimal effect on congestion; no effect on demand. |
Congestion Impacts: Little distinction from control and regional trends.
Demand Changes: Change in generally flat over the period; mirrors control and regional patterns but shows less quarter to quarter volatility.
Minimal effect on congestion; no effect on demand. |
AM Peak – I-75 between Roswell Road and Barrett Parkway
ATR Site 229/SHRP Section 10 |
Congestion Impacts: Small increase in congestion in the first quarter, then a decrease which follows control and regional trends.
Demand Changes: First quarter data unavailable; second quarter slightly positive, third quarter slightly negative, mirrors control, and regional patterns.
Minimal effect on congestion; no effect on demand. |
Congestion Impacts: Erratic quarter-to-quarter growth rates; fourth quarter of every year shows positive congestion growth; pattern similar to control and regional growths.
Demand Changes: Relatively flat (some small positive, some small negative growths); control and regional growths much higher.
Minimal effect on congestion; no effect on demand. |
AM Peak – I-285 between GA-400 and I-285
ATR Site 272/SHRP Section 8 |
Congestion Impacts: Small increase in first quarter followed by small decreases in second and third quarters follow control and regional patterns.
Demand Changes: Change in demand slightly positive over the three quarters while control and regional growths are slightly negative.
Minimal effect on congestion; no effect on demand. |
Congestion Impacts: Not assessed; likely data problems.
Demand Changes: Growth is positive but not as high and control and regional growths. |
AM Peak – I-75 from I-285 to Roswell Road
ATR Site 307/SHRP Section 2 |
Congestion Impacts: Small increase in first quarter, then moderate decreases in second and third quarters; second and third quarter mirror control and regional growths.
Demand Changes: Flat growth mirrors control and regional growths.
Small positive effect on congestion; no effect on demand |
Congestion Impacts: Small net increase versus flat growth for control and regional sites.
Demand Changes: Relatively flat growth is less than either he control or regional growths.
Minimal effect on congestion; no effect on demand. |
AM Peak – I-285 between I-75 and GA-400
ATR Site 272/SHRP Section 5 |
Congestion Impacts: Sharp increase in first quarter, sharp decreases in second and third quarters; patterns mirrors control and regional growths, but decreases are higher.
Demand Changes: Change in demand slightly positive over the three quarters while control and regional growths are slightly negative.
Small positive effect on congestion; small increase in demand. |
Congestion Impacts: Small net growth is similar to control and regional growths.
Demand Changes: Growth is positive but not as high and control and regional growths.
Minimal effect on congestion; no effect on demand. |
PM Peak – I-85 between GA-400 and I-285 (towing incentive program)
ATR Site 11 |
Congestion Impacts: Congestion decreased in first quarter (same for control and regional), then was flat while control and regional were positive.
Demand Changes: Decrease in first two quarters; slight increase in third quarter; closely mirrors control and regional growths.
Small impact on congestion; no impact on demand. |
Congestion Impacts: Congestion growth is mostly flat, but there appears to be a sharp increase everywhere in the third quarter of 2011.
Demand Changes: Small net decrease in demand, while control and regional sections showed an increase.
Minimal Effect on congestion; no increase in demand. |
PM Peak – I-75 between Roswell Road and Barrett Parkway
ATR Site 229/SHRP Section 9 |
Congestion Impacts: Increase in first quarter then large decreases in second and third quarters, roughly follows control and regional patterns.
Demand Changes: Slight increase in second quarter, slight decrease in third quarter, follows control and regional patterns.
Minimal effect on congestion; no effect on demand. |
Congestion Impacts: Not assessed; likely data problems.
Demand Changes: Relatively flat growth over the period roughly the same as for control and regional sites. |
PM Peak – I-285 between GA-400 and I-285
ATR Site 272/SHRP Section 7 |
Congestion Impacts: Large increase in first quarter followed by flat growth follows regional pattern exactly.
Demand Changes: Growth is flat, which is less than either control or regional patterns.
Minimal effect on congestion; no effect on demand. |
Congestion Impacts: Very volatile; possible data problems in late 2010; prior to that, growth is positive and higher than control and regional sites.
Demand Changes: Demand growth is slightly negative, roughly the same as regional sites.
Minimal effect on congestion; no effect on demand. |
PM Peak – I-75 from I-285 to Roswell Road
ATR Site 307/SHRP Section 1 |
Congestion Impacts: Decrease in first two quarters, then sharp increase in third quarter (may be data error); does not follow control or regional patterns.
Demand Changes: Small decrease in second quarter, small increase in third quarter.
Assuming third quarter congestion value is an error, small positive effect on congestion, no effect on demand. |
Congestion Impacts: Erratic growth is highly positive until last quarter of 2010 and does not follow control or regional trends.
Demand Changes: Relatively flat growth over the period mirrors control and regional growths.
No apparent impact of ramp meters over the period. High levels of congestion appear to be suppressing volume growth. |
PM Peak – I-285 between I-75 and GA-400
ATR Site 272/SHRP Section 6 |
Congestion Impacts: Erratic congestion growth, may indicate data problems.
Demand Changes: Growth is flat, which is less than either control or regional patterns. |
Congestion Impacts: Erratic congestion growth, may indicate data problems.
Demand Changes: Demand growth is slightly negative, roughly the same as regional sites. |
Table 13. Summary of Before/After Volume Trends at ATR Site 11.
| Site |
AM/PM |
Net Volume Growth – Before (Q1/2007 to Q4/2007) |
Net Volume Growth – Growth Percent |
Net Volume Growth – After (Q1/2008 to Q4/2010) |
Net Volume Growth – Growth Percent |
| 11 |
a.m. |
41496 to 39752 |
-4.20% |
40924 to 39612 |
-3.21% |
| Control |
a.m. |
25256 to 21472 |
-14.98% |
20552 to 21314 |
3.71% |
| Regional |
a.m. |
28457 to 25928 |
-8.89% |
24929 to 25764 |
3.35% |
| 11 |
p.m. |
43876 to 41816 |
-4.70% |
43012 to 42098 |
-2.12% |
| Control |
p.m. |
28106 to 23642 |
-15.88% |
22944 to 23876 |
4.06% |
| Regional |
p.m. |
32874 to 29107 |
-11.46% |
27928 to 28952 |
3.66% |
Table 14. Summary of Before/After Volume Trends at ATR Site 229.
| Site |
AM/PM |
Net Volume Growth – Before (No Data) |
Net Volume Growth – Growth Percent |
Net Volume Growth – After (Q3/2009 to Q4/2010) |
Net Volume Growth – Growth Percent |
| 229 |
a.m. |
|
|
39771 to 39612 |
-0.40% |
| Control |
a.m. |
|
|
19371 to 21314 |
10.03% |
| Regional |
a.m. |
|
|
24648 to 25764 |
4.53% |
| 229 |
p.m. |
|
|
42949 to 42098 |
-1.98% |
| Control |
p.m. |
|
|
23150 to 23876 |
3.14% |
| Regional |
p.m. |
|
|
28266 to 28952 |
2.43% |
Table 15. Summary of Before/After Volume Trends at ATR Site 272.
| Site |
AM/PM |
Net Volume Growth – Before (Q4/2007 to Q2/2008) |
Net Volume Growth – Growth Percent |
Net Volume Growth – After (Q3/2008 to Q4/2010) |
Net Volume Growth – Growth Percent |
| 272 |
a.m. |
49005 to 48932 |
-0.15% |
47280 to 48093 |
1.72% |
| Control |
a.m. |
21472 to 20383 |
-5.07% |
19568 to 21314 |
8.93% |
| Regional |
a.m. |
25928 to 24648 |
-4.94% |
24382 to 25764 |
5.67% |
| 272 |
p.m. |
39435 to 41261 |
4.63% |
41463 to 40461 |
-2.42% |
| Control |
p.m. |
23642 to 22919 |
-3.06% |
22350 to 23876 |
6.83% |
| Regional |
p.m. |
29107 to 27331 |
-6.10% |
26928 to 28952 |
7.52% |
Table 16. Summary of Before/After Volume Trends at ATR Site 307.
| Site |
AM/PM |
Net Volume Growth – Before (No data) |
Net Volume Growth – Growth Percent |
Net Volume Growth – After (Q1/2009 to Q4/2010) |
Net Volume Growth – Growth Percent |
| 307 |
a.m. |
|
|
55772 to 56211 |
0.79% |
| Control |
a.m. |
|
|
19762 to 21314 |
7.85% |
| Regional |
a.m. |
|
|
24696 to 25764 |
4.33% |
| 307 |
p.m. |
|
|
55245 to 52292 |
-5.35% |
| Control |
p.m. |
|
|
23196 to 23876 |
2.93% |
| Regional |
p.m. |
|
|
28419 to 28952 |
1.87% |
Table 17. Summary of Before/After Volume Trends at ATR Site 308.
| Site |
AM/PM |
Net Volume Growth – Before (No Data) |
Net Volume Growth – Growth Percent |
Net Volume Growth – After (Q1/2009 to Q4/2010) |
Net Volume Growth – Growth Percent |
| 308 |
a.m. |
|
|
34903 to 35378 |
1.36% |
| Control |
a.m. |
|
|
19762 to 21314 |
7.85% |
| Regional |
a.m. |
|
|
24696 to 25764 |
4.33% |
| 308 |
p.m. |
|
|
35841 to 34139 |
-4.75% |
| Control |
p.m. |
|
|
23196 to 23876 |
2.93% |
| Regional |
p.m. |
|
|
28419 to 28952 |
1.87% |
Figure 14. Graph. SHRP Section 1.0, PM peak.
(Source: Cambridge Systematics, Inc.)
Figure 15. Graph. SHRP Section 2.0, AM peak.
(Source: Cambridge Systematics, Inc.)
Figure 16. Graph. SHRP Section 5.0, AM peak.
(Source: Cambridge Systematics, Inc.)
Figure 17. Graph. SHRP Section 6.0, PM peak.
(Source: Cambridge Systematics, Inc.)
Figure 18. Graph. SHRP Section 7.0, PM peak.
(Source: Cambridge Systematics, Inc.)
Figure 19. Graph. SHRP Section 8.0, AM peak.
(Source: Cambridge Systematics, Inc.)
Figure 20. Graph. SHRP Section 9.0, PM peak.
(Source: Cambridge Systematics, Inc.)
Figure 21. Graph. SHRP Section 10, AM peak.
(Source: Cambridge Systematics, Inc.)
Figure 22. Graph. I-85 Northside SB, AM peak.
(Source: Cambridge Systematics, Inc.)
Figure 23. Graph. I-85 Northside NB, PM peak.
(Source: Cambridge Systematics, Inc.)
Discussion
This case study used the data from the Atlanta region to determine if the deployment of operations strategies led to an induced demand effect during the 2000 to 2010 period. The analysis is complicated by several factors. The first is the sharp drop in demand and associated congestion levels in 2008 due to the economic recession – the drop makes it difficult to establish any long-term montonic trends. The second issue is that the majority of operations strategies (ramp meters, towing incentives, and traveler information) were deployed toward the end of the period (2007-2008) limiting any conclusions about the very long term (land use/location decisions) induced demand effect; such components of induced demand require a five-year “incubation” period. Third, data consistency was an issue in the analysis. Ideally, just the NaviGAtor detector data would supply all of the required data but previous experience indicated that volumes estimates from this source can be unreliable. HPMS data was examined to provide regional VMT trends but it was found to be unreliable for the years before 2007. The ATR data proved to be more trustworthy, but prior to 2007 the number of ATRs in the Atlanta region was sparse. Also, the coverage of ATRs is limited, requiring in most cases to use ATRs that are nearby the treatment sections but not located on them (except for Sites 7 and 8). Not having demand and congestion estimates exactly paired – as could be achieved if the NaviGAtor volume data were more reliable – introduces uncertainty into the section-level analysis.
Between 2002 and 2007, PM congestion grew by 12 percent, total daily demand (AADT) grew by 11 percent and PM demand grew by 9 percent. During this period there was little change in the physical capacity on the study sections, and GDOT’s operations included incident management and traveler information (DMSs and Internet-based travel time postings). Without considering the congestion data, one might conclude that the operational improvements contributed to the increased demand. However, it is clear that over the 2000-2007 period, the limited operational improvements (routine incident management and DMSs) did not lead to a net decrease in travel times over multiple years, which would be required if the induced demand effect was present. Rather, the operational improvements most likely limited the growth in congestion that otherwise might have occurred. While the study did not assess the effectiveness of these strategies (in terms of what would have happened without them, a task that would require modeling), a 10 percent increase demand, when imposed on an already congested peak network, would lead to much more than a 12 percent increase in congestion; congestion expands exponentially with demand under already congested conditions.
For the period of more intensive operational deployments (2008-2010), the section-level analysis indicates that the AM and PM peak periods behave differently. Sites that peak in the morning generally saw both a decrease in demand and congestion. Sites that peak in the afternoon generally saw both demand and congestion increase. Other studies of the Atlanta ramp metering and towing recovery programs, which considered a much smaller timeframe showed positive impacts. (Evaluation of the Towing and Recovery Incentive Program (TRIP), PBS&J and Serco, February 4, 2011.) However, in terms of longer-range impacts, congestion growth seems inevitable in cases where background demand is strong, even with the presence of operational strategies.
It is clear that the growth in both demand and congestion proceeded even with these operational deployments made. Further, demand increased even in the face of increased congestion – no significant suppression effect was observed. This indicates that factors driving regional growth are dominant over traveler behavioral effects related to travel time. Therefore, at least for the 2000-2007 period in Atlanta, the effect of operations was to manage the growth of congestion, not eliminate it.
The results found here are short term in nature. In some locations, there was no noticeable improvement in travel times due to an operations strategy, so we cannot expect there to be short-term demand shifts. In locations where travel time was improved, no appreciable increase in short-term demand was observed.
While it is not possible to say conclusively that long-term demand effects would be comparable, we note that longer-term matched-pair studies in the literature also found no measurable demand effects at the facility level. In his 2001 review of induced demand, Cervero wrote (Cervero, Robert, Induced Demand: An Urban and Metropolitan Perspective, paper prepared for: Policy Forum: Working Together to Address Induced Demand, March 2001.):
A fairly rigorous matched-pair analysis in Melbourne, Australia recorded no induced travel over a 10-year period as a consequence of linking a major freeway to a major arterial (Luk and Chung, 1997). (Luk, J. and Chung, E. 1997. Induced Demand and Road An Initial Appraisal. Research Report, ARR 299. Vermont South, Victoria, Australia: ARRB Transport Research Ltd.) A recent matched-pair comparison of 18 California State highway segments over the 1976 to 1996 period also found little evidence of induced demand (Mokhtarian et al., 2000). (Mokhtarian, P., Samaniego, F., Shumway, R., Willits, N., and Azari, R. 2000. Analyzing Induced Traffic from Capacity Enhancements Using Matched Pairs: A California Study. Davis: University of California, Institute of Transportation Studies, draft paper.) The study found statistically and practically indistinguishable differences in ADT growth rates between improved and unimproved segments.
You may need the Adobe® Reader® to view the PDFs on this page.



