Guide for Highway Capacity and Operations Analysis of Active Transportation and Demand Management Strategies
6 Example Applications
This chapter describes several example applications of the ATDM Analysis method to the estimation of annual facility performance.
The first part of the example application is devoted to establishing the baseline, before ATDM conditions. The example then proceeds to test three ATDM investment strategies: convert an HOV Lane to HOT (with congestion pricing), install dynamic ramp metering, and implement a recurring congestion TDM program with a targeted incident-based TDM program.
The example applications described here do not illustrate the computation of long-term demand effects.
6.1 Before ATDM Analysis
The first phase of an ATDM investment analysis is the “before” ATDM analysis. This phase of the analysis establishes the scenarios against which ATDM will be tested and sets the baseline against which the benefits of ATDM investments will be evaluated.
Step 1 – Preparation
This step involves determining the study purpose, approach, and scope, as well as gathering the data needed for the ATDM analysis.
Establish Purpose and Approach
The selected study freeway currently experiences relatively little recurrent congestion, but it is operating very close to the margin. Work zones, weather, and incidents can have significant effects on congestion. The left most lane is currently dedicated to HOV 2+ during the weekday PM peak periods. The HOV lane is currently slightly underutilized, carrying at most 1,350 vehicles per hour.
The agency wishes to determine if ATDM strategies might be employed to take advantage of the spare capacity in the HOV lane during weather, work zone, and incident events and thereby better optimize facility productivity.
The purpose of the analysis is to determine which ATDM investments will be cost-effective for addressing nonrecurring congestion on the facility. The approach will be to perform a Highway Capacity Manual (HCM)-based analysis, because at this early investment decision-making stage, it is not necessary to identify specific operating parameters for ATDM, such as the precise ramp metering rates, or the wording of the messages to be delivered as part of an ATDM-driven 511.org traveler information system.
Set Geographic and Temporal Scope
The selected study site is a 7.6-mile-long section of three-lane freeway in one direction with 5 on-ramps and 4 off-ramps, as shown schematically in Figure 9.
Figure 9: Example Application Study Site
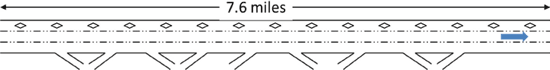
Source: Cambridge Systematics, Inc.
The selected study period is the 4-hour weekday PM peak period. The selected reliability reporting period is all weekday PM peak periods within a calendar year, excluding 10 holidays. Thus the reliability reporting period is 250 weekdays of the year.
Data Collection
Data is assembled for the selected study facility and time period for a traditional HCM freeway facility analysis (this HCM data becomes the “seed file” for the reliability analysis and generation of scenarios). Data is then assembled on the day-to-day variability of demand, the historic frequencies of adverse weather, the frequencies of incidents and crashes, and the frequencies of work zones by type.
Seed File Data
The ATDM Analysis method requires that sufficient data for a single day’s study period be gathered to code and calibrate the selected core HCM analysis tool. For this example the HCM 2010 FREEVAL-ATDM spreadsheet program was selected as the core analysis tool. Required data is geometry and 15-minute ramp and mainline counts for the 4-hour study period. 16 unique spreadsheets representing each of the analysis periods and containing the geometry and count information for that period, would need to be populated.
Table 18 shows the geometric and demand data for the first 15-minute analysis period within the selected 4-hour study period. The geometry and other parameters (such as percent trucks) are identical in this example for all analysis periods. Although not shown, mainline and ramp demands are assumed to increase 10% in each analysis period following the first analysis period. Starting with the ninth analysis period the mainline and ramp demands decrease 10% from the previous analysis period. Demand is shown in vehicles per hour (vph).
Demand Variability Data
A nearby permanent count station on the facility was queried to obtain the variation in weekday demands over the course of a year. The resulting demands were compared to the seed file demands and the adjustment factors and probabilities were obtained. The results are shown in Table 19.
Weather Data
Weather data for the past 3 years was obtained for a nearby weather station. The data was aggregated into HCM weather types. Probabilities were computed for the weekday PM peak period. Capacity adjustment factors were obtained from the HCM 2010. Free-Flow Speed adjustment factors were obtained from the SHRP 2-L08 research, (Publication of the final report is pending). Demand was assumed to be unaffected by weather for this example problem. The resulting data are shown in Table 20.
Incident Data
Incident data for the past 3 years was obtained from facility incident logs. The log incident types were converted to HCM incident types and the frequencies converted into probabilities. The capacity adjustments were obtained from the HCM 2010. Free-flow speed adjustments were assumed to be equal to the capacity adjustments. Demand was assumed to be unaffected by incidents. The resulting data are shown in Table 21.
Note: Data for Analysis Period #1 shown. Other analysis periods identical, except for volumes. Volumes increase 10% each analysis period between AP #1 and AP #8 (inclusive). Volumes decrease 10% each analysis period between analysis periods #8 and #16.
Note: The seed file demands are 2.3% higher than the average demands for the year.
Work Zone Data
Work zone types and probabilities for the study section of freeway were obtained by consulting with agency engineers. The capacity adjustments were obtained from the HCM 2010. Free-flow speed adjustments were assumed to be equal to the capacity adjustments. Demand was assumed to be unaffected by incidents. The resulting data are shown in Table 22.
Step 2 – Generate Scenarios
The seven possible levels of demand, the 16 weather types, the 13 incident types, and the 7 work zone types are combined into 10,192 possible scenarios for analysis. The probability of any given scenario is estimated by multiplying together the probabilities of the individual types and demand levels. From these 10,192 possible scenarios, 30 scenarios are selected for detailed analysis of the effectiveness of the proposed ATDM strategies. Since the objective of the ATDM analysis is to estimate the benefits of the different ATDM strategies for a representative cross-section of possible demand, weather, incident, and work zone conditions, a targeted selection of scenarios is selected representing possible combinations of demand weather, incidents, and work zones.
Since the total number of scenarios must be kept to 30 (due to effort involved in designing custom ATDM strategy responses for each scenario), the following sampling scheme is employed for selecting the 30 scenarios:
- Three demand levels (low, medium, high)
- Three weather types (clear, medium rain, light snow)
- Two incident types (no incident, property damage only crash blocking one lane)
- Two work zone types (No work zone, Long-Term maintaining 3 lanes open)
This selection results in 36 possible combinations (3x3x2x2), so some possible combinations will have to be excluded. After considering the relative probabilities and taking into account that the ATDM strategies to be evaluated do not involve snow strategies, the possible combination of property damage only crashes with light snow will not be evaluated.
The final 30 scenarios selected for ATDM analysis are listed in Table 22. Note that the total probability of these particular 30 scenarios is slightly under 9% (see “Initial Probability” column). The HCM analysis results for these 30 scenarios must be weighted to obtain total annual performance over the reliability reporting period for the facility. On the assumption that we have selected an unbiased sample, in light of our objective of evaluating the benefits of ATDM investments, the scenario probabilities will be proportionally increased until they sum to 100%. The final probabilities are shown in the right most column of Table 22.
Step 3 – Apply Operations Analysis Tool (Before)
Once the 30 scenarios have been selected, the next step is to input the scenario-specific demand, free-flow speed, and capacity adjustment factors into the selected HCM analysis tool (in this case, FREEVAL-ATDM). Lane closure data for incidents and work zones is also input. The HCM analysis tool is applied 30 times.
Special Note on Analysis of Freeway Facilities with HOV Lanes
At this point in time, the 2010 HCM does not yet incorporate HOV lane analysis capabilities. The recently completed NCHRP 3-96 research project should address this capability, when it is incorporated into the next update of the 2010 HCM. In the interim, an approximate procedure is used in this example problem to evaluate freeway operations with an HOV lane present.
The HOV lane is assumed to be continuously accessible (thus enabling the standard HCM 2010 freeway analysis procedure to be employed with some modest modifications). The total capacity of the three-lane freeway cross section is the weighted average of the capacity of the HOV lane and the other two mixed-flow lanes. Based on the NCHRP 3-96 research, the capacity of the HOV lane is estimated to be nominally 1,800 vehicles per hour per lane. This capacity is compared to the maximum demand for the HOV lane (in terms of eligible HOVs plus violators) and the lower of the two values is used for the HOV lane in the computation of the mixed average capacity across all three lanes for the freeway.
Step 4 – Compute MOEs (Before ATDM)
The resulting “before” ATDM analysis output is shown in Table 22 for the specific scenarios. A summary of the results is provided in Table 24. The mean PM peak period speed on the facility varies from 16 to 64 mph, depending on the scenario. The average annual speed on the facility for the PM peak period is 43 mph.
The facility is unable to serve all of the VMT demand, but the shortfall is less than one hundredth of 1%.
The Planning Time Index (the 95th percentile travel time index) is 3.92, indicating that travelers on the facility must allow for travel times in excess of 3.9 times their normal free-flow travel time to be 95% confident of arriving on time.
Check for Congestion Spill Over
Approximately 9% of the probability is associated with scenarios with over 80% of the 15-minute analysis periods at LOS F. Approximately 7% of the probability is associated with scenarios with maximum queue lengths in excess of 6 miles (facility length is 7.6 miles). This suggests that there is a chance that queue overflows may occur about 7% to 9% of the time.
The congestion overflow, although mostly for low-probability scenarios may result in an underestimation of the delays for the before condition. This means that the benefits of ATDM may be underestimated when compared to this baseline before condition. A conservative underestimation of the benefits of ATDM may be acceptable, especially if subsequent analysis indicates that the benefits of ATDM are sufficient to support a decision to invest in ATDM. Thus, no correction for congestion spill over (beyond the time limits and geographic limits of the study section) will be applied at this time. If subsequent results are so close that such a correction would be deemed necessary to establish the benefits of the ATDM investments, the preferred approach would be to expand the geographic and temporal limits of the analysis.
Note: PDO = property damage only crash
Note: TTI = travel time index, ratio of travel time to free-flow travel time
6.2 Example #1 – Convert HOV to HOT Lane
In this example the first component of an overall ATDM investment plan will be examined, namely congestion pricing.
Step 5 – Design ATDM Strategy
Examination of the “before” results determined that congestion regularly occurs at medium to high demand levels (with or without incidents) and suggests that there might be spare capacity in the HOV that could be used during periods of high congestion or incidents. The maximum HOV demand is 1,350 vph compared to a target capacity of 1,600 vph for a HOT lane. Therefore the first component of the ATDM program that will be evaluated is conversion of the HOV lane to a HOT lane with dynamic congestion responsive tolling.
With dynamic congestion pricing, the assumption is that the toll for the HOT lane will be set as low or as high as necessary to fill the HOT lane to its target operating capacity of 1,600 vph. Allowing for some hysteresis the tolling/demand cycle, it will be assumed that a target maximum volume of 1,500 vph will be achieved.
Step 6 – Convert Strategy into Ops Inputs
At this point in time, the 2010 HCM does not yet incorporate HOT lane analysis capabilities. The recently completed NCHRP 3-96 research project should address this capability, when it is incorporated into the next update of the 2010 HCM. In the interim, an approximate procedure is used in this example problem to evaluate freeway operations with a HOT lane present.
The HOT lane is assumed to be continuously accessible (thus enabling the standard HCM 2010 freeway analysis procedure to be employed with some modest modifications). The total capacity of the three-lane freeway cross section is the weighted average of the capacity of the HOT lane and the other two mixed-flow lanes. The policy operating capacity of the HOT lane is set at 1,600 vehicles per hour per lane. This capacity is discounted to 1,500 vph to allow for some inefficiencies in the toll setting process.
Step 7 –Apply Operations Analysis Tool (“After” Condition)
The scenario-specific capacity adjustment factors for the conversion from HOV to HOT lanes are input into the selected HCM analysis tool (in this case, FREEVAL-ATDM). The HCM analysis tool is reapplied to the original 30 scenarios, but this time with capacity adjustment factors tailored to HOT lane operation rather than HOV lane.
Step 8 – Compute MOEs (Opening Day)
The scenario-specific results are presented in Table 26. The summary MOEs are presented in Table 27.
Converting the HOV lane to HOT lane operation results in a 7% reduction in annual vehicle-hours traveled, a 22% reduction in annual vehicle hours of delay and a 7% increase in mean speed on the facility during the PM peak period. The average delay per mile is reduced 22% and the Planning Time Index is decreased by 16%.
The HOT lane enables the freeway to serve 100% of the VMT demand.
The improvements are greatest where the greatest congestion was present in the before conditions, however; all scenarios see better performance with the HOT lane.
Check for Congestion Spill Over
The maximum reported queues are 6.06 miles, which is less than the 7.6-mile length of the facility. The percent of 15-minute analysis periods with LOS F is 94% or less. The two scenarios with these statistics account for 4 tenths of one percent of the probability covered by the 30 scenarios, so if there are queue overflows in these two scenarios, they are likely to have little effects on the overall results.
6.3 Example #2 – Dynamic Ramp Metering
While the HOT lane has relieved recurring congestion for the low and medium demand levels, there is still significant congestion on the facility during incidents, adverse weather, and for high demand days (with or without incidents or bad weather). The next ATDM strategy to test is the addition of dynamic ramp metering to the ATDM strategy of converting the HOV lane to a HOT lane. The dynamic ramp metering would be sensitive to expected and unexpected varying demand and capacity conditions on the freeway.
Step 6 – Convert Strategy into Ops Inputs
Locally optimal dynamic ramp metering is emulated in the HCM analysis tool by comparing the predicted total demand (ramp plus mainline) for the on-ramp merge section to the target maximum desirable flow rate for the freeway (for this example the target is set at 2,100 vehicles per hour per lane). The difference between the target merge section volume and the upstream freeway mainline input volume is the ramp metering rate, subject to certain constraints.
- The maximum ramp metering rate is set at 900 vph/lane.
- The minimum ramp metering rate is set as 240 vph/lane.
- If, during the course of the analysis, the number of vehicles stored on the ramp hits 40, then the meter rate is set to the maximum rate until the queue drops below 40 vehicles.
Unlike for HOT lane analysis where the capacity adjustments applied to the entire study period (for each scenario), the dynamic ramp metering analysis is repeated for each ramp for each 15-minute analysis period within each scenario. The computed ramp rates become the ramp capacities input into the HCM analysis tool.
The capacities of the ramp merge sections are increased by 3% to account for the capacity increasing effects of ramp metering. This value must be determined by the user. A value of 3% was chosen here based on recent research.
Examination of the seed file ramp volumes suggested that single-lane metered on-ramps would be inadequate to accommodate the expected ramp demands under medium demand conditions. Consequently it was judged that the ramps would have to be expanded to two metered lanes each, for metering to work on this facility. This assumes that a second metered lane could be added on this specific facility.
Step 7 –Apply Operations Analysis Tool (“After” Condition)
The scenario-specific capacity adjustment factors for the conversion from HOV to HOT lanes and the application of dynamic ramp metering are input into the selected HCM analysis tool (in this case, FREEVAL-ATDM). The HCM analysis tool is reapplied to the original 30 scenarios, but this time with capacity adjustment factors tailored to HOT lane operation and dynamic ramp metering.
Step 8 – Compute MOEs (“After” Condition)
The scenario-specific results are presented in Table 28. The summary MOEs are presented in Table 29.
Adding locally optimal dynamic ramp metering to HOT lane operation results in an additional 5% reduction in annual vehicle-hours traveled, an additional 18% reduction in annual vehicle hours of delay and an additional 5% increase in mean speed on the facility during the PM peak period. The average delay per mile is reduced 18% (compared to the HOT lane alone) and the Planning Time Index is decreased by 12% (compared to the HOT lane alone).
When multiple ATDM strategies are studied, the analyst may want to isolate the effects of individual strategies. The only realistic way is to do this is to run each strategy individually as some of the effects may be masked when multiple strategies are analyzed together.
Check for Congestion Spill Over
Since the chances of congestion spill over were judged to be minor in the previous example, and the current example further reduces congestion on the freeway mainline, congestion spill over is not considered a significant concern in this example.
6.4 Example #3 – Incident TDM
While the combination of a HOT lane with dynamic ramp metering has relieved recurring congestion for the low, medium, and high demand levels, there is still significant congestion on the facility during incidents. The next ATDM strategy to test is the addition of recurring and incident-specific TDM to dynamic ramp metering and the HOT lane. The TDM program will be designed to be most effective for incidents.
Step 6 – Convert Strategy into Ops Inputs
Various TDM strategies are considered for reducing recurring demand. A program of strategies that increase as demand increases is adopted. For example, a special program to contact cooperative major employers in the area is put in place for activation when PM peak period demand levels are expected to be greater than normal. (Such a program might allow early release of employees so that demand in the peak is “smoothed.”) Based on an independent assessment of the likely effects on facility demand, it is estimated that this program will reduce freeway demands by 1% for low demand levels, 2% for medium demand levels, and by 4% for high demand levels.
A TDM plan for dealing with incidents is developed that provides basic information for property damage only crashes and noncrash incidents. Major employer participation and information dissemination is ramped up when major injury or fatal accidents occur on the facility. Due to the longer durations of fatal and injury crashes, it is expected that the Incident TDM program will be more effective for those types of crashes than for property damage only crashes or other noncrash incidents. An independent assessment estimates that the incident TDM program will reduce freeway facility demands by 10% for fatal and injury crashes, and by 5% for property damage only and noncrash incidents.
Step 7 –Apply Operations Analysis Tool (“After” Condition)
The scenario-specific demand adjustment factors are input into the selected HCM analysis tool (in this case, FREEVAL-ATDM). The HCM analysis tool is reapplied to the original 30 scenarios, but this time with demand adjustment factors tailored to HOT lane operation and dynamic ramp metering.
Step 8a – Compute MOEs (“After” Condition)
The scenario-specific results are presented in Table 30. The summary MOEs are presented in Table 31.
Adding recurring TDM plus incident-specific TDM to locally optimal dynamic ramp metering and HOT lane operation results in an additional 10% reduction in annual vehicle-hours traveled, an additional 35% reduction in annual vehicle hours of delay and an additional 7% increase in mean speed on the facility during the PM peak period. The average delay per mile is reduced 33% (compared to the HOT lane and metering) and the Planning Time Index is decreased by 18% (compared to the HOT lane and metering without TDM).
Overall VMT demand for the freeway is reduced 2% by the recurring and TDM programs.
Check for Congestion Spill Over
Since the chances of congestion spill over were judged to be minor in the previous example, and the current example further reduces congestion on the freeway mainline, congestion spill over is not considered a significant concern in this example.
Step 8b – Combined Effects of ATDM Investments (“After” Condition)
The combined effects of investing in a HOT lane, dynamic locally optimal ramp metering, a TDM program to address recurring congestion, and an incident-specific supplemental TDM program are shown in Table 32.
The planned ATDM investments are estimated to reduce delay by 48%, increase mean speeds by 23%, and improve reliability by reducing the planning time index for the facility by 35%.
Note: VMT = vehicle-miles traveled
previous | next