SIGNAL TIMING UNDER SATURATED CONDITIONS
2. The State of the Practice
Categorizing Congestion Based on Operational Objectives
Identifying strategies for mitigating the effects of saturated signal approaches requires an understanding of the objective of operational decisions. These objectives vary with conditions, though this variation is rarely articulated by practitioners or used in recommendations to practitioners. They are, however, implicit in the decisions made by practitioners.
Over the history of the practice, methods that have received wide use already distinguish between a range of objectives in signal control. For example, a traditional approach for calculating cycle length at isolated intersections, first taught at the Yale Bureau of Highway Traffic, determines the expected arrival platoon at a signal using the Poisson distribution. This method assumes independence between arriving cars and thus is only valid at low arrival flows. It identifies the arrivals during a cycle that will only be exceeded 5% of the time, and then provides green time sufficient for those arrivals. The objective of this function is to serve 95% of the arriving platoons, which stated another way is to minimize cycle failures. Cycle failures occur when the waiting queue is not fully served by the next green interval.
At some point, minimizing cycle failures becomes an unattainable objective. The Poisson method will drive up the cycle length, with the result that the longer red times will create longer queues to serve, which drives up the cycle even more. In the Poisson method, one iterates to find a cycle at which all the 95%-ile arrivals can be served, but those iterations fail when traffic demand reaches moderate amounts. And at those demand levels, the assumptions underlying the Poisson method are no longer valid, in that the cars are no longer behaving independently and the Poisson distribution no longer describes their arrivals.
During such conditions, most practitioners switch to a method that seeks to achieve smooth flow consistent with driver expectations. This objective may be explicitly represented by minimizing delay, stops, or some combination of the two. Delay and stop minimization is a different objective than minimizing cycle failures, because at some point serving a long departing queue causes more delay on the competing movements than it saves on the approach being served. Most traffic signal timing tools currently available seek to minimize some combination of stops and delay.
Some tools use degree of saturation on the approach as a surrogate for stops and delay. For example, the Highway Capacity Manual is based on the fundamental relationship of G/C*S, where G/C is the ratio of green time to cycle length and S is the saturation flow. This approach seeks to define the capacity of the approach, and signal timing based on this approach attempts to balance the saturation of each movement. The objective is therefore to minimize the difference in the degree of saturation for the various approaches at an intersection, and those variations are a negative performance measure within that approach.
PASSER II has as its main optimization objective signal progression along an arterial street (more on that below), but it seeks to balance the degree of saturation at each intersection to optimize splits. Both are closely related to Critical Lane Analysis, which first appeared in TRB Circular 212, Interim Materials on Highway Capacity. This approach explicitly does not minimize delay. For example, if an intersection with four approaches is served by a two-phase signal, and three of the approaches each serve 1000 cars while the fourth only serves 100 cars, balancing the degree of saturation will result in equal green times for the two intersecting roadways, assuming no left turns. But when the street carrying 1000 cars in one direction and 100 cars in the other direction is green, only 1100 cars are being served, while 2000 cars are being delayed. Minimizing delay would provide close to two-thirds of the cycle to the street with two 1000-car/hour approaches, and one third to the street carrying only 1100 cars. This approach might, however, cause congestion on the 1000-car/hour approach that is opposing the light movement.
Within coordinated systems, optimization approaches consistent with achieving smooth flow optimize to minimize delay and stops in the network or to optimize a specific smooth-flow objective, such as progression. Progression is the ability of cars to pass through a series of coordinated signals without being stopped by a red signal. All such opportunities form a band that is the portion of the cycle during which vehicles traveling at the desired speed can achieve progression through the intersections in question. As mentioned previously, PASSER II explicitly maximizes bandwidth when determining the coordination between intersections and the phase sequence at each intersection. The splits at each intersection are determined to provide balanced saturation, however.
Optimizations that seek to minimize delay and stops, maximize progression, or balance the degree of saturation, fail when an approach becomes congested. The reason is that neither delay nor saturation can be evaluated during congestion, and progression cannot be achieved through a standing queue. Saturation is limited by the capacity of the signal, and when the capacity is exceeded, saturation no longer characterizes demand. Delay equations are indefinable in congested conditions because the delay increases as long as the demand exceeds capacity. Delay equations require a stable relationship between vehicles arriving to be served and those departing, having been served. When the system is storing more and more cars because of a capacity constraint, delay will continue to increase for the subsequently arriving vehicles.
Thus, an important question is determining at what point a practitioner should change objectives from attempting to achieve smooth flow to strategies defined specifically for congested conditions, when smooth flow is impossible.
It should be noted that the boundary between shifting objectives is not fixed, and the operation can cross the boundary as a result of what practitioners do. Thus, one critical strategy apparent in the case studies is to avoid inducing congestion when smooth flow is still attainable.
This chapter discusses a series of case studies and a series of interviews with practitioners in the context of these objectives. These case studies will be evaluated on the basis of which objective was being attempted, and whether the results of those attempts were successful. Several of the case studies show the progression from smooth-flow strategies that failed to congestion strategies.
In addition to identifying strategies by their objectives, the cases studies and interviews in this chapter will be used to catalog a series of action points to reveal when a change in strategies might be critical. These action points are closely related to the definition of saturated conditions.
NCHRP 3-38(4) attempted to define saturated conditions as follows:
- Local congestion. This occurs when one or more approaches faces a cycle failure that does not result in damaging or excessive queues.
- Extended congestion. Cycle failures repeat such that queues extend damagingly through upstream intersections, causing the capacity of those intersections to be reduced.
- Regional congestion. This occurs when the queue from a critical intersection joins or influences the queues at upstream critical intersections. In other words, the queuing from one critical intersection imposes a cascading capacity constraint on other intersections which were at the saturation point even without the influence of the spreading queue.
- Intermittent congestion. This occurs as a natural result of stochastic traffic arrival. Even at light volumes timed using the Poisson method, one expects cycle failures 5% of the time. McShane and Roess, in Traffic Engineering, demonstrate this using a diagram similar to Figure 2-1. They describe this as a brief period of congestion in an otherwise stable traffic stream. Distinguishing between intermittent and prolonged congestion will likely affect the selection of responses, and thus is an important distinction to be made.
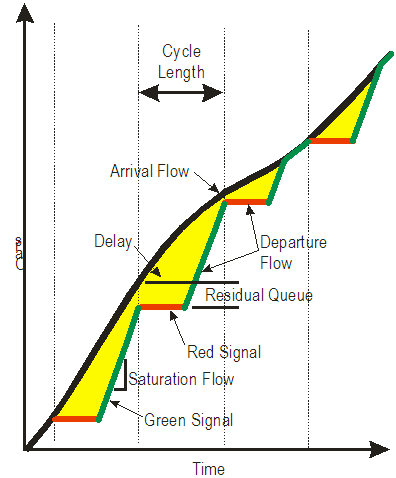
Figure 2-1. A repeat of Figure G-1. Figure II-1 is a graph that shows cars with respect to time. Arriving flow is shown as a curve, with the slope of the curve indicating flow. Departing flows are shown as zero during the redn intervals and as saturation flow during the green intervals. Where the departure flow catches up to the arriving flow, the departure flow follows the arriving flow. The area between these curves characterizes intersection delay.
Figure 2-1. Intermittent congestion in stable traffic stream
- Recursive (cyclical) congestion. This is congestion at an intersection with insufficient capacity that occurs predictably as a result of foreseeable demand patterns.
- Prolonged congestion. Congestion in the network is relentless and queue interactions create such inefficiencies that demand must fall well below the reduced capacity for extended periods to permit residual queues to clear.
These definitions served the purpose of that research but are not necessarily clearly related to actions that practitioners would take. A useful feature of these definitions is that it distinguishes between occasional cycle failures that will be present even in moderate traffic conditions and the sort of building residual queues that compel action by the practitioner. One problem is that the order in which they are presented do not provide a clear hierarchy of severity, nor do they clearly suggest to the practitioner to change objectives. A review of the NCHRP 3-38(4) work suggests that these categories were define mostly to link to specific traffic signal system control strategies, not all of which are currently relevant.
Also, the conditions described in NCHRP 3-38(4) are closely related to coordinated signal timing, while the purpose of this research is to explore intersection-based strategies.
Thus, these levels can be simplified, providing a hierarchy of conditions keyed to action levels:
- Light traffic Characterized by the expectation of minimized cycle failures. The objective in these conditions is to fully serve arrival queues. Cycle failures are expected to be infrequent at less than 5%.
- Moderate traffic Characterized by the expectation of "fair" operation. At these intersections, drivers expect the operation to be "fair", which usually means that the objective should be both obvious (or easily explained) and equitable. Progression in a network falls into this category, as does minimizing delay and stops, or balancing the degree of saturation on each approach. Some cycle failures are to be expected in meeting these other objectives and do not necessarily violate the expectations of motorists.
- Heavy traffic Characterized by frequent cycle failures, but with a residual queue that ebbs and flows without growing uncontrollably. The queue is the result of stochastic arrival flows where those flows exceed capacity up to about half the time.
- Oversaturated operation Characterized either by excessive residual queues that grow (seemingly at least) without control, or by queues that cause more widespread damage to the operation of a network. It is no longer possible to determine what percentage of the arrival flows can be served, because they usually do not reach the intersection during the green interval that might serve them.
These approaches can be characterized graphically, as shown in Figure 2-2.
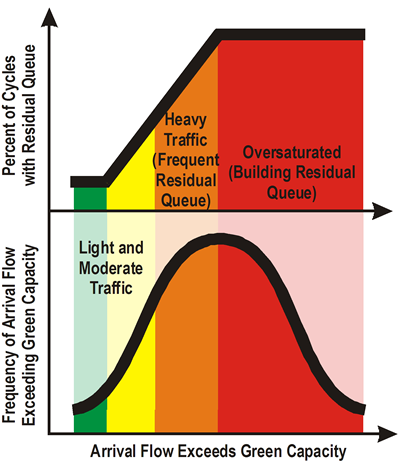
Figure 2-2. Figure showing that light and moderate traffic rarely provides successive cycles where demand exceeds green capacity, but that in heavy traffic that is still less than routinely calculated capacity, the frequency and probability of success cycles failures grows significantly. When demand exceeds capacity, the probability of arrival flow exceeding green capacity is 100%. The diagram is illustrative only and is not intended to be quantitative.
Figure 2-2. Saturation and Residual Queues
Figure 2-2 is not intended to represent actual statistics, but rather to illustrate that when average demand equals approach capacity, the percent of cycles with residual queuing will be 100%. In fact, it is likely that residual queuing is a certainty even when average demand is somewhat less than capacity. When average demand exceeds capacity, a growing residual queue is inevitable.
In addition to describing the conditions at which certain actions and objectives are compelled, the case studies and interviews reveal those actions. Of particular importance is determining whether the actions taken are intended to be curative or palliative. In the medical world, doctors treat patients with the objective of achieving a cure. When a cure is not possible, then they treat terminally ill patients with the objective of minimizing pain and suffering.
The initial expectation of the research is that actions taken to alleviate congestion are appropriate under heavy traffic conditions as described above, and are curative. The objective is to maximize throughput in order to minimize or eliminate residual queues. And if these actions fail, one expects that the objective will shift to minimizing the damage of queue formation to the extent possible, which is palliative. The analysis of the example applications and interview responses will be to determine the accuracy of these expectations.
Example Applications
Example 1. Square Lake Road at Telegraph Road, Oakland County, Michigan
In this case study, the wide median of the Michigan "boulevard" prevented normal opposing left turns. Left turners first turn right and then U-turn to complete their maneuver. Thus, left turners approach the traffic signal twice.
Before improvements were made, the operation started with westbound green and a green for the signalized U-turn. This provided uninterrupted flow for left turners to first turn right and then make their U-turn. After a period of time, the U-turners were stopped to allow the southbound through movement to proceed up to the intersection. That southbound movement then received a green signal at the intersection.
Finally, the southbound movement was stopped at the U-turn to allow remaining U-turners to make their U-turn and still be able to go through the intersection with a southbound green signal.
In terms of its operational effect, this sequence first allowed left turners to turn right and then U-turn to then store in the southbound intersection approach. The southbound movement at the U-turn then turned green to serve southbound through cars. This condition prevailed for a while until the southbound movement at the intersection received a green. Thus, the operation was intended to provide southbound progression primarily, and depended on relatively small volumes making the right-turn-U-turn sequence of maneuvers. The problem was that the volume of U-turners increased to the point that it filled up the southbound approach at the intersection, which caused the queue to block the progression for southbound through cars. The southbound approach became congested, and the operation favored those making the left-turn maneuver at the expense of the southbound maneuver.
The objective of the before condition was to provide smooth flow for the southbound through movement, but that objective was thwarted by congestion from the oversaturated southbound approach and the queue formation from U-turners.
To minimize the problem, staff at the Road Commission for Oakland County altered the sequence. The altered sequence started by providing an open southbound green at both the U-turn and the intersection. This prevented the queue from the U-turn from blocking southbound through cars. After the southbound movement was served, the sequence served the U-turn.
The objective of the altered operation is to manage queue spillback to prevent the queue from a relatively unimportant movement from blocking a relatively important movement.
The sequence of movements that provided the most effective queue management is shown in Figure 2-3.
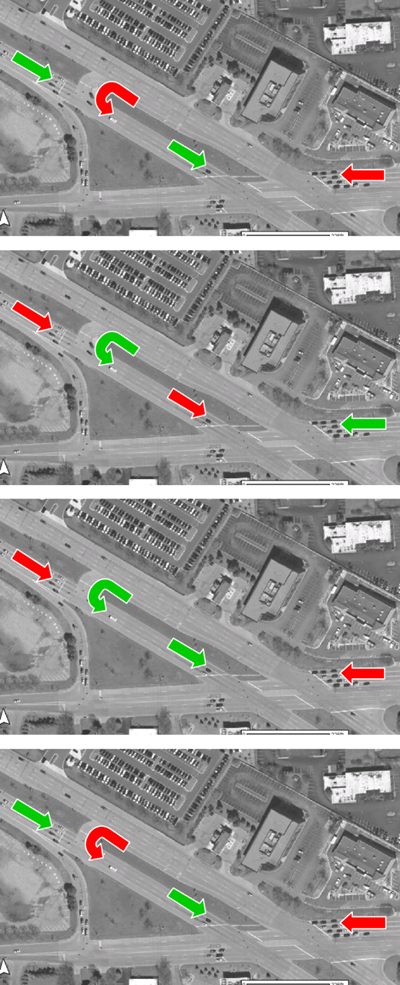
Figure 2-3. Sequence of four diagrams showing signal sequence at Square Lake road and Telegraph Road in Oakland County, Michigan. The intersection is an east-west boulevard that requires left-turners to turn right and then make a U-turn on the north-south crossing street. The U-turn is signalized. First interval: Green southbound at U-turn and boulevard. Second: Green westbound boulevard and U-turn. Third: Green for the U-turn and the southound through movement at the boulevard. Fourth sequence is the same as the first, with green for all southbound movements.
Figure 2-3. Signal Sequence for Queue Management, Square Lake Road and Telegraph Road.
Example 2. Sunrise Boulevard, Rancho Cordova, California
This congested corridor extends a little less than three miles through 11 signalized intersections from White Rock Road to Gold Country Boulevard, as shown in Figure 2-4. Traffic volumes on Sunrise increase from 1500 vph at the south end to 5000 vph at the north end in the peak direction. Sunrise Boulevard carries 80,000 vehicles per day on three basic lanes in each direction.
In the PM peak, demand exceeds capacity at the three northernmost intersections. Queue formation extends back from the first of these intersection upstream over the length of the section.
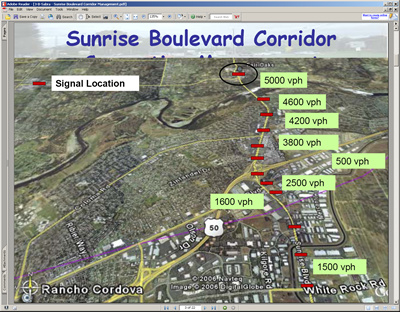
Figure 2-4. Figure showing Sunrise Boulevard in Rancho Cordova, California. The diagram shows volumes steadily increasing along arterial road to a peak of 5000 vehicles per hour at the most downstream of 12 intersections. This intersection is circled, showing the bottlneck where demand exceeds capacity.
Figure 2-4. Sunrise Boulevard Corridor.
The agency has considered widening, but is constrained by limited right of way.
Alternatives considered include:
- Optimized timing for all phases based on balancing saturation.
- Optimized offsets for improved coordination
- Shortened cycle length to try to minimize queue formation
- Longer cycle lengths to improve throughput, if possible.
- Left turn phase sequence
- Left turn protected-permissive operation
- Limited widening for northbound, despite lack of right of way
- Flush strategy of adding green time on Sunrise only
All but the final approach are curative, seeking to maximize throughput with the hope of minimizing or eliminating congestion.
The flush strategy is currently being used. It uses vehicle preemption to force the signal to pause while serving northbound Sunrise traffic. The flush is implemented manually. Nothing is done to alleviate the resulting congestion on side streets.
The desired strategy currently under consideration is an adaptive flush strategy implemented by time of day. The strategy would be defined by thresholds, possibly queue formation. Minor objectives would be to keep northbound turn bays clear, and to alleviate congestion on some major side streets. The objective is to focus queue formation on the portions of the roadway with the most favorable storage.
Both the manual and contemplated automatic flush strategies are palliative. They seek to move the damaging queues to the least damaging location. There is no expectation of alleviating residual queues, nor is there any expectation of maximizing throughput overall.
Example 3. North Carolina State Highway 54 and I-40, Durham, NC
The location in question is a network of three signals, two at the ramps of I-40 and NC-54, and one at NC-54 and Farrington Road, just west of the southbound ramp. See Figure 2-5.
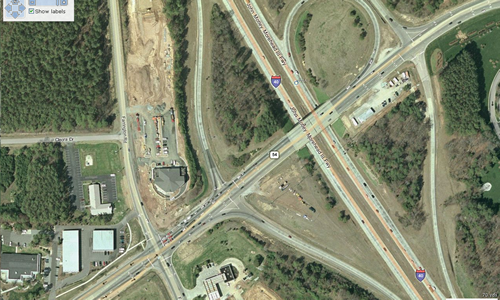
Figure 2-5. Figure showing aerial photo of North Caroline State Highway 54, running east-west, and IH-40, which in this location runs north and south, in Durham, North Carolina. The diagram shows a wide diamond interchange with two signalized ramp intersections, and an at-grade signalized intersection immediately to the west of the southbound ramp. The northbound I-40 traffic exiting to go west on NC54 have a loop ramp.
Figure 2-5. NC 54 at I-40, North Carolina
The principle problem is a severe capacity constraint at the NC-54/Farrington intersection, which backs the queue back into the ramp intersections and onto I-40.
The existing operation attempted to provide progression at the start of green using a 153-second cycle length. Excessive queues formed westbound that backed up around the loop ramp to the northbound I-40 mainlanes. Both directions of Farrington Road also suffered residual queuing. Clearly, the objective to provide progression was not appropriate for the oversaturated conditions.
The first attempted corrective measure employed offsets intended to create storage for side-street traffic. This approach involved simultaneous reds on NC-54 so that the side streets would have access to the storage area. A key feature of this alternative was the use of shorter greens and cycle lengths to minimize turn-lane overflow. The green time was set to roughly empty the turn bays, and the red time set to roughly fill the turn bays. The cycle used was 110 seconds. This approach somewhat alleviated queue formation on Farrington, but the queue still backed out onto I-40, and the westbound left turn at Farrington still spilled out of its bay.
The first attempted approach was intended to avoid queue overflow in an attempt to maximize throughput. The hope (unrealized) was a cure for excessive queuing by maximizing throughput. A minor objective was to alleviate excessive delay on Farrington Road.
The second attempted corrective measure sought to assign capacity based on safety needs rather than delay. The alternative lagged the westbound left turn to reduce queue spillback and increased the cycle length to improve capacity. The cycle used was 150 seconds. The simultaneous main-street reds were retained, but the capacity on the Farrington approach was reduced.
The result of the second attempted approach was excessive queuing onto I-40 and excessive queues on Farrington Road.
This approach was still based on maximizing throughput to alleviate or minimize residual queuing. The objective was not met.
The third attempted strategy finally employed a pure queue management objective. The cycle was increased to permit a higher green percentage on westbound NC-54. Splits for movements that had safe storage were reduced. The controller was programmed with holds and recalls to prevent actuation from restoring green time to movements of less importance to the objective of safe queue storage. The cycle used was 200 seconds. The controller was programmed so that plan changes occurred on even multiples of the cycle length, with the same offset used in all plans. This technique eliminated plan transitions at critical intersections.
The result of the third solution was excessive queuing on Farrington Road, but lessening of the queue on westbound NC-54 such that the queue did not spill out into I-40 mainlanes.
None of the solutions provided acceptable operation using any objective other than queue management.
Example 4. Bandera Road and Guilbeau Road, San Antonio, Texas
Bandera Road is one of the major arteries serving northwest San Antonio west of IH-10. At the time of this example (early 1990's), the traffic signals along Bandera were coordinated for the first time. The problem was a very heavy outbound left turn movement, as depicted in Figure 2-6. Widening to allow a two-lane left turn was not an option at the time, though doing so would have solved the problem. This case is typical of many, in that improvements to the lane utilization can often double the capacity of congested movements, while finding more green time is usually a marginal improvement.
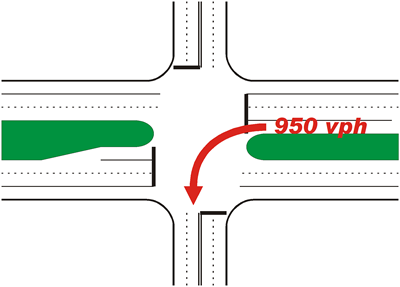
Figure 2-6. Figure showing divided highway (Bandera Road) intersecting a minor side street (Guilbeau Road) in San Antonio, Texas. The figure highlights the heavy left turn of 950 vehicles per hour from westbound Bandera Road to southbound Guilbeau Road.
Figure 2-6. Bandera Road and Guilbeau Road, San Antonio
The existing traffic signal phasing was conventional split phasing, given that most traffic on the side streets turned left to enter the main highway. The time required to serve the side-street movements exclusively consumed too large a share of the cycle, and the result was severe congestion on the outbound left turn and a growing residual queue that exceed a mile in length. When the queue spilled out of the left turn lane, it blocked a through lane, which caused congestion on the through movement.
The left turn volumes on the side street were light, and the first operational improvement was to eliminate the split phasing and require side-street left turners to yield. This resulted in a high level of public complaint, which compelled a different solution.
The next solution used phase reservice, which is a technique that appears over and over in discussions with expert practitioners, as described in the next section. Serving phases twice in the cycle may be used to reduce the number of times a minor movement is served, or increase the number of times a major movement is served, relative to the coordination. In this case, the intersection was operated at twice the normal coordination cycle of the system, and the main-street movements were served twice in the cycle. Thus, the effective cycle of the main street movements was consistent with system timing, but the percentage of that effective cycle consumed by the side street was significantly reduced.
Figure 2-7 shows the final phasing scheme.
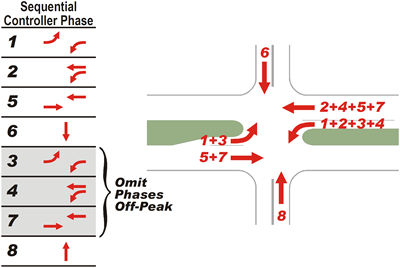
Figure 2-7. Phase diagram for Bandera and Guilbeau Roads. The controller 8 sequential phases: 1, 2, 5, 6, 3, 4, 7 and 8. Overlaps are: West thru: 2+4+5+7. West left:1+2+3+4. East thru: 5+7. Eastbound left: 1+3. South is Phase 6, and north is 8. Phases served: 1. east and west lefts, 2. west thru and left, 5. east and west thru, 6. southbound, 3. same as 1, 4. same as 2, 7. same as 5, 8. northbound. Phases 3, 4, and 7 can be permitted to serve main street twice in cycle, or omitted for conventional split phase operation.
Figure 2-7. Serving Major Phases More Than Once.
It should be noted that since this operation was implemented, the intersection was widened to provide a two-lane left turn. This operation, however, improved throughput until geometric improvements could be made.
State-of-the-Practice Interviews
Interviews were conducted with a variety of recognized experts. These experts are listed alphabetically below:
- Gerard de Camp, independent consultant, Las Vegas, Nevada and various locations in Texas
- Steven Click, Tennessee Tech University (formerly with North Carolina DOT), Cookeville, Tennessee
- Woody Hood, Maryland State Highway Administration, Annapolis, Maryland
- Eric Nelson, Harris County Department of Transportation, Houston, Texas
- Gary Pietrowicz, Road Commission of Oakland County, Troy, Michigan
- Ziad Sabra, Sabra-Wang and Associates
- Bill Shao, Los Angeles Department of Transportation, Los Angeles, California
The results reported below also include insights gained by the author while serving with the City of San Antonio in Texas.
A rough outline of questions was used as a means of promoting discussion. These are shown below:
- Any potential case study or field test site information.
- What conditions compel action?. Citizen complaint? Unmanageable queue formation? Queue spillback? Time in queue? Queue length? What is your definition of saturation?
- What are you trying to accomplish with various action? What did you try? Why did you try it? How did you know if it did or didn't work?
- What strategies and techniques do you implement?
- What controller features do you employ? Do you go beyond conventional actuation?
- What operational control strategies would you like to implement that are not supported by current controllers, or that require external manipulation of the controller?
In the actual interviews, the discussion ranged away from the questions significantly. This was allowed, because the objective was not to prejudge the knowledge of the respondents with leading questions, but to discover that knowledge in its native organization. Therefore, the questions provided a rough outline of points that needed to be included in the discussion. It was not productive, however, to attempt to categorize the interview responses according to the above questions. Therefore the responses summarized below are organized by themes that emerged during the interviews.
Definition of Saturation
The definitions offered by the interviewees varied in terms of specificity. These are some samples:
- Cannot serve all cars in sequential phases, after all attempts at balancing green times have been attempted.
- Exceeding maximum throughput.
- Damaging queue formation, particularly when the damage is a safety concern (e.g. a queue backing onto freeway main lanes) or risks gridlock by backing through an upstream intersection.
- Significant percentage of motorists needing more than one cycle to complete their maneuver.
- Growing residual queues on at least one movement after green times had been adjusted as much as possible.
All of these are related. In all cases, the observed phenomenon is growing residual queues. In these cases, delay cannot be evaluated. All define the saturated condition after making as many improvements as possible to green splits at the intersection. Most noted that green splits may be dictated by constraints unrelated to congestion on the approach.
With this definition, the first strategy was first to make as many conventional green-split improvements as possible before declaring the intersection as exceeding saturation. This corresponds to initial curative treatments, where the hope is to relieve the congestion altogether. The objective based on these definitions is either maximizing throughput or minimizing damaging queues.
Motivating Conditions
Practitioners are usually stretched thin enough such that they require conditions to deteriorate to an action point before they are compelled to do something. The respondents varied in the conditions that would compel action. Several respondents took action when observing operation during routine reviews of new signal timings. All the respondents agreed that observing an unexpected residual queue would compel action, especially if it grew to the point of causing gridlock or a safety problem, and one mentioned accident experience as a motivator. Most reported that citizen complaints were often the trigger that compelled action. One responded to requests for assistance from state DOT district offices, where citizen complaints were received.
Strategies Taken, and Their Objectives
The first step for all respondents, after confirming that there was a problem, was to first adjust the green splits to minimize residual queuing. When this didn't work, the respondent would determine that the intersection was oversaturated and start to consider more specialized strategies. There was no particular sequence to the strategies. Some respondents did not distinguish between the objectives of maximizing throughput and managing queues, while others specifically changed strategies when it was no longer possible to provide sufficient throughput to avoid damaging queues. Thus, some strategies are oriented towards maximizing throughput in the hopes of minimizing damaging queues, while other strategies were reserved for situations where that objective could not be reached. We should note, however, that even though these strategies are divided into the two groups, there is some crossover between them. Most respondents did not make the distinction between throughput and queue management.
We should also note that none of the respondents used optimization tools currently available as part of designing or implementing these strategies, and only two used any form of simulation as a means of evaluating the strategies. All respondents felt that each situation was unique enough to defy the use of a specific sequence of analysis steps. All respondents also felt that improving the problems required the sum of multiple small improvements. Finally, all respondents agreed that the problems and solutions were best identified during direct field observation.
Throughput maximization strategies included:
- Observe the intersection on the ground. Congested conditions cannot be reliably predicted by current models, even simulation models. No current generally available tool is adequate for optimizing timing in congested conditions, particularly at the intersection level.
- Fix problems starting from the most downstream bottleneck.
- Run intersections close together out of one controller, if at all possible. This will provide a tighter level of coordination than coordination timing. Diamond interchanges are the most common example of this strategy. This strategy is mentioned both in the context of throughput maximization and queue management.
- Make sure that lane striping makes most efficient use of pavement. Adding lanes to congested movements has more potential for improvement than any modification to signal operation.
- Lag heavy left turns. This prevents the queue on the through lanes from starving the left turn, which can lead to the left turn spilling out into the through lanes.
- Consider shortening the cycle. Several of the respondents have noted that long green times result in lower departure density. For example, in Oakland County, the SCATS system would measure declining saturation on approaches with essentially unlimited queues when the greens were too long. One respondent described the "slinky effect", where cars too far from the signal leave a longer headway, and then speed up to try to fill it in, leaving a larger gap behind them. This respondent felt that the densest 15-second period after start of green was the second period, and most respondents agreed with this observation. He noted that greens longer than that required to empty the mainlanes back to the start of turn bays would serve fewer cars, because cars in the mainlanes would leave gaps in the main-lane traffic after entering the turn bays. The author has observed qualitatively that headways increase with green times longer than about 30 seconds. These observations are closely tied to maintaining maximum throughput by serving the portion of the waiting queue that can be served at the highest density.
- Consider lengthening the cycle. When cycles are too short, phase-change lost time eats up the efficiency, and required fixed minimum intervals consume a greater percentage of the cycle. This suggestion conflicts with the previous one, and one respondent suggested that the optimal cycle is the "least lousy" balance between these competing objectives. Another respondent termed this "finding the right cycle". All agreed that cookbook cycle calculation methods were of little value in congested conditions.
- Consider serving phases more than once in a cycle. One respondent noted that the more heavily movements are imbalanced, the more likely it is to benefit from serving the major movement more often in the cycle, for shorter periods. This allows the minor movements to fill up sufficiently to make use of the minimum time those movements require, without going to a long cycle on the major movement that reduces throughput.
- Consider the effect of buses. Buses tend to consume a whole cycle, short or long. Thus, a shorter cycle on bus approaches usually improves throughput by increasing bus capacity and thus minimizing their effect on throughput. This is not necessarily related to bus priority, or to the question of upstream vs. downstream bus stops. Bus priority usually works within the coordination context, and often the question of relocating bus stops is out of the hands of the practitioner. But by increasing the number of cycles per hour, the respondents felt that capacity could be improved without having to address those institutional issues.
- Minimize the effect of pedestrian movements.
- Seek all possible available green time. Several of the respondents will use complicated controller features in order to allow normally sequential movements to operate at the same time to the extent physically possible. Any green time that can be found from an uncongested movement should be routed by whatever means to a congested movement. This green time may be found by use of inside clearance periods (such as at diamond interchanges), or by carefully balancing the approach splits or omitting unneeded phases.
- Consider the congested and uncongested movements separately. Two respondents mentioned that the strategy of using a shorter cycle for congested movements to minimize the slinky effect and to maximize stop-line density could be coupled with using long cycles on the minor movements to maximize vehicular throughput on phases controlled by pedestrian minimums. This leads to running congested phases twice in each cycle (or running minor phases every other cycle).
- The lighter the pedestrian demand, the more important pedestrian signals and pushbuttons become. The presence of the pushbutton allows the signal timing to routinely ignore the pedestrian minimum, except in those circumstances when a pedestrian places a call.
- Prevent actuated short greens. On approaches with high truck volumes, a truck may leave a larger-than-normal gap, which can cause the signal to gap early and terminate the green. On a congested approach, this reduces the throughput of the approach by not giving them their normal share of the cycle. Set up detection to prevent accidental early gap-outs.
Queue management strategies included:
- Cut down left turn splits, in the hopes of encouraging left turners to make their maneuver elsewhere.
- Ensure that coordination between close intersections remains effective, even during transitions, preemption recovery, etc. Even one failure of coordination can cause a queue to spill back through an upstream intersection, which cascades into a larger problem that may not recover during the peak period.
- Balance queue length for conflicting approaches.
- Adjust splits to prevent a queue from blocking unrelated upstream movements. These include traffic crossing the arterial at an intersection upstream from the congested intersection, and backing a queue up a freeway exit ramp onto the mainlanes.
- Switch from a fill-then-empty approach to a continuous flow approach (see below). This usually requires shifting to a long cycle, and usually causes serious queuing in places where the queuing does less damage.
- Do whatever it takes within the control equipment to prevent queues from multiplying by extending through upstream intersections.
- Coordinate upstream signals to control flow into the congested intersection.
- Coordinate downstream signals to ensure that they can handle the flow coming out of the critical intersection, without ever queuing back into the critical intersection.
One respondent presented a strategic concept that bears special mention. He made the distinction between two general strategies:
- Fill then Empty. In this approach, the signal timing is adjusted to empty only the portion of the storage that can feed the stop line with the highest density of traffic. This is a throughput-maximization strategy. This approach usually requires shorter cycles, to make sure that green times are controlled to ensure the greatest possible density at the stop line. One respondent (not the one who suggested this dichotomy) noted that as cycle length goes up, the number of fill and drain cycles goes down, increasing the load on each.
- Continuous Flow. Here, the signal timing is adjusted to keep the approach traffic moving, even at the expense of queue length on minor movements, and even if throughput suffers. More specifically, green time is added to the congested movement under consideration, which created a longer cycle without adding green time to the other movements. Thus, the capacity of other movements declined. This was done to prevent traffic from backing onto freeway mainlanes, and would have to be considered a queue management strategy. This approach implies longer cycles than would normally be effective when maximizing throughput. During the interview, the respondent and the interviewer noted that this strategy is probably narrow in its application, and many conditions may mitigate against its use. For example, adding green time to the congested movement in large doses may well shift the bottleneck to the next downstream location. The example of this strategy is the third alternative implemented at North Carolina 54 at I-40, described in the previous sections.
Demons
One respondent also presented a series of "demons". The demons were those influences that forced signal timing into states less able to address congestion. These included:
- Longer and longer pedestrian clearance intervals. Not all signal controllers effectively address long pedestrian clearances within coordination, and in many cases long pedestrian clearances drive the cycle length upward, often to excessive levels.
- Longer vehicle clearance intervals. It was acknowledged that motorists will take the clearance they need, and clearance intervals that are too short may cause conflicts. But the respondent was noting longer and longer red clearances in particular. He felt that a red clearance long enough to clear a vehicle all the way across the intersection was excessive, given the lost time cushion for traffic starting up on the crossing movements. He cited one example where the additional red clearances added up to 7 seconds, which is 5% of a 140-second cycle. Because the minor movements were already at working minimums, all of this time had to come from the main-street movement. This last point is the critical point: Many who promote the longer clearance intervals assume that those increases clearances come from their associate movements. This is not the case. Because the green times for many of those movements are already as short as possible in congested intersections, the increases around the intersection usually come from only one or two major movements, where they have a significant effect. (The authors note recent research efforts that suggest little long-term improvement from increasing red clearances without due consideration. These are noted in the previous chapter.)
- Too much dependence on detection. At locations where long cycles are used in the hopes that minor movements will gap early, a malfunctioning detector can cause significant unused green time. Shorter cycles minimize the effect of detector malfunctions.
- Too many phases. The more a cycle is divided into smaller components, the less green time each component will get.
Tactics and Controller Features
The respondents used a range of system tools and controller features to support their objectives at saturated intersections. One respondent specifically avoided the use of esoteric features as a matter of policy, because of the concern for maintaining the implementation of those features with maintenance forces who don’t understand them. That leads to a general recommendation from all the respondents: All specialized controller features used in congested conditions should be defined as straightforward features, rather than a combination of otherwise unrelated special features that is hard to comprehend and maintain. One example is a straightforward feature for serving a phase more than once in a cycle. There are many approaches to doing this (including the method shown in Example 4), but if some agencies are reluctant to overwhelm their technicians with the use of such features, then the solution is to make the features available without overwhelming the technicians.
Overriding SCATS Control. One respondent had a SCATS system running the signals in his jurisdiction, and that provided a means of metering traffic into congested intersections. When the queue from a congested intersection backed through an upstream intersection, the normal SCATS response was to increase green time on the congested approach. Given that the congestion was caused by the downstream intersection, the result was wasted green time, with crossing movements left unserved. He used a special detector to sense the queue approaching the upstream intersection, which triggered SCATS to reduce rather than increase traffic on the through movement feeding the congestion. This would allow minor movements to be served.
The respondent's experience with SCATS brings up a more general issue of adaptive control in saturated conditions. The objective of current adaptive control systems is to adjust timing so that the critical intersection hovers at a high level of saturation, typically about 90%. Adaptive systems respond to the intense detection response associated with a standing queue by adding more time to that movement. They do not balance queue lengths, nor do they have any mechanism for addressing damaging queues. When demand increases, they all seek longer cycles, even though this may not be the preferred strategy to maximize throughput. As with off-line optimization software, none of the adaptive optimization algorithms in common use seek to maximize throughput or minimize damaging queues as an objective function. For this reason, the respondents generally did not consider adaptive control as likely to be effective in congested conditions, particularly when considering single or small groupings of intersections. Only one respondent manages an adaptive system routinely, and as the above paragraph explains, he sometimes has to work around that system's algorithm.
Proponents of adaptive control suggest that these systems may delay the onset of congestion even if they are less effective once the congestion arrives. As a matter of opinion on the part of the researchers, this varies depending on the adaptive system being considered. Systems that minimize queue formation (as a byproduct of maximizing throughput) will prevent congestion most effectively, and those considering adaptive control would be encouraged to understand the objectives of the optimization process used by the adaptive system.
Phase Reservice. Several respondents manipulated their controllers to provide green signals more than once in the cycle, or to alternate movements to every other cycle. For example, the author once used a cycle twice the coordination cycle to serve split-phase side-street movements on alternating cycles. These movements were light, and serving them on alternate cycles made better use of the minimum green time, which was controlled by pedestrian clearance time.
One respondent suggested that the more heavily movements are imbalanced, the more likely the intersection will benefit from serving the major movement more often in the cycle, for shorter periods.
Minimize Pedestrian Effects. When pedestrian demand is heavy, then all respondents agreed that it had to be included in the signal timing explicitly. But when pedestrian demand is light, the temptation by many agencies is to avoid installing pedestrian signals and pushbuttons. As mentioned above, the presence of signals and pushbuttons allows pedestrian movements to be routinely ignored unless there is a pedestrian call. The traditional approach to this is to provide coordination timing that violates the pedestrian intervals. When the pedestrian intervals are called by a pushbutton actuation, they override the coordination timing to serve the pedestrians. The intersection then allows the signal to transition back to coordinated operation. If this happens only rarely, the loss of coordination has negligible overall effect. In this case, "rare actuation" is considered to mean an actuation no more often than once in several hours.
Not all controllers handle pedestrian override as defined above. For example, some controllers transition slowly, while others won't allow coordination timings that violate pedestrian intervals to be installed in the first place. One respondent suggested a workaround. He sets the split to allow for the pedestrian intervals, but then sets the maximum green time (MAX) in use during that pattern at the normal green time needed by vehicles. The phase will normally max when the pedestrian intervals are not called. If all the MAX times are set to their desired vehicle splits, then the MAX times will control the splits of the non-coordinated phases. Some controllers inhibit MAX during coordination, and this must be disabled. When the pedestrian intervals are called, the intersection runs according to the coordination timings, with no loss of coordination and no requirement for transition.
Some controllers allow MAX settings by pattern, and some by time of day.
Detector Switching. Several respondents used detector switching to turn off detectors that cause an approach to extend for density values that are too low, and for turning on detectors that serve greens that overlap with other movements to increase efficiency. An example is to switch off a detector in a right-turn bay if the complementary left turn will be served next (i.e., if it has a call). This requires using special controller logic.
Special Controller Logic. One respondent aggressively used auxiliary logic functions within controllers to achieve specific objectives. For example, when a left turn lags, he uses an auxiliary function to extend the complementary through movement even if it has no call.
Another respondent used controller logic to circumvent normal barrier cells. The logic controls in their software allow them to assign a logic output to a load switch, and then control that logic output by any combination of normal controller conditions.
Simultaneous Gaps. Once one of a lagging phase pair gaps, the controller will not extend that phase until the next cycle, even if it is holding in green waiting for the other lagging phase pair to terminate. This prevents alternating widely spaced cars to hold opposing through movements in green despite low density being served.
Dual Entry. This feature causes compatible minor movements to both turn green even if only one of the phases was called. For example, if the side street has a call on Phase 8, the controller will also serve Phase 4 along with Phase 8. Without invoking this feature, Phase 8 would be served while Phase 4 would remain red, unless a car placed a call some time later in the Phase 8 green period, at which time Phase 4 would go green and time all its minimum intervals. Dual entry forces side-street compatible pairs to be served at the same time.
Dynamic MAX. One respondent mentioned this feature, though it was not favored by all respondents. If a phase maxes out in successive cycles, the MAX time will be increased by an increment. This will continue for each successive maxing out until a maximum MAX is reached. Some controllers revert the max time back to the normal setting on the first phase that gaps out instead of maxing out, while others will subtract increments on successive gap-outs until it backs down to the normal setting.
A variation on Dynamic MAX is adaptive split operation. One respondent reported the desire to have coordination timings adapt to the presence of detection throughout the green period. In other words, when cars are detected right through to the end of green repeatedly, the controller would adjust the coordination timings accordingly.
Volume-Density. Use variable gap to shorten gap settings quickly to more aggressively find a gap in the approach traffic. Also, use variable gap on stop-line detection zones to prevent a truck-induced (and therefore larger) gap from causing a short green.
Desired Controller Features
Most of the desired controller features are available from one or two manufacturers, but they are not part of the NEMA standard and therefore not universally provided. Some require logical functions external to the basic NEMA ring rules. Desired controller features include?
- Eliminate barrier cells. Currently, the NEMA ring diagram provides a barrier across the two rings of sequential phases. It is more flexible to set a phase sequence in a ring, and then declare which phases in one ring are compatible with which phases in the other rings. One responded uses this capability with lead-lag operation that is forced by geometry, to prevent opposing left turns from operating at the same time without imposing a particular sequence.
- Allow uncomplicated and straightforward phase reservice. Several respondents support this request.
- Variable gap time, by time of day.
- Floating force-off, by phase. This accomplishes a similar objective as using MAX times to control splits (see previous section, under Minimize Pedestrian Effects).
- Right-turn detector logic, to allow adjacent through movements to terminate when the next phase is the complementary left turn. This would inhibit the controller from holding the through green on the basis of right turn detections only, when those rights turns could be served during the complementary left turn coming up.
- Split-phase operation based on queue detection. Split phasing is more efficient when options lanes are provided and when turning traffic exceeds through traffic. This should be evaluated cycle by cycle.
- Variable walk time based on push button input.
- Pedestrian cross-switching and head starts by time of day. This feature would allow pedestrian movements to overlap with unconflicting left turns, or with left turns that do not conflict with the pedestrian movement during the first portion of the pedestrian interval.
- Eliminate the requirement to have a coordinated phase in each ring.
- Omit minor movements by time of day.
- Measure detector on time from the first time it went on, regardless of phase color or service, as a measure of residual queuing. This was one of the few suggestions by a respondent that would measure the boundary between heavy traffic and building residual queues.
- Monitor left turn detector to determine, regardless of phase color, when a queue for a permitted (not protected) left turn is never served. This applies to cases where no protected left turn is provided to serve a left turn bay. The elimination of the protected left turn is often done by time of day, and in some cases corresponds to a left-turn prohibition. A left-turner that is unwilling to turn permissively my become trapped in the bay in this circumstance.
- Drop protected left turn when left turn volume does not warrant the separate phase. This could be coupled to the previous item to determine when to turn the protected phase back on.
- Provide a monitor of splits, showing when phases gap or max out. This is a feature available in some current systems.
- Adaptive split, which provides the same general feature as adaptive max but is applied to coordination timings. When a phase consistently sees detection through the end of green, adjust splits upward for this phase and downward for phases with less utilization, etc.