CASE STUDY 1: I-494 AND TRUNK HIGHWAY 7 IN MINNEAPOLIS, MINNESOTA
Project Description
In 2006, the Minnesota Department of Transportation (MNDOT) planned, designed, and constructed an expanded section of Interstate 494 in Minneapolis. The project involved widening I-494 from 4-lanes to 6-lanes From Valley Creek Road to TH 55 in the west metro area.
To support the analysis of alternatives, MNDOT used a traffic simulation tool to model future conditions along I-494 along with interchanges. For one specific interchange, I-494 and Trunk Highway (TH) 7, MNDOT modeled two build scenarios including a full cloverleaf interchange and a partial cloverleaf interchange, along with a no-build scenario. The area of study is shown in Figure 2. The interchange is located southwest of Minneapolis in a suburban area.
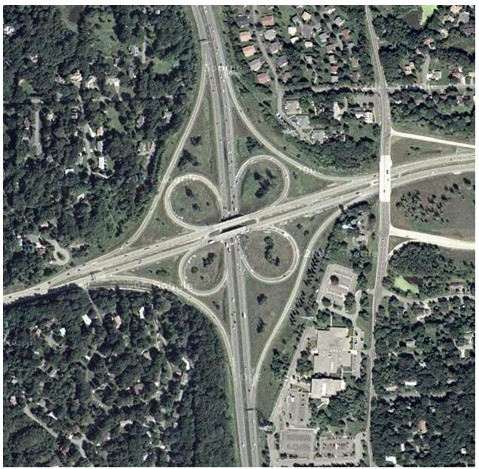
Figure 2: Intersection of Interstate 494 and TH 7 in Minneapolis, Minnesota
At the time of the analysis, the existing interchange was a full cloverleaf. MNDOT was concerned with the potential impacts on the loops from the freeway widening project and gave additional scrutiny to the I-494/TH7 interchange.
Characteristics and Inputs
The planning and design of the project included a simulation model analysis for year opening (2006) and the 20 year design timeframe. MNDOT opened the upgraded interchange to traffic on August 31, 2006.
Data Collection
MNDOT maintains an electronic repository of data for all freeways in the Twin Cities Metropolitan area. MNDOT archives the data and provides public access to the data via a website. The system archives volume, speed, headway, and occupancy data from loop detectors and calculates metrics such as density and flow rate. These advanced metrics are intended to demonstrate peak period performance better than the peak 15 minute measures often used.
Data were downloaded from the system for analysis and comparison with the simulation model output and results to test how well the simulation process performed. We focused the analysis on freeway and loop operational characteristics for the I-494/TH7 interchange area. Since the metrics showed acceptable levels of service, we also chose one additional location where the model predicted oversaturated conditions for the freeway to see how well the analysis predicted actual field conditions.
To this case study assessment, after data during a period from September 2006 through June 2007 was obtained. This timeframe was selected based on data guidelines from MnDOT's publication titled "Data Extraction Cookbook: Discover the Magic of Data Extraction" based on the following MnDOT guidance:
- Eliminate weekends, Mondays, and Fridays
- Eliminate holidays and the days before and after holidays
- Eliminate bad weather days (days with snow or more than 0.20 inches of rainfall)
- Eliminate days with traffic incidents during the AM or PM peak period (7 to 8 AM and 4 to 5 PM)
- Eliminate days with special weather incidents (e.g., fog or mist, fog reducing visibility to ¼ mile or less, thunder, ice pellets, hail, freezing rain or drizzle, duststorm or sandstorm resulting in visibility of ¼ mile or less, smoke or haze, blowing snow, and tornado).
Weather information was also obtained for the Twin Cities area via http://www.weather.gov, combined with an inquiry about historical traffic incident information to identify any effects due to recurring and nonrecurring incidents. MnDOT recently phased out the Metro Incident Selection Tool (MIST); therefore, incident archives were not available for analysis. While incidents may have occurred on some of the analysis days, no incidents were accounted for due to the lack of data.
Analysis and Results
Once the specific dates were selected for analysis, we downloaded archived traffic data for the PM peak period (4-5PM). The following figures show the seven detector locations studied.
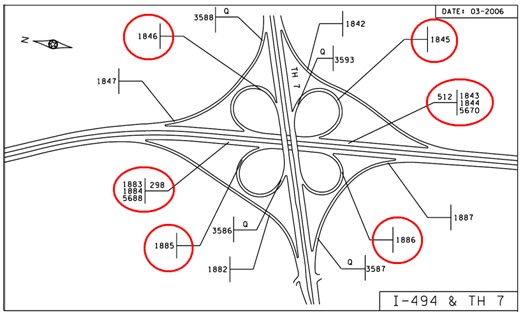
Figure 3: I-494 and TH7 Interchange Detector Locations
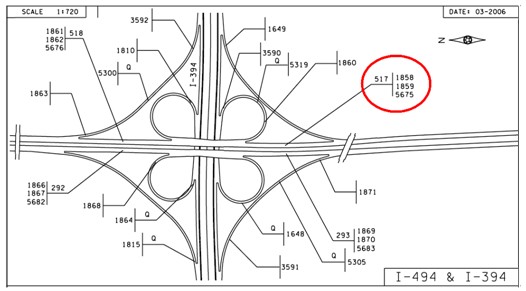
Figure 4: I-494 and I-394 Interchange Detector Locations
Evaluation Measures
Results for simulated throughput were compared with actual flow rates. The average field measured flow rate was consistently higher than the simulated throughput due in part to an issue with a previous version of this model in overestimating impacts from bottlenecks. Additionally, travel demand data may have been underestimated by the planning model used, especially since true "demand" is higher than loop detectors can count - given that they only see departure volumes - during congested conditions. Since this project was a partial reconstruction of I-494, the freeway lane configuration reduces from six to four lanes further downstream compared with the configuration prior to construction During the original analysis and prior to construction, field observations by MnDOT's analysis team highlighted issues with the operating conditions on each ramp due to the constrained right-of-way. The simulated speeds for the ramps were fairly similar to the actual detector speeds, with the actual speeds slightly higher in the field for 5 of the 7 study locations. The model results helped MnDOT better understand the projected operating conditions and the speed profiles helped them decide to expand the existing full clover leaf design within the constrained right of way compared with the partial clover leaf alternative. Increasing the volumes to try and predict true demand through sensitivity analysis may have been helpful in determining break points for acceptable versus unacceptable operating conditions.
Table 1 compares simulated measures with actual field conditions. Since the ramp loop detectors are located at the mid points of the ramps, density and LOS do not apply for the ramps. Influences from merge and diverge areas were accounted for in the simulation but not directly reported as they would be from a Highway Capacity Analysis. All of the ramp roadways have peak hour volumes that are below capacity.
| Location | Simulation Statistics | Average Field Conditions | ||||||
|---|---|---|---|---|---|---|---|---|
| Through-put | Speed | Density | LOS | Through-put | Speed | Density | LOS | |
| NB I-494 Off Ramp | 518 | 29 | N/A | N/A | 517 | 25 | N/A | N/A |
| SB I-494 Off Ramp | 323 | 29 | N/A | N/A | 249 | 27 | N/A | N/A |
| I-494 On Ramp from EB TH7 | 723 | 20 | N/A | N/A | 613 | 25 | N/A | N/A |
| I-494 On Ramp from WB TH7 | 82 | 22 | N/A | N/A | 66 | 26 | N/A | N/A |
| SB I-494 Mainline | 4221 | 67 | 14 | B | 3589 | 75 | 16 | B |
| NB I-494 Mainline | 5131 | 62 | 16 | B | 4629 | 73 | 22 | C |
| NB I-494 at I394 | 5544 | 42 | 58 | F | 4302 | 65 | 29 | D |
Congested Conditions
The freeway segment northbound on I494 at the I394 interchange was selected to test one location that MnDOT projected to have failing operating conditions. As shown in Table 1, the average actual density for this segment was 29 passenger cars per hour per lane (pcphpl), while the model predicted 58 pcphpl. However, several 15 minute time periods of actual field data showed a density greater than 45, indicating LOS F based on the Highway Capacity Manual. The model also included consideration of truck traffic impacts based on truck operating parameters that differ from those of passenger cars, and the MnDOT data archives also account for truck percentages. In this case, the model results helped MNDOT better understand and enhance the justification for the need to widen the freeway, even though high densities were projected for the widened section in the future as well. The six lane section would enhance traffic operations compared with the four lane section. Additionally, this area would likely be influenced by the nearby downstream weaving segment which could involve a different analysis to determine operating performance.
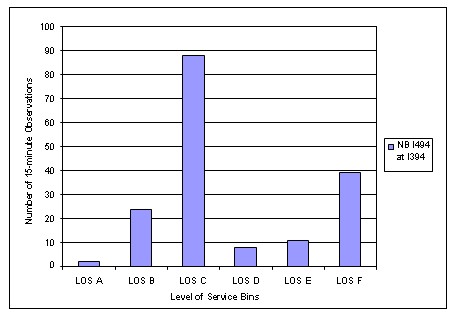
Figure 5: LOS Observations by 15 Minute Time Period
Figure 5 highlights the LOS categories within which each individual 15 minute density value falls, as observed from actual field conditions. The model's average density was higher than the field-measured average density. However, several periods with LOS F were observed. As MnDOT successfully proved, agencies should understand the level of detail being analyzed to ensure a full understanding of the operating conditions of the facility. Often, temporal descriptions of results are needed to help decision makers understand operations. For example, LOS F should be accompanied by the time period the LOS is observed, how long it lasts, and if an improvement reduces density or delay but does not change level of service.
Conclusions and Recommendations
The purpose of this analysis was to analyze how the application of a micro-simulation tool provided support to decision makers and determine how well the tool predicted future operating conditions for the freeway and interchange and how it influenced the decision. Although right of way constraints and time limitations for reconstruction drove the decision to keep the existing loops, use of the model enhanced the decision making process. The analysis adequately predicted future freeway operating conditions and overall helped MNDOT understand the potential impacts from the freeway reconstruction project. Variation in results for several measures may have mainly been due to error in demand projections based on expanded capacity. Based upon discussions with the Minnesota DOT team, they believe that a sensitivity analysis should be built in to determine, based on the level of confidence in the data projections, the point at which additional traffic may make the facility reach congested conditions or conditions degraded below a desired threshold.
Extensions and Guidance
The following observations and guidance are offered as a result of the analysis and discussions with project personnel.
Level of Effort - Being a significant corridor level analysis (this report focuses mainly on one interchange within the larger study), the level of effort for this particular simulation project is estimated to be approximately 1500 person-hours over three months. This level of effort is based on users with significant simulation modeling experience and who have access to an excellent data repository from which data can be extracted electronically. Additionally, users had access to data processing tools, such as a Visual Basic interface tool developed prior to this study that processes simulation output files and organizes the output data into a spreadsheet for ease of analysis and reporting. A similar study with less experienced modelers and more time consuming data collection and data gathering would expand the level of effort beyond what is estimated for this study.
Needs that would add level of effort to this particular magnitude of project include:
- Field data collection or data gathering from another agency such as planning data from a Metropolitan Planning Organization (MPO).
- Additional time needed for less experienced users to familiarize themselves with the model.
- Additional time needed for any expanded sensitivity analyses that may be needed to determine the future break point demand for a facility. This type of analysis would enhance the results and decision making process.
- Setting up the model and coding the geometrics normally takes less time than data gathering and input, especially without links to electronic data repositories such as the MNDOT data tools website. Users should allow for adequate time to gather data.
- Tools can be developed, similar to the one mentioned in this case, to automate data input and output processing to save time and cost over multiple simulation projects. Early investments may be needed to lower future level of effort.
Modeling Process
Users should use simulation modeling to get verifiable results, not simply a set of quantified results from a completed analysis. The results should be reasonable and based on model calibration. Much of the process FHWA has published for using simulation models was developed in parallel with the process used by MnDOT. One area that is evolving for MnDOT is model calibration. With added experience, modelers can enhance their understanding of the parameters that, when altered, will have the most impact on the results.
Model results should be used to support decision-making processes and therefore need to be adequately communicated to decision-makers. Additionally, users should not simulate every idea proposed, but should use discussion and other tools to narrow the list to a few alternatives that are the most promising and that can best support decision-making.
Analysis of Results
Users should be careful when comparing information across traffic analysis tools. For example, MNDOT used simulation-produced freeway densities within the Highway Capacity Manual's level of service thresholds. FHWA does not promote nor encourage the reporting of LOS based on an alternative tool's results due to the differences in the way these metrics are calculated. The HCM uses passenger-car equivalents and peak flow rates to determine density, and the level of service thresholds were designed for use with this particular procedure for calculating density. Results should be displayed in an appropriate way to allow decision-makers to view the results within the context they were designed for. Simulations should further define latter (later??) steps in the process.
Potential Simulation Model Issues
Since this analysis was performed in 2002, MNDOT used an older version of the simulation model than is currently available. The older version of the model had difficulties in predicting impacts from lane drops on freeways. This issue has been alleviated in the current version of the model. However, the earlier model's tendency to overestimate impacts from lane drops and underestimate the ability of the traffic stream to recover from such congested conditions may have been responsible for the model overestimating the congestion and underestimating the throughput compared with the field data. Users should be familiar enough with potential issues to properly calibrate the model and should validate the findings as much as possible to ensure accurate results.
| Special thanks to Kevin Sommers of the Minnesota Department of Transportation and MnDOT's consulting team for providing details and insights for use in these comparisons. |