INTRODUCTION
Traffic analysis tools play a critical role in prioritizing public investment in strategies employed by transportation professionals to relieve congestion. Use of traffic simulation and analysis tools has become the standard approach for evaluating transportation design alternatives, operational performance, Intelligent Transportation Systems (ITS) and traffic operations strategies. These tools are being utilized by agencies to assess the performance of existing operations as well as the prediction of future operations. As reliance on these tools increases it is critical to understand how well they predict performance under actual as well as assumed conditions.
Purpose
The purpose of this study is to assess and provide an understanding on how well simulation and traffic analysis tools predict performance, and identify elements and issues which practitioners should be aware of to effectively apply these tools. Often, misapplication of a tool can change the results enough to significantly impact the decision making process. Since the modeling process is often used to support investment decisions on higher cost projects, misapplication of a tool might result in significant cost implications.
Rationale for the Cases
Information was gathered on more than 20 potential case study locations. In order to determine the sites that would provide the best information, site selection criteria were developed and applied. These criteria include the following:
- Availability of "after" data, preferably sites where an "after" study was performed
- Diversity in traffic analysis tools used (may include more than one)
- Diversity in type of improvement or operational strategy modeled or proposed
- Geographic dispersion across sites
- Facility type
- Location type (e.g., rural, urban, downtown)
- Location characteristics (e.g., percent of local traffic versus through traffic, percent trucks, percent commuter traffic)
- Typical volume/capacity or level of congestion
- Agency's experience with the use of traffic analysis tools
Information Gathering
Once the site selection criteria was applied and a list of the five top sites was generated, contact was made with local project representatives (often both in the public and private sector) to extract information on the potential case study. For sites with "after" studies, summary reports were gathered to assess any completed comparisons of model results with actual field conditions. For sites where the strategy or construction was already implemented, investigations were performed into the potential for data gathering at the site to facilitate analysis of field conditions. Where appropriate, agencies provided actual files from the tool used. These files were analyzed to support the conclusions drawn within this report.
Scope of Each Case Study
This study was carried out through in-depth discussions with traffic operations practitioners who had relied on a transportation model to assist them in designing a technical solution to a traffic engineering problem, only to find that the reality of the traffic and operation of the project was somewhat or significantly different from that projected by the model. More than 20 potential cases were initially evaluated and narrowed to five cases for in-depth analysis.
The five cases are shown in Figure 1 and briefly described below.
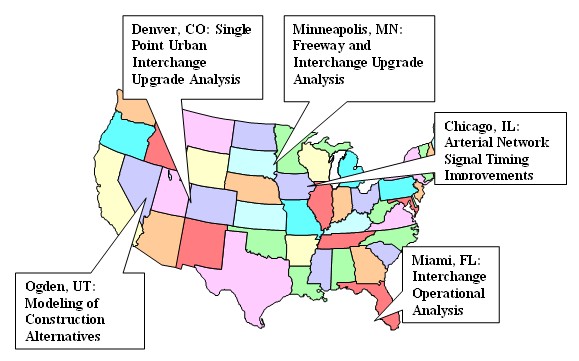
Figure 1: Case Study Locations and Types of Projects
- I-494 and Trunk Highway 7 in Minneapolis, Minnesota: Modeling for the widening of I-494 from 4-lanes to 6-lanes From Valley Creek Road to TH 55 in the west metro area.
- I-15 Reconstruction in Ogden, Utah: Investigation of various I-15 reconstruction closure scenarios to model and quantify the impact on travelers during the project.
- S.R. 826-Palmetto Expressway Off-Ramps near Miami, Florida: Documentation of the operations of off-ramp improvements and the addition of an auxiliary lane.
- I-25 and University Boulevard in Denver, Colorado: Estimation of performance of replacing a full cloverleaf interchange with a single point urban interchange (SPUI).
- Traffic Signal Network in Chicago, Illinois: Study of key issues in the validation of a microsimulation analysis of a complex arterial network signal timing project.
The five cases were selected to test a variety of software model tools across a range of applications and settings, illustrative of problems as well as best practices, to derive lessons learned. FHWA's Traffic Analysis Toolbox provides information on the process for carrying out a microsimulation analysis project. Some of the processes used in each case study listed are very similar to the process outlined in Volume 3 of the Traffic Analysis Toolbox; however, formal site-specific processes for modeling and simulation may not be as clearly defined as the FHWA-developed process. Practitioners from all the sites studied and highlighted in this document used some or most elements of the Toolbox process according to their own established procedures and the procedures required for the particular software that was employed, sometimes without specific reference to a defined process. Many of the elements of the process are clear to users and must be applied to perform a study, while others, and the appropriate techniques for application, may not be.
Each case study that employed use of an appropriate tool that leads to the metric of Levels of Service (LOS) modeled conditions during the worst 15 minute period (peak flow rate). The cases that used microsimulation went well beyond the peak 15 minute flow rate typically used for LOS, and usually encompassed multiple time periods including the peak hour and often the peak period, as discussed in the case studies. Additional metrics that were analyzed in one or more of the case studies included queuing, delay (signals), density (freeways), bottlenecking, spillback, following patterns and lane distribution, and crash rates.
During these investigations, much was learned that increases the understanding of current practice and provides insights into improving future analyses. The summary "Issues of Implementation" at the end of this report discusses examples of lessons learned, and how the user can anticipate / adjust / compensate for the types of modeling challenges identified ("So what should a user do?"). These cases and summary are the foundation for a (forthcoming?) practical set of guidelines and suggestions for typical studies to overcome common shortcomings, unreliable assumptions similar problems.