SHRP2 Operations in the 21st Century DOT – Meeting Customers Needs and Expectations
Download the Printable PDF Version [PDF,
3 MB]
You may need the Adobe® Reader® to view this PDF.
Download the Printable MS PowerPoint Version [PPTX,
1.5 MB]
You may need the Microsoft PowerPoint Viewer to view this PPTX file.
Slide 1. Operations in the 21st Century DOT - Meeting Customers Needs and Expectations
Notes
Description of the Slide
Cover: This presentation is geared towards DOT executives regarding the increasingly important role of transportation systems management and operations (TSMO) – hereinafter simply referred to as "operations" – in the effective management and delivery of transportation services to customers of the state departments of transportation (DOTs). In other words – how operations can help DOTs meet their customer needs and expectations in a rapidly changing environment.
Key Points
- Hello and thank you for taking time from your busy schedule(s) to discuss transportation systems management and operations; what operations can do to help the DOT improve customer service; and some actions you can take to improve operations in your agency.
- Introductions
Other – Depending on the audience and time, considerations should be given to prompting the audience to ask questions at any time during the presentation.
Slide 2. Purpose of this Meeting: Share Thoughts & Discuss
Content
- Challenges brought about by the changing transportation environment and public (i.e., "customer") expectations
- How operations and supporting technologies can help address these issues
- Importance of mainstreaming operations into the DOT's program (and the transportation planning process)
Notes
Description of the Slide
Our presentation and discussions today will focus on three key areas as shown here.
Key Points
- The role of the DOT has evolved over the past 75 years in response to the changing needs of customers. From an initial mandate that centered around building and preserving the transportation infrastructure, the transportation environment has changed such that a DOT's responsibilities have expanded to include actively managing and operating their transportation network as effectively as possible so as to meet customers' demands for safety, mobility, and reliability; and to do so in the most cost-effective manner.
- Operations and the supporting technologies are valuable tools for meeting these challenges and optimizing the transportation system.
- Operations cannot succeed in a vacuum – it must be understood and become a core function throughout the agency. In other words, operations must be mainstreamed into the entire DOT programming and planning processes.
Slide 3. What is Operations?
Content
Transportation Systems Management and Operations (TSMO, TSM&O)
- Defined in MAP 21
- "Integrated strategies to optimize the performance of existing infrastructure through the implementation of multimodal and intermodal, cross-jurisdictional systems, services, and projects"
- Supported and enabled by Intelligent Transportation System (ITS) technologies
Notes
Description of the Slide
Before getting into any more discussions, it is perhaps worthwhile to define just what is meant by "operations."
Key Points
- The current federal transportation reauthorization – Moving Ahead for Progress in the 21st Century Act, or MAP 21 – defines "Transportation Systems Management and Operations."
- A key phrase in this definition is the notion of "integrated strategies." The goal of integration is to bring the management and operation of the surface transportation network into a unified whole, thereby making the various transportation modes and facilities perform better and work together.
- There are many aspects of integration – for example:
- Technical integration, such as standards and system architectures that support real-time information sharing between ITS-based systems across all modes; and also,
- Institutional integration such that operations are mainstreamed into a transportation agency's institutional framework and corresponding business processes; and also coordination and collaboration between various agencies and jurisdictions in the region achieve seamless interoperability.
Other – MAP-21 was extended and will expire May 31, 2015. A new transportation authorization (replacing MAP 21) is expected sometime in 2015. The presenter should check the subsequent re-authorization for any change in the definition of TSMO or emphasis.
Slide 4. Example Operations Strategies and Solutions
Content
- Work Zone Management
- Traffic Incident Management
- Service Patrols
- Special Event Management
- Road Weather Management
- Transit Management
- Freight Management
- Traffic Signal Coordination
- Traveler Information
- Ramp Management
- Managed Lanes
- Active Traffic Management
- Integrated Corridor Management
Notes
Description of the Slide
This slide lists several of the operations strategies that have been applied by DOTs and transportation agencies across the country; and in doing so, they have made substantial positive impacts on the safety, mobility, and reliability of the surface transportation network.
Key Points
- Operations consists of a wide array of possible strategies and opportunities, from every-day activities to cutting edge solutions and technologies.
- Many of these strategies can be applied to both urban and rural environments.
- We will touch on some of these in more detail, including potential benefits later.
Other – If possible, perhaps highlight a few of these strategies in terms of what the specific DOT has done / is doing.
Slide 5. The Transportation Environment is Changing
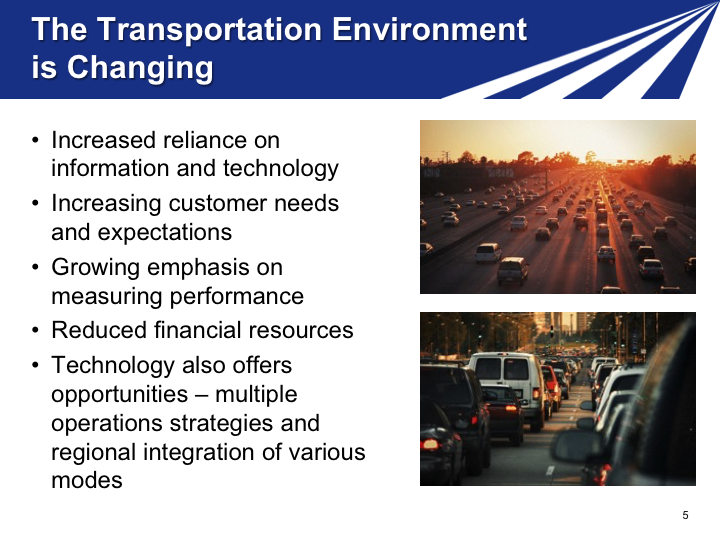
Content
- Increased reliance on information and technology
- Increasing customer needs and expectations
- Growing emphasis on measuring performance
- Reduced financial resources
- Technology also offers opportunities – multiple operations strategies and regional integration of various modes

Figure 6: Photo: Moderate vehicular traffic on a highway with sun in distance.

Figure 7: Photo: Stopped traffic on a city street.
Notes
Description of the Slide
It should come as no surprise to you that the transportation environment in which DOTs conduct their business has been changing and continues to change, often quite rapidly.
Key Points
- We are living in an information revolution, brought about and supported by new and emerging technologies. In today's connected world, customers are regularly introduced to new ways of obtaining and using real-time information to save time and money; and DOTs are expected to take advantage and use these technologies.
- The DOT's customers – that is, the traveling public – expect that the products they use and the technologies they encounter will be "smart" and will ultimately improve their travel experience, They also expect that the information received will be accurate and reliable—regardless of who "owns" the road or the information.
- There is also an increased emphasis on accountability and transparency on how DOTs conduct their business; and this requires that the performance of the transportation network be regularly measured and compared to established metrics.
- Moreover, the increased expectations and accountability are coming at a time when government agencies are expected to do more, but with fewer financial resources.
- These same technologies can also help DOTs meet these increased expectations through the execution of operations strategies. However, it is important to remember that operations is more than merely implementing technology along the roadway.
Other – The key points listed above are for a shorter version. If a longer version is being presented (including the next 4 slides), then the key points can be skipped, and lead into the next slide with "there are several reasons behind this changing environment."
Slide 6. Technology is Transforming Our World
Content
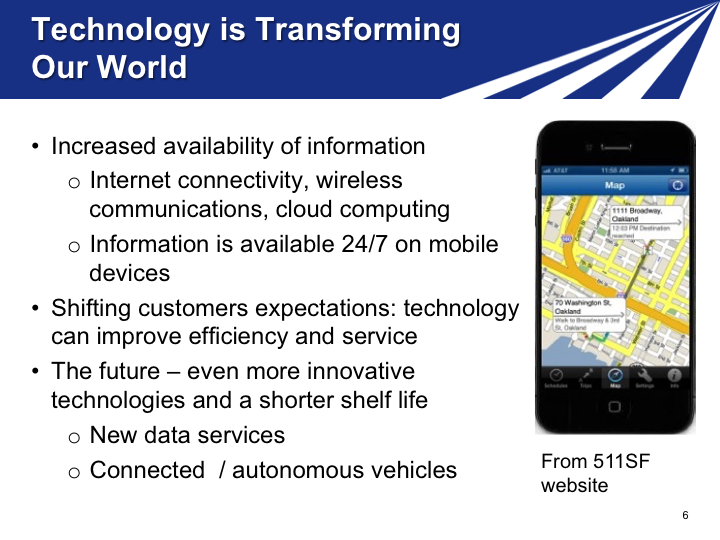
- Increased availability of information
- Internet connectivity, wireless communications, cloud computing
- Information is available 24/7 on mobile devices
- Shifting customers expectations: technology can improve efficiency and service
- The future – even more innovative technologies and a shorter shelf life
- New data services
- Connected / autonomous vehicles

Figure 8: Photo: Smartphone with mapping application open from the 511SF website.
Notes
Description of the Slide
We are living in an information revolution. The internet and wireless communications, coupled with wide-spread use of mobile devices and related technologies, have transformed the way business is done and how value is delivered.
Key Points
- In today's connected and information-rich world, customers are regularly introduced to new ways of using real-time information to save time and money; and DOTs are expected to take advantage of and use technology to improve efficiency and service.
- The DOT's customers – that is, the traveling public – expect that the products they use and the technologies they encounter will be "smart" and will ultimately improve their travel experience, They also expect that the information received will be accurate and reliable – regardless of who "owns" the road or the information.
- Moreover, technology will likely have an even greater impact on the transportation network in the future. We are watching a new era of transportation emerge through the Connected Vehicle program that that allows cars and infrastructure to communicate with one another. And a week doesn't pass without some news article on the future of autonomous vehicles. How these future technologies may impact how we manage and operate the transportation network is mind-boggling.
Slide 7. Customer Expectations and Needs are Changing
Content
- Public's expectations of government
- Increased productivity and efficiency
- Greater demand for accountability – value expected from the use of tax and toll dollars
- Improved performance and service for commuter, freight, recreational, and other trips
- Mobility, including reduced delays and congestion
- Safety
- Accurate, timely, and accessible information
- Reliability (a focus of SHRP2 program)
Notes
Description of the Slide
As already noted, advances in technology and the availability of real-time information have increased the DOT's customers' expectations.
Key Points
- Technology has been harnessed by the private sector to improve productivity; and the same is expected (and is well underway) for government entities.
- A part of these increased expectations is a greater demand for accountability – that customers are receiving value for their tax dollars and tolls.
- Additionally, DOT customers are expecting improvements in mobility, safety, information, and reliability.
- With respect to the last point; congestion is an accepted and even predictable reality in major urban areas. So the real source of frustration for users and lost productivity for businesses comes from unexpected delays that are encountered because of crashes, special events, unanticipated work zones, extreme weather, and the like. The reliability of the transportation system has come to be at least as important as travel time itself.
Other – There is a "reliability" slide in the "parking lot" at the end of the presentation, and can be used next if the audience may not be aware of what the term "reliability" actually means.
Slide 8. Performance Measures
Content
Element of Increased Accountability
"The game gets serious when you start to keep score!"
Emphasized in MAP 21
Goals and associated measures being established for:
- Safety
- Infrastructure Condition
- Congestion Reduction
- System Reliability
- Freight Movement and Economic Vitality
- Environmental Sustainability
- Reduced Project Delivery Delays
Notes
Description of the Slide
The increased emphasis on government accountability and transparency has focused more attention on measuring and reporting on performance. MAP-21 and FHWA emphasize the use of measurable objectives and associated performance metrics.
Key Points
- Performance measurement for transportation has been gaining traction the past several years. In essence:
- If you don't measure results, you can't tell success from failure.
- If you can't see success, you can't reward it.
- If you can't see failure, you can't correct it.
- In other words, you can't manage it unless you measure it!
- Under the requirements of MAP 21, we are beginning the process of "keeping score." Goals and associated performance measures are being developed for several transportation categories.
Other – Prior to the presentation, the presenters should check on the current status of the FHWA effort to develop and publish performance measures under the MAP 21 requirement (e.g., in the Federal Register for comment).
Slide 9. Increasing Financial Constraints
Content
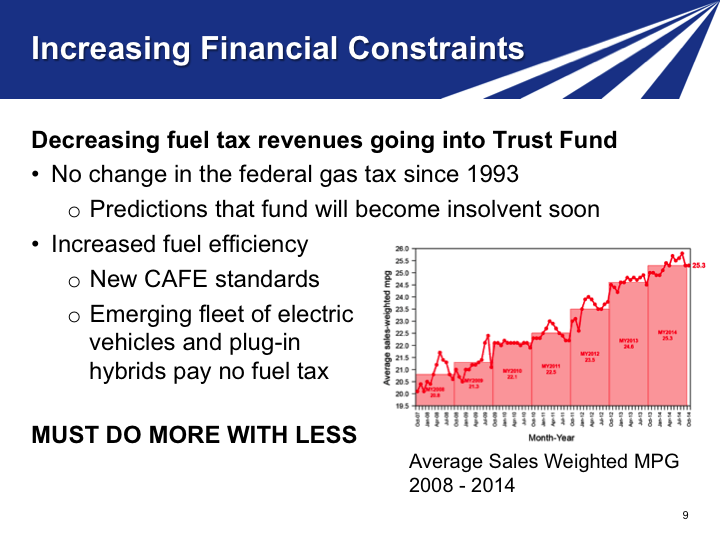
Decreasing fuel tax revenues going into Trust Fund
- No change in the federal gas tax since 1993
- Predictions that fund will become insolvent soon
- Increased fuel efficiency
- New CAFE standards
- Emerging fleet of electric vehicles and plug-in hybrids pay no fuel tax
MUST DO MORE WITH LESS
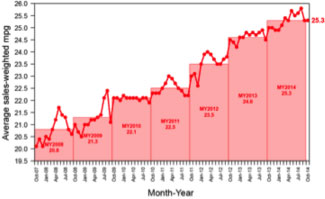
Figure 9: Graph: Average sales weighted miles per gallon 2008-2014, showing a steady increase in miles per gallon from 20.8 in 2008 to 25.3 in 2014.
Notes
Description of the Slide
The need to meet growing customer expectations for mobility and safety, increased accountability, and the associated performance management requirements are all converging at a time of reduced financial resources for most transportation agencies.
Key Points
- The Highway Trust Fund, which was so instrumental in the construction of the Interstate Highway System and other transportation improvements, is running out of money, with current predictions that the transportation fund will become insolvent in the coming next year.
There are several reasons for this:
- The last increase in the federal gas tax was over 20 years ago, and inflation has significantly reduced its purchasing power.
- Cars have become more fuel efficient, and will continue to do so in accordance with current Corporate Average Fuel Economy (CAFE) standards (average 35.5 mpg in 2016; average 54.4 mpg in 2025). This means less tax paid per miles driven, with electric vehicles paying no gas tax at all.
- Technology allows many of us to be virtual commuters. The recent recession and high gas prices also reduced the amount of driving, further reducing the amount of gas tax taken in.
- Several initiatives are underway to find a long-term solution to the declining gas tax revenues; but for the foreseeable future, many agencies will likely need to do more and satisfy rising customer expectations with less.
Other – It would be worthwhile to determine the state's gas tax(es), the history of increases, and any initiatives underway to provide a more sustainable funding mechanism. See http://www.api.org/~/media/files/statistics/state-motor-fuel-excise-tax-update-jan-2015.pdf for one resource.
Source of Graph – University of Michigan Transportation Research Institute (http://www.umich.edu/~umtriswt/EDI_sales-weighted-mpg.html).
Slide 10. Operations Can Help Address These Challenges
Content
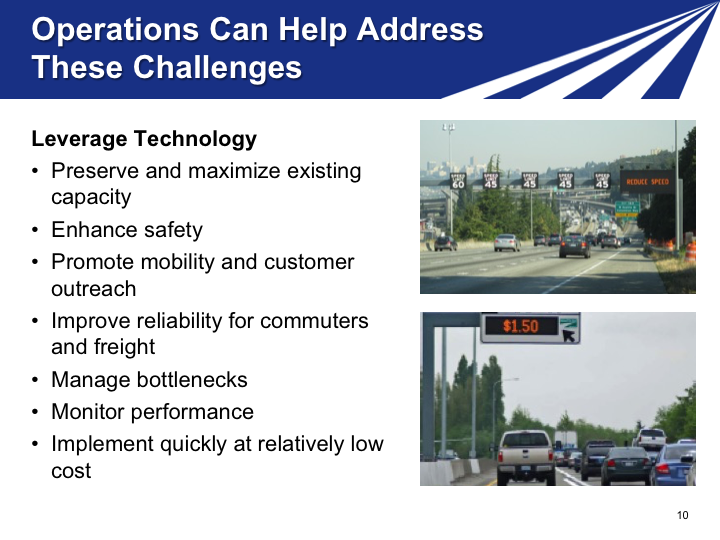
Leverage Technology
- Preserve and maximize existing capacity
- Enhance safety
- Promote mobility and customer outreach
- Improve reliability for commuters and freight
- Manage bottlenecks
- Monitor performance
- Implement quickly at relatively low cost
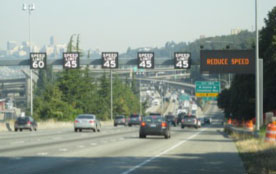
Figure 10: Photo: Highway showing signage for dynamic speed limits and queue warning.
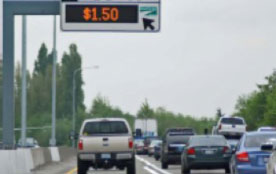
Figure 11: Photo: Highway showing dynamic signage for toll fees.
Notes
Description of the Slide
Given the many challenges facing DOTs – increased customer expectations and accountability, financial constraints, and the limitations on the provision of significant new capacity – it is increasingly important to leverage technology and operate the existing network to its fullest service potential, essentially "taking back" the available capacity lost to congestion, incidents, construction, weather, etc. A robust transportation systems management and operations program can help a DOT address all of these challenges; turning them into opportunities for meeting customer needs in a cost-effective manner.
Key Points
- A major selling point for an increased emphasis on operations is that these strategies and supporting ITS technologies go to the heart of what DOTs want and need to deliver today. Operations investments lead to:
- More efficient and effective use of the existing capacity;
- A safer system for travelers and responders to traffic incidents;
- Enhanced customer mobility and outreach via state-of-the-art technologies;
- More reliable service for commuters and shippers, thereby enhancing economic competitiveness;
- And, in many instances, the opportunity to alleviate bottlenecks without new construction (e.g., ramp metering, hard shoulder running).
- The same data collected to support operations can also be used as part of a performance management program.
- The benefits from operations can happen more quickly than the process to build new lanes (from planning to construction) and at a relatively low cost with great benefit-cost ratios.
Slide 11. Traditional Approach to Managing Transportation
Content
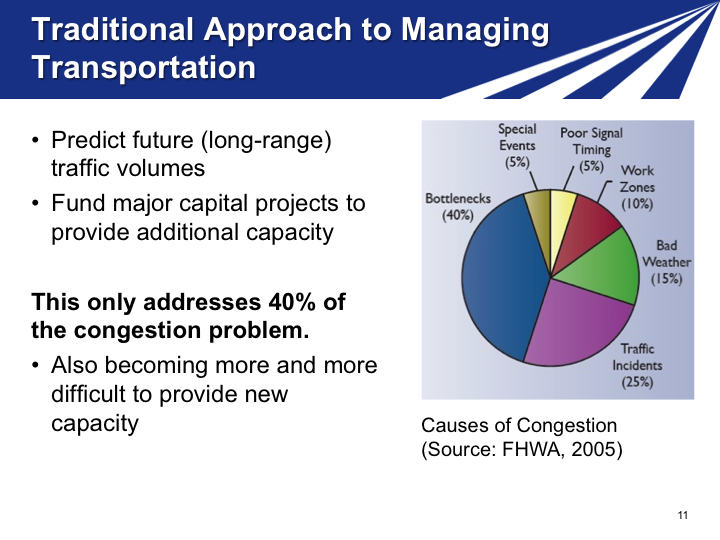
- Predict future (long-range) traffic volumes
- Fund major capital projects to provide additional capacity
This only addresses 40% of the congestion problem.
- Also becoming more and more difficult to provide new capacity
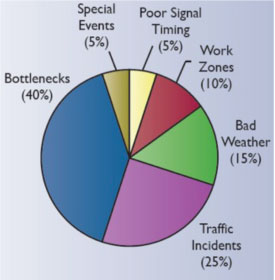
Figure 12: Chart: Pie chart showing causes of congestion (Source: FHWA, 2005). Bottlenecks at 40%; special events at 5%; poor signal timing at 5%; work zones at 10%; bad weather at 15%; and traffic incidents at 25%.
Notes
Description of the Slide
Historically, DOTs have focused on relieving the causes of recurring congestion, such as bottlenecks and other capacity constraints. In large metropolitan areas, however, more than half of the total delay and most of system unreliability result from disruptions and incidents – what is referred to as non-recurring congestion – which is not substantially dealt with by adding new capacity.
Key Points
- The relationships among types and causes of congestion and mobility may not be widely appreciated.
- The traditional approach of adding capacity to meet current and future demands only addresses part of today's mobility, reliability, and safety issues.
- Most congestion and delays are the result of "non-recurrent" causes as shown, such as crashes, weather, and construction activities – events that additional capacity does not directly address.
- Additionally, it is becoming more difficult to provide new capacity given current financial constraints and environmental concerns.
Source of Information in Graph
Slide 12. Benefits from Operations
Content
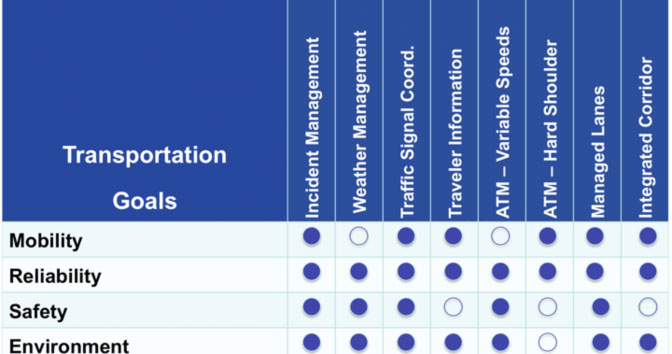
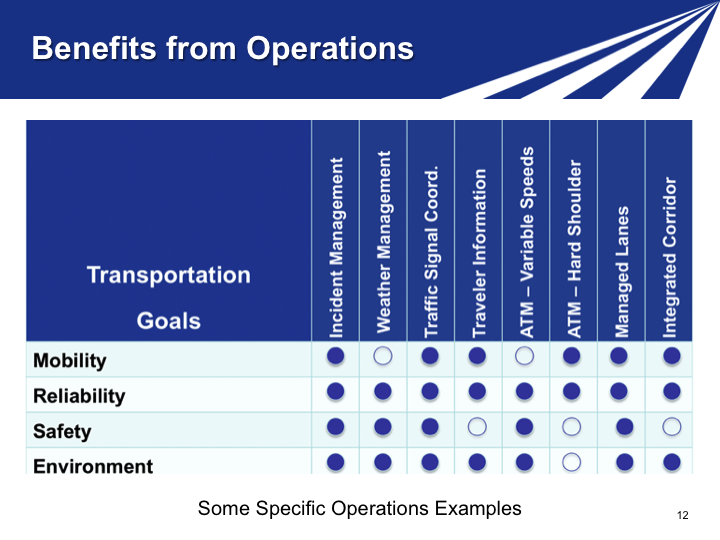
Figure 13: Table: The following transportation goals of Mobility, Reliability, Safety, and the Environment are rows in a table showing binary values for the following columns: Incident Management, Weather Management, Traffic Signal Coordination, Traveler Information, ATM - Variable Speeds, ATM - Hard Shoulder, Managed Lanes, and Integrated Corridor.
Notes
Description of the Slide
Many DOT vision or mission statements include mobility, reliability, safety, and environmental goals. This is also the case for long-range regional transportation plans.
Key Points
- The various operations strategies can significantly contribute to the achievement of all of these and other related transportation goals and objectives.
- A filled circle indicates that the specific operations strategy fully contributes to the associated goal, and an open circle indicates a partial (but still positive) contribution.
Other – Perhaps check the vision / mission statement of the DOT where this slide is being presented, and use the exact language vis-a-vis mobility, reliability, safety, etc.
The next 11 slides (#14 - #24) provide more detailed information and example benefits on specific operational strategies. It is not necessary to use all of these or, depending on time, any of them. The presenter may consider choosing a subset of strategies that are of particular interest to the specific DOT and its management, providing a few local anecdotes of operations successes that the DOT has achieved.
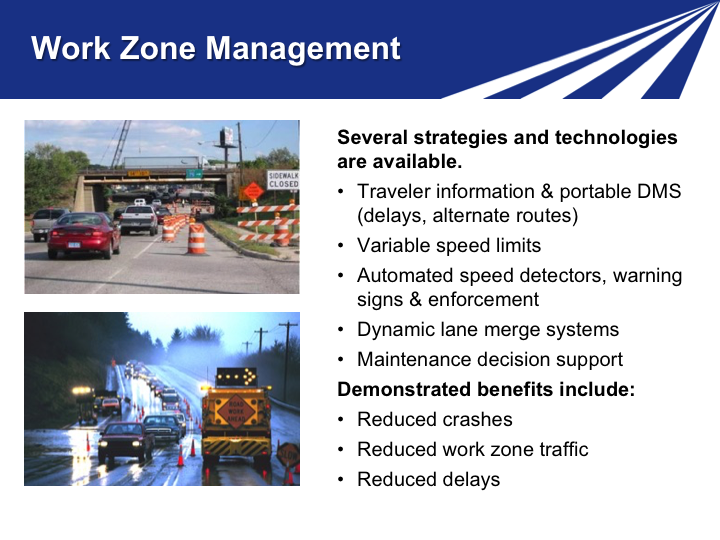
Slide 13. Work Zone Management
Content
Several strategies and technologies are available.
- Traveler information & portable DMS (delays, alternate routes)
- Variable speed limits
- Automated speed detectors, warning signs & enforcement
- Dynamic lane merge systems
- Maintenance decision support
Demonstrated benefits include:
- Reduced crashes
- Reduced work zone traffic
- Reduced delays
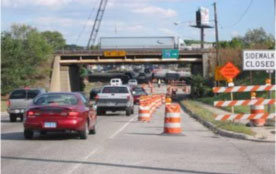
Figure 14: Photo: Roadway with restricted lane for construction.
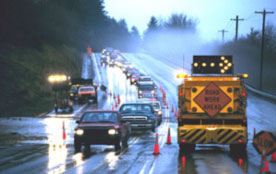
Figure 15: Photo: Roadway with restricted lane and signage for Road Work Ahead.
Notes
Description of the Slide
Work zone activities are a good example of how every state is already performing basic elements of an operations program. For years, this program may have been labeled "maintenance." But how it's done today is a true measure of how improved operations thinking is taking root. For example, many of these maintenance activities are now completed during off-peak hours because of their impact on the traveling public.
Key Points
- Working at off-peak periods and the use of cones, barrels, arrow signs, and related equipment are just the beginning of the operations concept as applied to work zone activities.
- Work zone management may be one of the most visible activities that a DOT does; and your performance in terms of providing up-to-date relevant information, keeping traffic moving, and minimizing backups is judged every day. Of course, the safety of the workers and of the drivers traveling through the work zone is also of primary importance.
- Proactively applying operations strategies such as traveler information on delays and alternate routes, variable speed limits and warning signs, and lane merge systems to work zone management activities can result in significant benefits.
- These benefits may include reduced crashes in and along the approaches to the work zones, reduced traffic through the work zone, and reduced delays by using alternative routes and modes.
Other – Perhaps provide a local / near-by example of the benefits. Additional information on benefits is available from the US DOT Benefits Database (https://www.itsbenefits.its.dot.gov/); select "Roadway Operations and Maintenance" application.
Slide 14. Traffic Incident Management (TIM)
Content
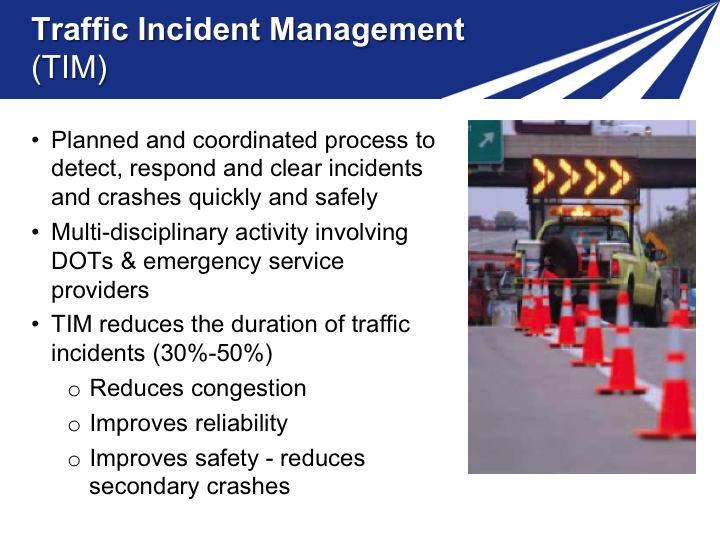
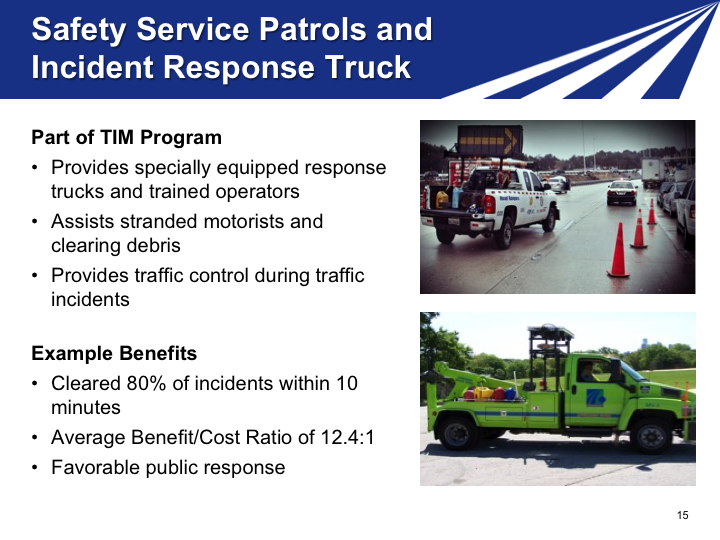
- Planned and coordinated process to detect, respond and clear incidents and crashes quickly and safely
- Multi-disciplinary activity involving DOTs & emergency service providers
- TIM reduces the duration of traffic incidents (30%-50%)
- Reduces congestion
- Improves reliability
- Improves safety - reduces secondary crashes
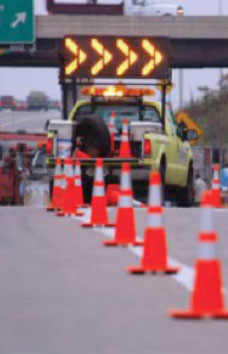
Figure 16: Photo: Roadway with restricted lane indicated by traffic cones and signaling truck.
Notes
Description of the Slide
Traffic Incident Management (TIM) is defined as the systematic, planned, and coordinated use of human, institutional, and technical resources to reduce the duration and impact of incidents, and improve the safety of motorists, crash victims, and incident responders.
Key Points
- By systematically reducing the time to detect an incident (such as a crash); implement the appropriate response; and safely clear the incident, while managing the affected flow until full capacity is restored, TIM increases the operating efficiency, safety, and mobility of the transportation network.
- Successful traffic incident management requires a multi-disciplinary and multi-agency approach. It helps develop strong partnerships across multiple departments within the agency, and also between transportation and enforcement agencies, fire and rescue, emergency medical services, towing services, and environmental agencies in both rural and urban areas.
- Traffic incident management has proven time and again to be one of the easiest and most direct paths to significant reduction in delay, an improvement in travel-time reliability, and improving the standing of DOT with its customers.
Other – Perhaps mention the SHRP2 National Traffic Incident Management Responder Training program, which is building a cadre of well-trained responders who can work together as a team in a coordinated manner.
Sources of Benefit Information
Slide 15. Safety Service Patrols and Incident Response Truck
Content
Part of TIM Program
- Provides specially equipped response trucks and trained operators
- Assists stranded motorists and clearing debris
- Provides traffic control during traffic incidents
Example Benefits
- Cleared 80% of incidents within 10 minutes
- Average Benefit/Cost Ratio of 12.4:1
- Favorable public response
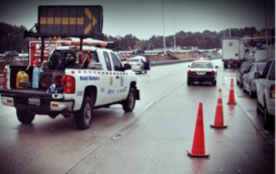
Figure 17: Photo: Roadway with restricted lane (due to an incident) indicated by traffic cones and signaling incident response truck.
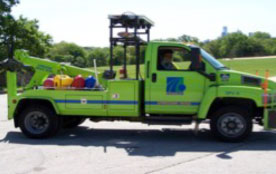
Figure 18: Photo: Roadside assistance vehicle.
Notes
Description of the Slide
Incident response trucks – also known as safety service patrols – are among the most visible goodwill ambassadors a DOT can have.
What citizen won't say that tax money is well spent when a service truck operator comes along to help fix a flat tire, give a couple of gallons of gas, or provide a bit of stability during an otherwise dangerous roadside stop?
Key Points
- An integral part of a broader TIM program:
- For addressing minor incidents such as stranded motorists and debris on the roadway,
- To direct traffic around incidents, and
- To provide the human touch to travelers in need.
- Helping with traffic control at a crash scene also enhances safety for other responders.
- Significant benefits for the dollars spent, plus the positive public relations aspect.
Sources of Benefit Information
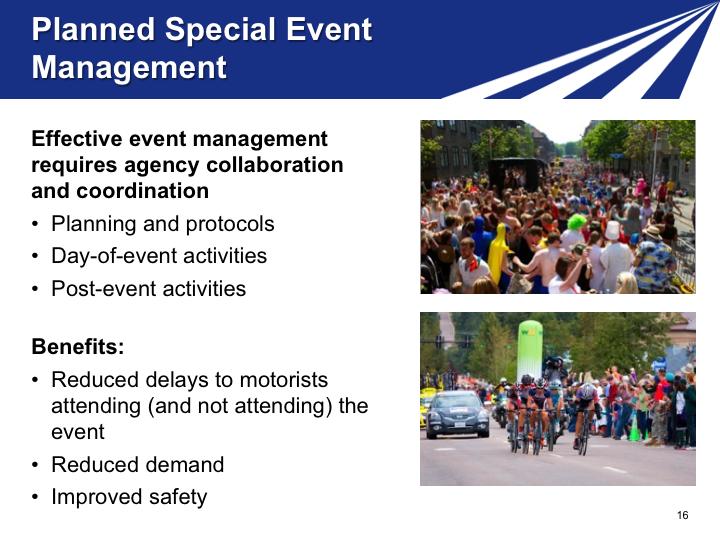
Slide 16. Planned Special Event Management
Content
Effective event management requires agency collaboration and coordination
- Planning and protocols
- Day-of-event activities
- Post-event activities
Benefits:
- Reduced delays to motorists attending (and not attending) the event
- Reduced demand
- Improved safety

Figure 19: Photo: Celebratory crowd of people on a street closed for a special event.

Figure 20: Photo: Bicyclists competing in a race on a street closed for the event.
Notes
Description of the Slide
Major sporting events, festivals, concerts, street fairs, and the like can be great for the regional economy; but they can also back up ramps and intersections, block lanes, and cause significant congestion. The concept of managing event traffic to minimize delays and disruption is a time-tested powerful tool that can also bring a lot of good publicity and visibility to the transportation agency.
Key Points
- This is an area in which collaboration with other transportation agencies – often including enforcement agencies and homeland security – is especially critical and the collaboration payoffs are high.
- Preplanning and "day of" execution for events makes for good operations, followed by post event debriefs and lessons learned.
- Effective event management can involve the combined use of multiple operational strategies and technologies, including incident management; traveler information using radio, dynamic message signs; mobile applications; lane control; and ramp management techniques.
Sources of Benefit Information
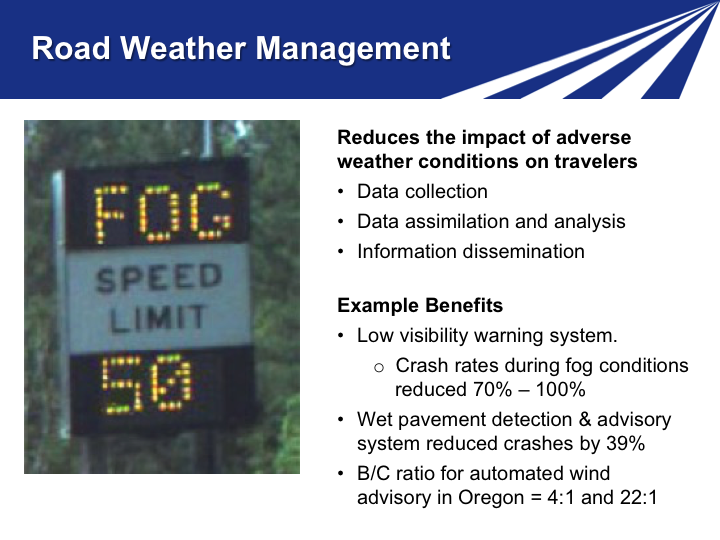
Slide 17. Road Weather Management
Content
Reduces the impact of adverse weather conditions on travelers
- Data collection
- Data assimilation and analysis
- Information dissemination
Example Benefits
- Low visibility warning system.
- Crash rates during fog conditions reduced 70% – 100%
- Wet pavement detection & advisory system reduced crashes by 39%
- B/C ratio for automated wind advisory in Oregon = 4:1 and 22:1
Figure 21: Photo: Dynamic speed limit signage showing reduced speed for fog conditions.
Notes
Description of the Slide
Good operations mean providing the best functioning transportation network even under adverse weather conditions – scenarios that often threaten or haunt the public perception of a DOT's performance.
Key Points
- This a clear example of rural areas depending on operations just as much as do congested urban areas.
- Road weather information systems have proven themselves to be very effective in reducing the variability in speeds and crashes during adverse weather conditions, be they low visibility, wet or icy pavement, or strong winds.
- Road weather information systems (RWIS) include three major activities:
- Collecting real-time data on roadway and atmospheric conditions;
- Assimilating this information with other data sources (such as weather forecasts) to determine the appropriate operational plan; and,
- Implementing the plan through information dissemination.
- Much, if not all of this process, can be automated.
Sources of Benefit Information
Slide 18. Emergency Management
Content
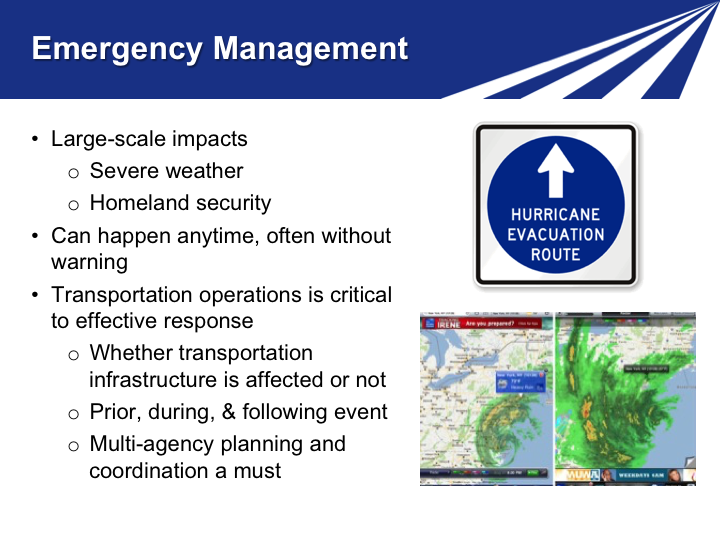
- Large-scale impacts
- Severe weather
- Homeland security
- Can happen anytime, often without warning
- Transportation operations is critical to effective response
- Whether transportation infrastructure is affected or not
- Prior, during, & following event
- Multi-agency planning and coordination a must
Figure 22: Photo: Standard signage for Hurricane Evacuation Route.
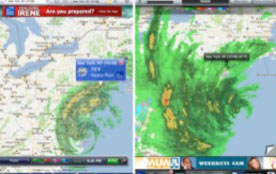
Figure 23: Photo: Maps showing hurricane tracking photos.
Notes
Description of the Slide
Some weather events are extreme with regional and statewide impacts, such as hurricanes, major snow events and blizzards, and flooding. Unfortunately, we also live at a time when major emergencies are often man-made, such as security threats. Operations has a role to play in the management of such emergencies.
Although large-scale and catastrophic incidents are rare, it is clear that even seemingly small improvements in efficiency or effectiveness that are used to respond to traditional incidents can translate into dramatic life-saving strategies when implemented in catastrophic events.
Key Points
- Such emergencies have wide area impacts, and so the associated collaboration and coordination needs to be regional, state-wide, and often multi-state, involving numerous transportation and transit agencies along with enforcement entities, fire and rescue, FEMA, and homeland security, just to name a few.
- The time to plan for any specific emergency, location, and duration is very limited or non-existent. It is therefore necessary to plan for several potential emergency scenarios in advance.
- Whether or not segments of transportation infrastructure are directly affected, their use may still be vital.
- The emergency scenarios need to address operations prior to the event (e.g., evacuations in the event of a hurricane), during the event (e.g., quick access to the impacted area by incident responders and other emergency service providers), and following the event (e.g., diversions to avoid damaged or unusable segments of the transportation network, evacuated individuals getting back to their homes and work to resume some semblance of normality as quickly as possible).
Sources of Benefit Information
Slide 19. Traffic Signal Synchronization
Content
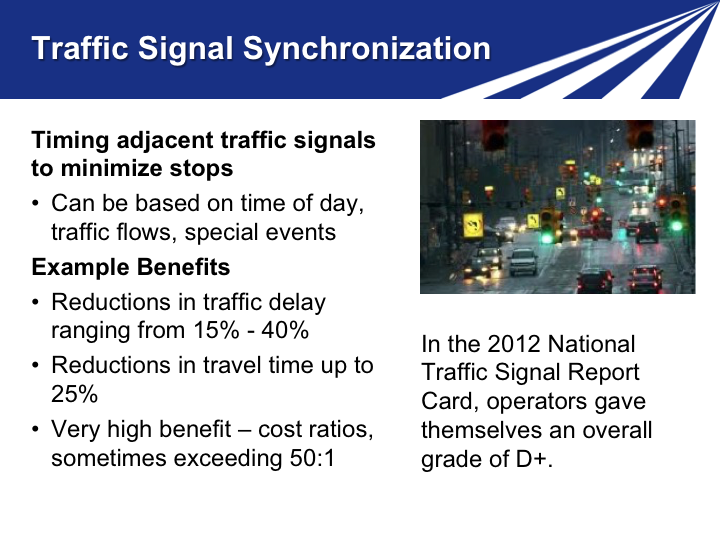
Timing adjacent traffic signals to minimize stops
- Can be based on time of day, traffic flows, special events
Example Benefits
- Reductions in traffic delay ranging from 15% - 40%
- Reductions in travel time up to 25%
- Very high benefit – cost ratios, sometimes exceeding 50:1
In the 2012 National Traffic Signal Report Card, operators gave themselves an overall grade of D+.
Figure 24: Photo: Arterial roadway with many signalized intersections showing confusing array of traffic signals on a rainy day.
Notes
Description of the Slide
Poor traffic signal timing contributes to traffic congestion and delay. Conventional signal systems use pre-programmed, daily signal timing schedules. Adaptive signal control technology adjusts the timing of red, yellow, and green lights in real time to accommodate changing traffic patterns and ease traffic congestion.
Key Points
- Customers understand that it can be done. They are happy when they see it and grumpy when they don't.
- The improved arterial operations and benefit-cost returns in this area are very favorable. But well-synchronized signals need close attention and the ability to make dynamic adjustments.
- Synchronization across jurisdiction boundaries can also be very important, but this requires collaboration to achieve integration across different hardware and software platforms.
- While study after study has shown significant benefits from improved synchronization of traffic signals, there is industry-wide information indicating that we are not doing as well as we should, as demonstrated by the last National Traffic Signal Report Card (2012), which reported an overall grade of D+. This report card should give us pause. The industry is not delivering at the level it should be.
Sources of Benefit Information
Slide 20. Traveler Information
Content
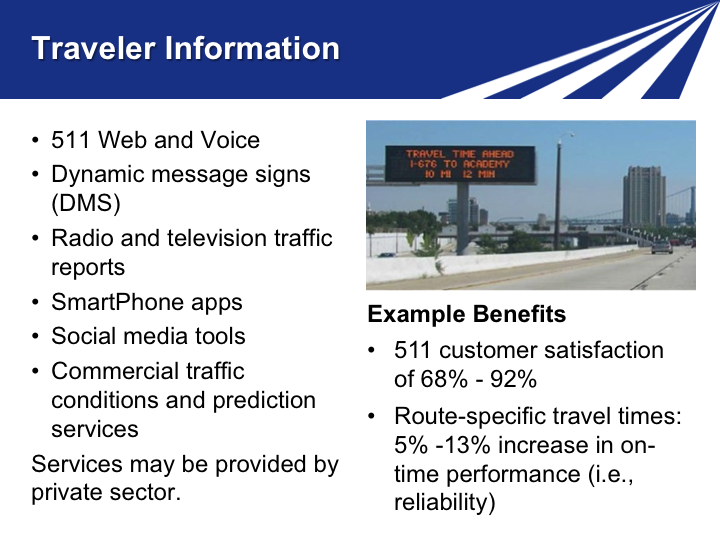
- 511 Web and Voice
- Dynamic message signs (DMS)
- Radio and television traffic reports
- SmartPhone apps
- Social media tools
- Commercial traffic conditions and prediction services
Services may be provided by private sector.
Example Benefits
- 511 customer satisfaction of 68% - 92%
- Route-specific travel times: 5% -13% increase in on-time performance (i.e., reliability)
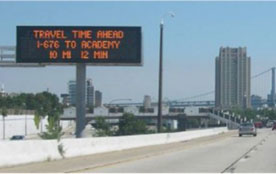
Figure 25: Photo: Roadway dynamic message sign billboard showing mileage and travel time to a downstream interchange with dynamic traffic instructions.
Notes
Description of the Slide
Traveler information has been around for a very long time. Remember highway advisory radio and reflective flip-disc variable message signs?
The field of traveler information has evolved as newer technologies have been developed, and is now rapidly expanding with the emergence of smart phone applications, private vendors, social media, and visualization tools.
Key Points
- There has been a virtual explosion in customer interest, acceptance, and expectations in the area of traveler information.
- Social media and applications for mobile devices are taking over the realm of traveler information like so many communication areas.
- DOTs have been partnering with radio and TV traffic reports for years. Now, private vendors are seizing the opportunity.
- Traveler information provides numerous benefits, and is an essential component of many other operations strategies such as incident management, special event management, variable speed limits, and queue warnings as part of active traffic management and integrated corridor management for diverting traffic between parallel networks within a corridor.
- Research has shown that travel information can influence not only the choice of routes but the choice of modes, which in some cases saves 20 minutes in travel time.
Sources of Benefit Information
Slide 21. Ramp Management
Content
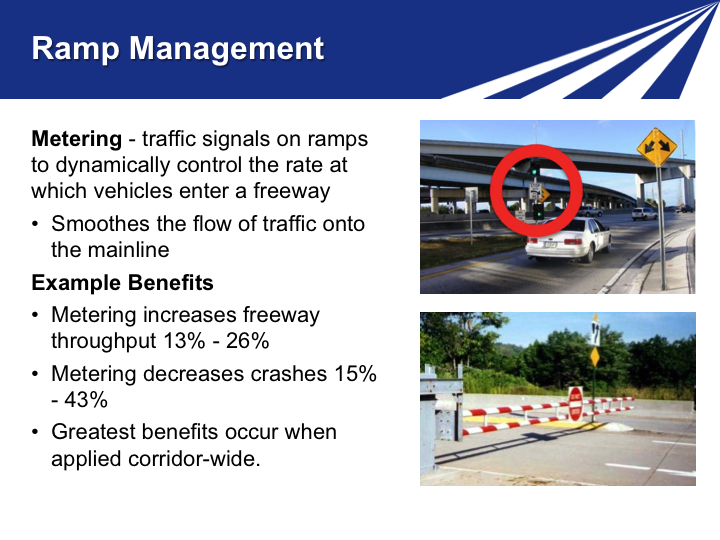
Metering - traffic signals on ramps to dynamically control the rate at which vehicles enter a freeway
- Smoothes the flow of traffic onto the mainline
Example Benefits
- Metering increases freeway throughput 13% - 26%
- Metering decreases crashes 15% - 43%
- Greatest benefits occur when applied corridor-wide.
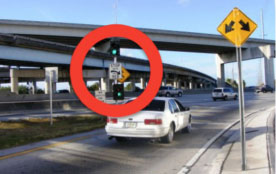
Figure 26: Photo: Automobile about to enter freeway at a metered ramp, and responding to a green light on ramp signal (circled in red).
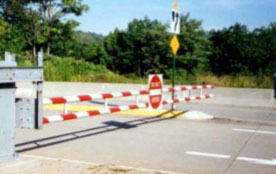
Figure 27: Photo: Retractable barricade to signal Do Not Enter for reversible express lanes.
Notes
Description of the Slide
Ramp management includes ramp metering as well as ramp closures. Ramp metering – which represents the widest application of ramp management strategies – involves the deployment of traffic signals on ramps to dynamically control the rate at which vehicles enter a freeway facility. This, in essence, smoothes the flow of traffic onto the mainline, allowing efficient use of existing freeway capacity. Ramp metering provides mobility and safety benefits.
Key Points
- Ramp metering has been successfully deployed in over 20 metropolitan areas in the US, providing significant benefits in terms of reducing overall travel delays and reducing crashes, particularly those occurring in the merge and weaving areas.
- The greatest benefits come with a corridor-wide implementation of metering, where the metering rates are based on real-time traffic flows along the entire stretch of the freeway, not just in the vicinity of individual ramps.
- The introduction of ramp metering can be controversial; but there are approaches to minimize this potential issue, such as changing the metering rates so ramp queues do not back up onto arterial streets, providing bypass lanes for transit and HOVs, and a public outreach program.
Sources of Benefit Information
- "Ramp Management and Control Handbook"; FHWA-HOP-06-001. Perhaps provide a local / near-by example of the benefits.
- US DOT Benefits Database (https://www.itsbenefits.its.dot.gov/); select "Freeway Management" application, scroll down to "Ramp Control".
Slide 22. Active Transportation and Demand Management (ATDM)
Content
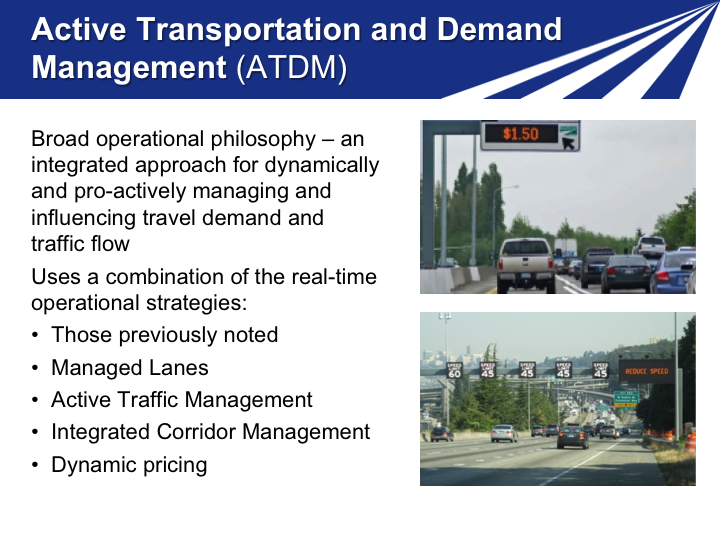
Broad operational philosophy – an integrated approach for dynamically and pro-actively managing and influencing travel demand and traffic flow
Uses a combination of the real-time operational strategies:
- Those previously noted
- Managed Lanes
- Active Traffic Management
- Integrated Corridor Management
- Dynamic pricing
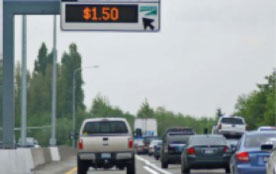
Figure 28: Photo: Highway showing dynamic signage for toll fees.
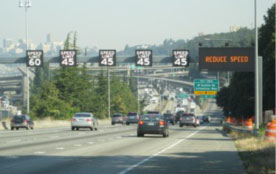
Figure 29: Photo: Highway showing dynamic speed limits in each lane.
Notes
Description of the Slide
Active Transportation and Demand Management (or ATDM) is the new frontier of operations – the next step in congestion management. ATDM is not a specific operational strategy, but a broad operational philosophy incorporating an integrated approach for dynamically and pro-actively managing and influencing travel demand and traffic flow.
Key Points
- ATDM is a overall approach to operations, encompassing several existing and recently introduced strategies applied in an integrated and dynamic manner. Some of the more recent operations strategies that fall under the ATDM umbrella include:
- Managed Lanes, such as the High Occupancy Toll (HOT) lanes in Minneapolis – shown in the top picture – in which non-HOVs can use the designated lane by paying a toll, with the toll adjusted in real time to manage demand.
- Active Traffic Management (ATM), including variable speed limits and dynamic lane assignment such as shown in the bottom picture as recently deployed in the Seattle area.
- Integrated Corridor Management (ICM), which involves the operational coordination of multiple transportation networks and cross-network links within a corridor.
- Dynamic pricing of parking, roadways, bridges and tunnels.
- ATDM is not some future vision. These strategies are being deployed in Europe and the United States with substantial benefits in terms of safety, mobility, and reliability.
Other – If desired (e.g., the DOT is specifically interested or is pursuing some of these advance operations strategies), individual slides on Managed Lanes, ATM and ICM are provided in the parking lot at the end of the presentation. Additional information on ATDM may be obtained at: https://ops.fhwa.dot.gov/atdm/about/index.htm.
Slide 23. Connected Vehicles and the Future
Content
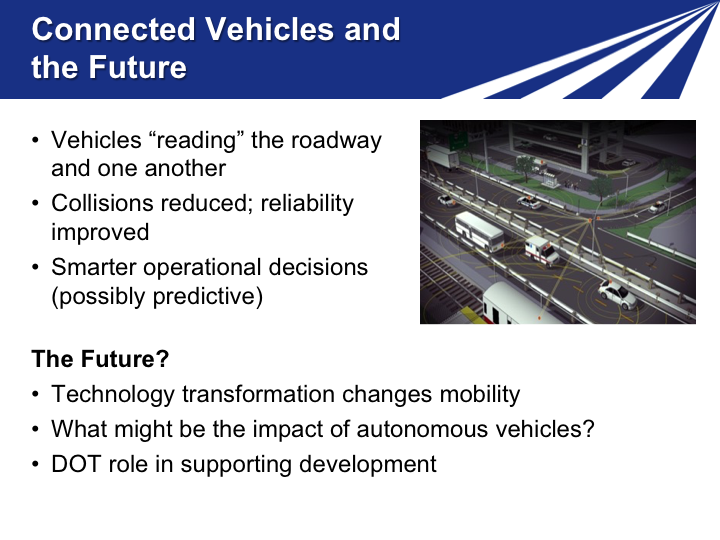
- Vehicles "reading" the roadway and one another
- Collisions reduced; reliability improved
- Smarter operational decisions (possibly predictive)
The Future?
- Technology transformation changes mobility
- What might be the impact of autonomous vehicles?
- DOT role in supporting development
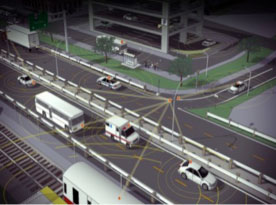
Figure 30: Photo: Rendering of smart communications and connectivity among vehicles on a street grid.
Notes
Description of the Slide
"Connected Vehicles" is a program focusing on technologies that make vehicles aware of one another as well as of important roadway features so they can work together to avoid crashes and improve traffic flow.
Key Points
- This is the new frontier where the Internet and wireless technologies will have major transformative effects in how traffic operates and the associated mobility and safety issues.
- Connected Vehicles provide the capability to identify threats and hazards on the roadway, including other vehicles, and communicate this information over wireless networks to give drivers alerts and warnings.
- This connectivity offers the opportunity to know much more about traffic and roadway conditions than ever before. This information could lead to improved traffic signal controls, ubiquitous traveler information, better transportation planning, and reduced cost for existing transportation data collection methods.
- It may enable a paradigm shift in the way DOTs leverage resources into better maintenance and asset management practices.
- This is a "frontier" that is not very far away in time. Many connected vehicle components are already being tested and implemented.
- Transportation agencies should be aggressive in preparing for the Connected Vehicle future, as well as for the next potential future of automated vehicles.
Other – Additional information may be obtained at https://www.its.dot.gov/connected_vehicle/connected_vehicle_research.htm.
Slide 24. Reaching Full Potential of Operations
Content
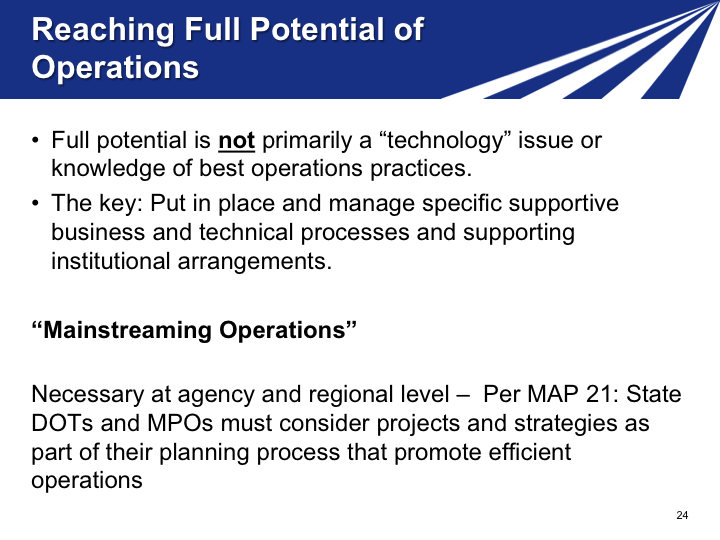
- Full potential is not primarily a "technology" issue or knowledge of best operations practices.
- The key: Put in place and manage specific supportive business and technical processes and supporting institutional arrangements.
"Mainstreaming Operations"
Necessary at agency and regional level – Per MAP 21: State DOTs and MPOs must consider projects and strategies as part of their planning process that promote efficient operations
Notes
Description of the Slide
Reaching the full potential for operations is more than having an understanding of various operations strategies and supporting technologies, or implementing a number of often disparate ITS-related projects. Operations needs to become a formal core function of the DOT in the same manner as current construction and maintenance activities.
Key Points
- The key to having a successful operations environment is to integrate or "mainstream" operations strategies into the agency's institutional framework and corresponding business processes.
- In order for this to occur, planning, funding, design, contracting and implementation, and on-going management must consider and include operations in daily activities across all divisions of the agency, and at all stages of the process.
- This mainstreaming is also necessary at the regional level with operations being an integral part of the formal transportation planning and congestion management planning processes.
- MAP 21 requires this agency and regional integration of operations into the planning processes.
Slide 25. Key Leadership Questions for Mainstreaming Operations
Content
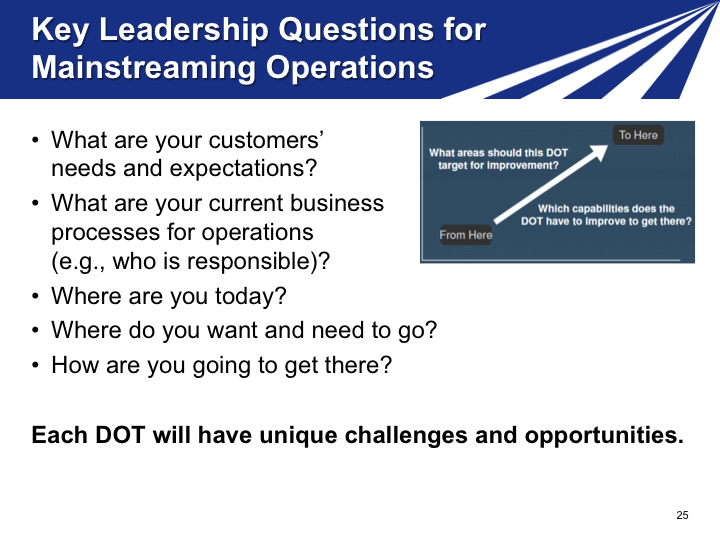
- What are your customers' needs and expectations?
- What are your current business processes for operations (e.g., who is responsible)?
- Where are you today?
- Where do you want and need to go?
- How are you going to get there?
Each DOT will have unique challenges and opportunities.
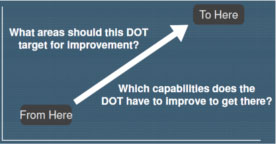
Figure 31: Diagram: Diagram depicts an upward arrow from 'What areas should this DOT target for improvement' on the left to 'Which capabilities does the DOT have to improve to get there?' on the right.
Notes
Description of the Slide
To mainstream operations and enhance the contribution of operations to your organization, you must address five basic questions as matters of executive leadership.
Key Points
- The five basic questions:
- What are your customer's expectations?
- Who is responsible for managing operations?
- Where are you today?
- Where do you want to go?
- How are you going to get there?
- The answer to the last question involves identifying:
- What areas should this DOT target for improvement, and
- Which capabilities does the DOT have to improve to get there?
- Once you have the answers to these questions, you can then develop a plan for continuous improvement; moving from where you currently are to where you want and need to be.
- Every state DOT will have its own unique mix of needs and opportunities for its operations program that makes sense for that particular state. No matter how good you are, you can always improve.
- This may not always be simple to do; but it will be a very rewarding investment of your leadership time and energy.
Slide 26. Mainstreaming Operations
Content
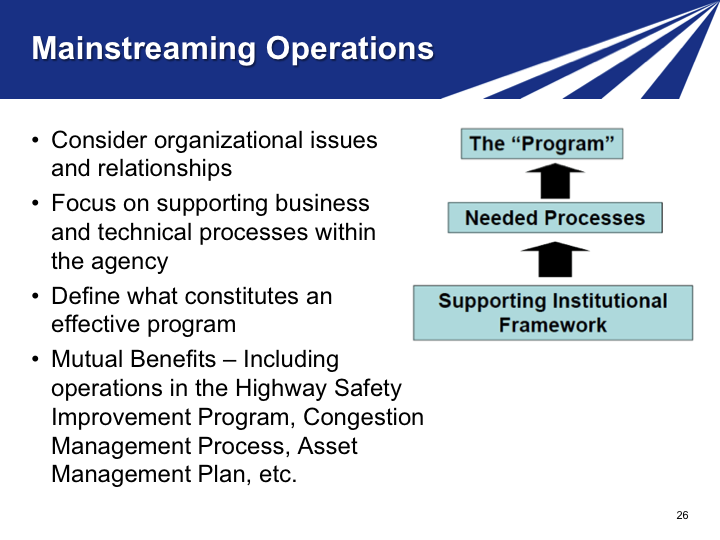
- Consider organizational issues and relationships
- Focus on supporting business and technical processes within the agency
- Define what constitutes an effective program
- Mutual Benefits – Including operations in the Highway Safety Improvement Program, Congestion Management Process, Asset Management Plan, etc.
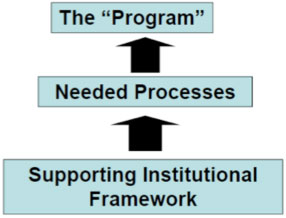
Figure 32: Diagram: Pyramid diagram showing upward movement from 'Supporting Institutional Framework' to 'Needed Processes' to 'The Program'.
Notes
Description of the Slide
Mainstreaming operations means developing and putting into place a supportive institutional framework and organization that leads to the establishment of business and technical processes to create an effective and sustainable operations program.
Key Points
- This is all about continuous improvement in the operation of the transportation network.
- It requires an assessment of organizational issues, and putting into place the supporting business and technical processes within the agency.
- It also requires performance measures and metrics to gauge just how well you are doing.
- This is not done in a vacuum; the operations program should be integrated with other programs such as the congestion management process and asset management (for example, of the supporting ITS hardware and software).
Slide 27. Critical Dimensions for Improved Operations in a DOT
Content
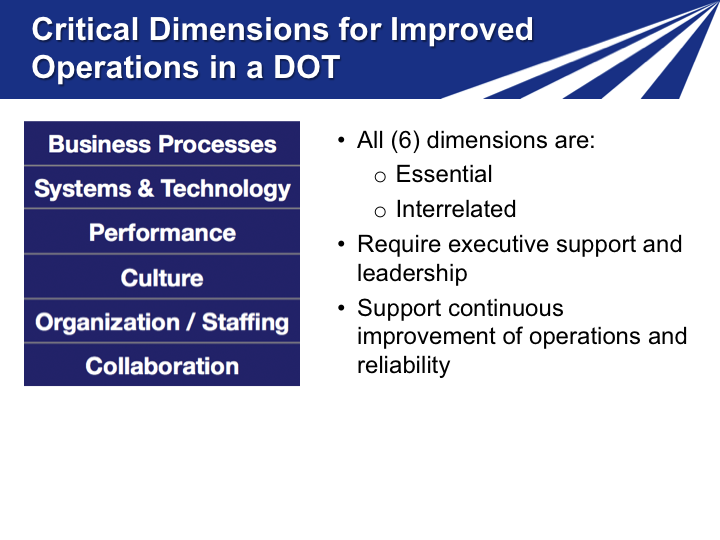
- All (6) dimensions are:
- Require executive support and leadership
- Support continuous improvement of operations and reliability
Figure 33: Table: The list of six dimensions includes: Business Processes, Systems & Technology, Performance, Culture, Organization/Staffing, and Collaboration.
Notes
Description of the Slide
The SHRP2 Organizing for Reliability products (often referred to as L01 and L06) provide a formal procedure to integrate and mainstream operations into an agency's program. These products focus on orienting and improving key business processes within the agency in order to facilitate effective management and operations programs and projects.
Key Points
- Six dimensions of organizational capability have been identified:
- Business Processes – formal scoping, planning and programming, and budgeting.
- Systems and Technology – use of systems engineering, systems architectures, standards (and standardization) and interoperability.
- Performance – defining measures, data acquisition and analytics, and utilization.
- Culture – understanding, leadership, outreach, and program legal authority.
- Organization / Staffing – programmatic status, organizational structure, staff development, recruitment, and retention.
- Collaboration – relationships and partnering among levels of government and with public safety agencies, local governments, MPOs, and the private sector.
- These six dimensions are interrelated, supporting one another.
- Continuous improvement cannot happen without executive support and leadership.
Other – The next two slides define and list the components and activities identified for the six dimensions in the key points (sub-bullets) above. If these next two slides are used, it is not necessary to identify these components and activities as part of this slide; just to mention that six interrelated dimensions have been identified for mainstreaming operations into the institutional framework.
Slide 28. Operations Capability Dimensions
Content
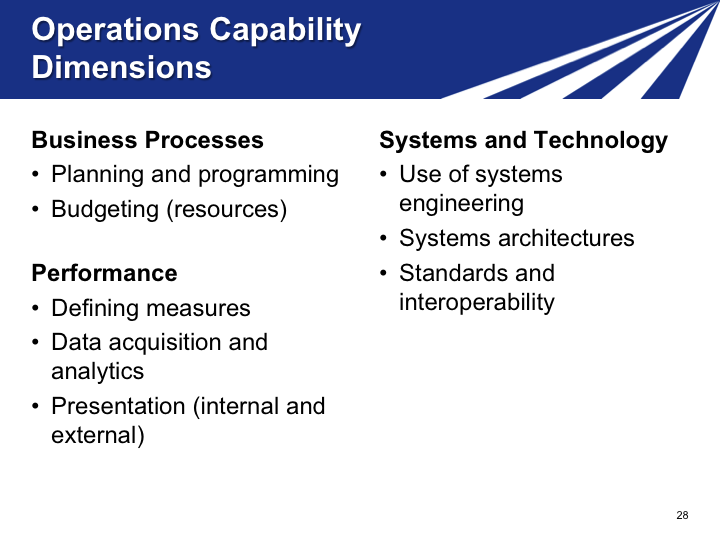
Business Processes
- Planning and programming
- Budgeting (resources)
Performance
- Defining measures
- Data acquisition and analytics
- Presentation (internal and external)
Systems and Technology
- Use of systems engineering
- Systems architectures
- Standards and interoperability
Notes
Description of the Slide
Identifies some of the key components and activities associated with the dimensions of Business Processes, Performance, and Systems and Technology.
Key Points
- Business Processes – planning and programming, budgeting (resources), and project scoping.
- Performance – defining measures, data acquisition and analytics, and utilization including presentation of the results.
- Systems and Technology – use of systems engineering, systems architectures, standards (and standardization) and interoperability.
Slide 29. Operations Capability Dimensions (continued)
Content
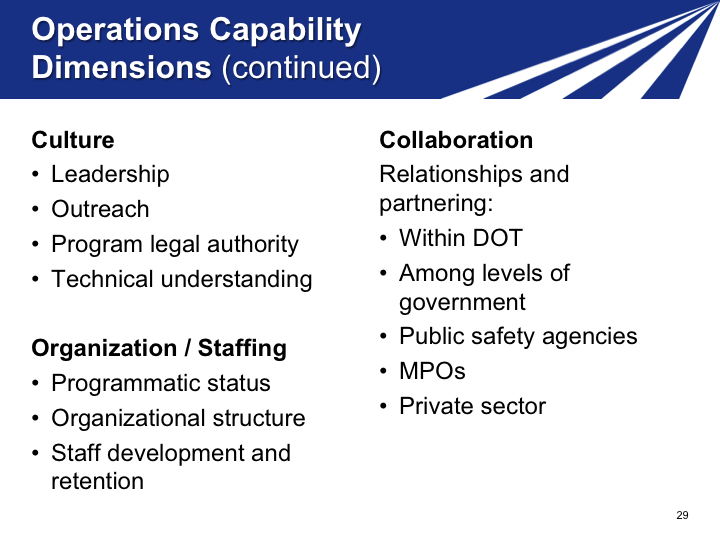
Culture
- Leadership
- Outreach
- Program legal authority
- Technical understanding
Organization / Staffing
- Programmatic status
- Organizational structure
- Staff development and retention
Collaboration
Relationships and partnering:
- Within DOT
- Among levels of government
- Public safety agencies
- MPOs
- Private sector
Notes
Description of the Slide
Identifies some of the key components and activities associated with the dimensions of Culture, Organization and Staffing, and Collaboration.
Key Points
- Culture – technical understanding, leadership, outreach, and program legal authority.
- Organization / Staffing – programmatic status, organizational structure, staff development, recruitment, and retention.
- Collaboration – relationships and partnering among levels of government and with public safety agencies, local governments, MPOs and the private sector.
Slide 30. Levels of Capability Maturity
Content
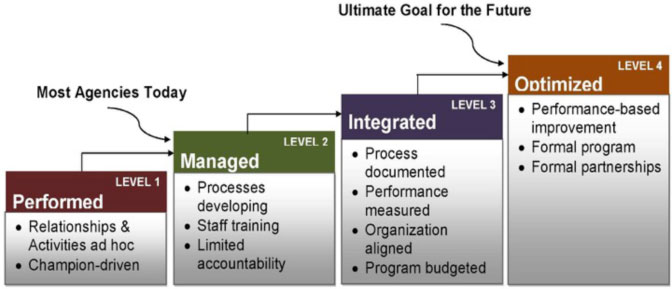
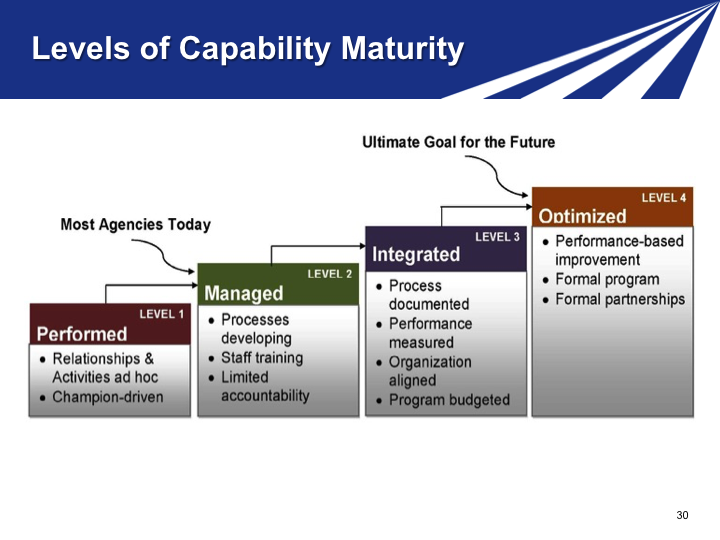
Figure 34: Diagram: Diagram depicts the four steps to mainstream operations into the institutional framework, from Level 1: Performed (informal and based on personal relationships), Level 2: Managed (some processes in place but limited accountability), Level 3: Integrated (processes in place and documented, including performance measures, with operations as a budget item), Level 4: Optimized (formal operations program mainstreamed into DOT). Most agencies today are at Level 2, but the ultimate goal for the future is Level 4.
Notes
Description of the Slide
For each of these six dimensions, four levels of maturity have been defined – where the term "maturity" is related to the degree of formality and optimization of these processes in support of effective operations.
Key Points
- Level 1: Performed – Activities and relationships largely ad hoc, informal, and champion-driven – substantially outside the mainstream of other activities within the transportation agency.
- Level 2: Managed – Basic strategy applications understood; key processes and support requirements identified; key technology and core capacities under development; but limited internal accountability and uneven alignment with external partners. This is where most DOTs are today.
- Level 3: Integrated – Standardized strategy applications implemented in priority contexts and managed for performance; operations-related technical and business processes developed, documented, and integrated into the agency and the regional transportation planning process; partnerships aligned.
- Level 4: Optimized – This represents the ultimate goal, in which operations is addressed as a full, sustainable core agency program, established on the basis of continuous improvement with top-level management status; part of the region-wide program and planning process with formal partnerships will all involved agencies.
Slide 31. Regional Operations Collaboration
Content
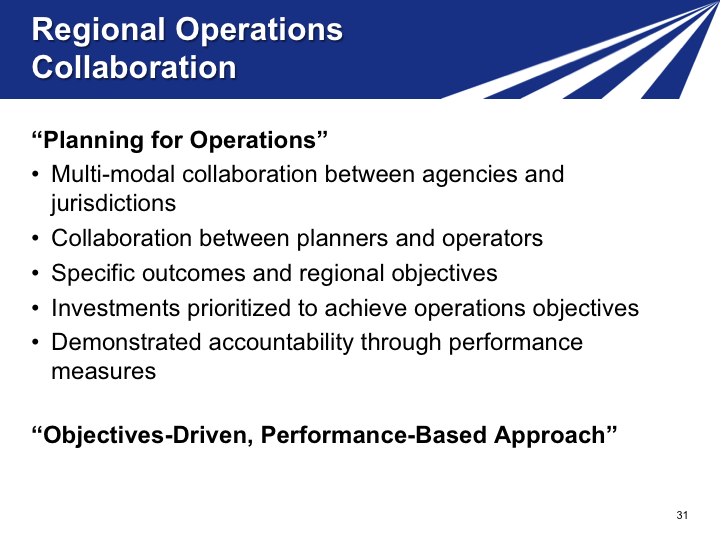
"Planning for Operations"
- Multi-modal collaboration between agencies and jurisdictions
- Collaboration between planners and operators
- Specific outcomes and regional objectives
- Investments prioritized to achieve operations objectives
- Demonstrated accountability through performance measures
"Objectives-Driven, Performance-Based Approach"
Notes
Description of the Slide
Much of the discussion has focused on mainstreaming operations into an individual agency such as a DOT. But to achieve continuous improvement and to fund your agency's operations program and projects, the mainstreaming effort must also address regional planning processes and multi-agency collaboration.
Key Points
- The FHWA refers to this as "planning for operations" – a joint effort between planners and operators to support improved regional transportation system management and operations. It involves the consideration of operations strategies in regional transportation planning – including the integration of operations strategies in the metropolitan transportation plan.
- It requires coordination and collaboration between a number of regional partners, including planning staff and operations staff from metropolitan planning organizations (MPOs), State Departments of Transportation, transit agencies, highway agencies, toll authorities, and local governments.
- The approach to planning for operations is objectives-driven and performance-based. Rather than focusing on projects and investment plans, planning for operations means first developing objectives for transportation system performance, and using outcome-based performance measures and targets as a basis for identifying solutions and developing investment strategies to achieve the operational objectives.
- These same performance measures are used to evaluate how well the strategies are working, make adjustments as may be appropriate, and demonstrate accountability.
Slide 32. Objectives-Driven, Performance-Based Approach
Content
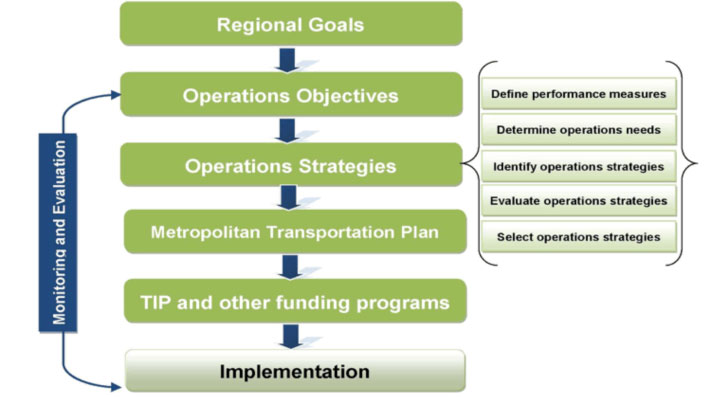
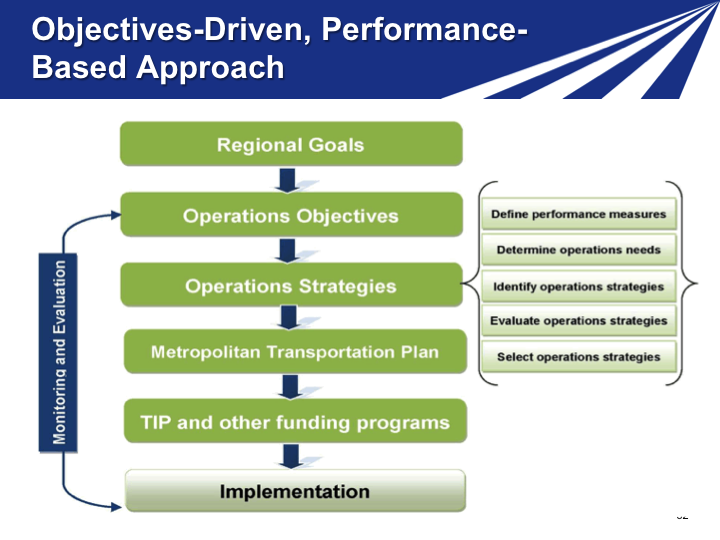
Figure 35: Diagram: Diagram shows six steps of the approach with a feedback loop to monitor and evaluate as well as five detailed steps for the Operations Strategies approach.
Notes
Description of the Slide
This shows an objectives-driven based approach. Traditionally, transportation planning and transportation systems operations have been largely separate, independent activities.
- Planners focused on long-range transportation investments, including development of metropolitan transportation plans and programming of projects.
- Operators were concerned with addressing immediate system needs—incident response, traffic control, traveler information, and work zone management.
- Planning for operations and the objectives-driven approach connects these two vital components of transportation, and integrates operational considerations into the planning process.
Key Points
- Regional goals form the basis for developing operational objectives.
- A systematic process is used for developing and selecting operations strategies based on needs (as can be identified from the Congestion Management Plan), performance measures, and an evaluation of the candidate strategies.
- The selected operations strategies are included in the Metropolitan Transportation Plans and TIP.
- This leads to the implementation of the operations strategies and supporting technologies and staffing. Implementation is a crucial part of achieving the objectives.
Source of Graphic
- "Advancing Metropolitan Planning for Operations: The Building Blocks of a Model Transportation Plan Incorporating Operations - A Desk Reference"; FHWA-HOP-10-027 April 2010; (with some modification).
Slide 33. A New Source of Information on TSM&O
Content
National Operations Center of Excellence
- Partnership of AASHTO, ITE, and ITS America with support from the FHWA.
- Offers a document library, peer exchanges, webinars, on-call assistance, assessments, and other TSM&O support via the Operations Technical Services Program.
- A place to share information as well as receive it.
- www.transportationops.org

Figure 36: Graphic: National Operations Center of Excellence (NOCOE) logo.
Notes
Description of the Slide
Provides information on the recently created National Operations Center of Excellence.
Key Points
- A good place for your staff to get engaged in TSM&O and interact with others around the country. The Center and its website are designed to actively support the transportation systems management and operations (TSM&O) community. The Center's goal is to provide this community with the tools needed to fulfill their mission of enhancing safety and reducing congestion. The web portal is aimed at practitioners, researchers, and policymakers, and provides convenient access to key knowledge resources and the opportunity to discuss topics related to the operations field.
- The related NOCoE Operations Technical Services Program is now under development. Once launched in the Spring of 2015, the new OTSP will offer an array of technical services such as peer exchange workshops and webinars, ongoing assessments of best practices in the field, and on-call assistance.
(Presenters may wish to contact Dennis Motiani, NOCoE Executive Director at dmotiani@transportationops.org, for updates.)
Slide 34. Summary
Content
- Operations is a critical component for managing the transportation network on a daily basis.
- Preserves and maximizes existing capacity.
- Enhances mobility, reliability, safety, and environment.
- Provides customer service via a performance-based approach.
- Achieves quick and cost-effective implementation.
- To be successful, operations needs to be "mainstreamed" into the agency's institutional and organizational framework.
You have an important role to play.
Notes
Description of the Slide
This slide summarizes the Key Points from the previous slides and discussions.
Key Points
- Operations is a critical component for actively managing the transportation network on a daily basis, providing several benefits to a DOT including:
- Preserves and maximizes existing capacity.
- Enhances mobility, reliability, safety, and the environment.
- Provides customer service via a performance-based approach.
- Achieves quick and cost-effective implementation (with large benefit-cost ratios).
- To be successful, operations needs to be "mainstreamed" into the agency's institutional and organizational framework.
- Such change and adaptation cannot be achieved without your enthusiasm and leadership.
Slide 35. Next Steps
Content
- Demonstrate commitment and involvement at the top level.
- Empower the people who can make it happen and give them the resources they need.
- Provide top-down direction and insist on bottom-up accountability.
If you need assistance – Contact:
Notes
Description of the Slide
As a DOT CEO or senior manager, the ball is in your court:
- Demonstrate your own commitment.
- Empower the people on your team on whom you will rely for results.
- Provide top direction and insist on accountability.
Key Points
- Get engaged and develop champions within your organization, and provide them with the necessary resources to help make this happen.
- Feel free to contact FHWA or AASHTO at any time if you have any questions or need additional assistance.
Other – The specific names and contact information for FHWA may be changed or additional names listed depending on the DOT / agency for whom the presentation is being given.
Slide 36. Questions?
Notes
Description of the Slide
- Solicit and respond to questions and comments.
Key Points
- Make sure to follow up to any questions that can't be answered immediately, and to requests for any additional information.
Slide 37. Additional Slides as Appropriate

This is a "parking lot" for slides providing additional details on selected areas and operations strategies. These may be included in the presentation as indicated in the "Other" notes for previous slides.
Slide 38. What is "Reliability"?
Content
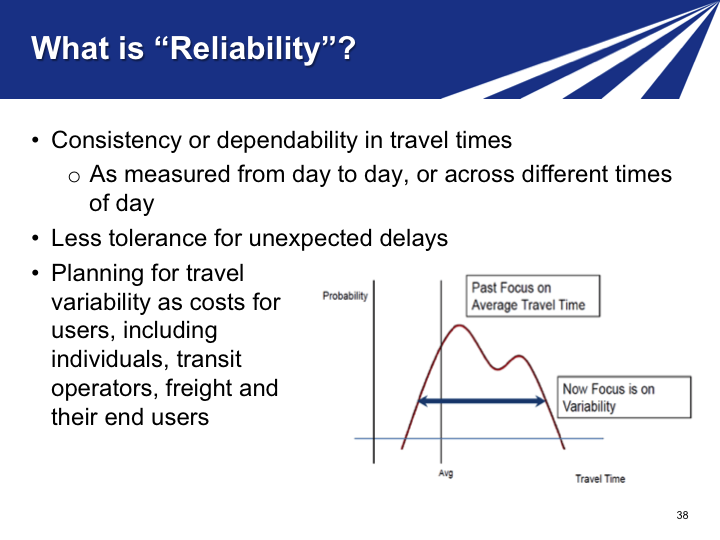
- Consistency or dependability in travel times
- As measured from day to day, or across different times of day
- Less tolerance for unexpected delays
- Planning for travel variability as costs for users, including individuals, transit operators, freight and their end users
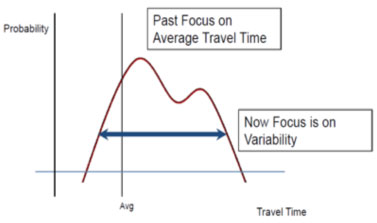
Figure 37: Graph: The graph compares Probability to Travel Time where the past focus was on Average Travel Time while the current focus is on Variability.
Notes
Description of the Slide
What is meant by reliability? Reliability is the ability for travelers and transporters to depend on getting from Point A to B in an expected amount of time. The more reliable a route is, the less tolerance is given for unexpected delays. If we can decrease the opportunities for delay, we can decrease the need to budget for variable travel delays, thereby saving money for travelers, transit operators, freight transporters and their end users.
Key Points
- Reliability focuses on the consistency of travel times.
- The past focus was on average travel times; reliability is concerned with the variability of individual travel times from day to day.
- Optimal operations fine tunes travel reliability on the system and reduces the frequency of unexpected delays.
- Less need to budget in time and money for "inevitable" travel delays saves money for users and end users.
Slide 39. Managed Lanes
Content
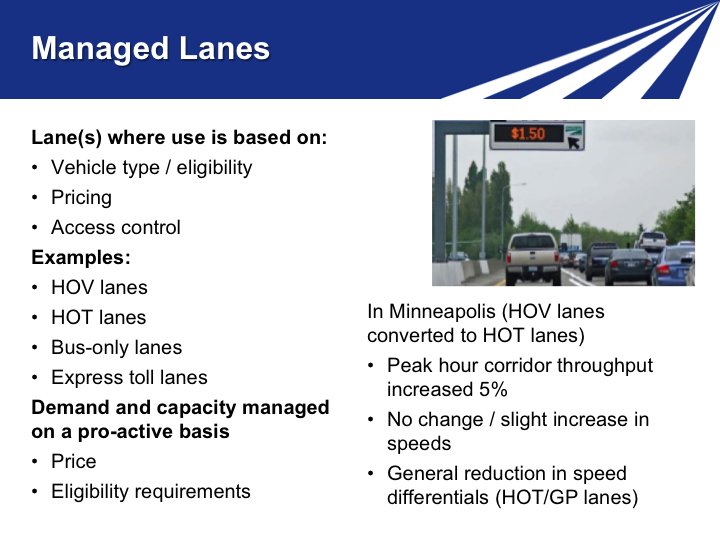
Lane(s) where use is based on:
- Vehicle type / eligibility
- Pricing
- Access control
Examples:
- HOV lanes
- HOT lanes
- Bus-only lanes
- Express toll lanes
Demand and capacity managed on a pro-active basis
- Price
- Eligibility requirements
In Minneapolis (HOV lanes converted to HOT lanes)
- Peak hour corridor throughput increased 5%
- No change / slight increase in speeds
- General reduction in speed differentials (HOT/GP lanes)

Figure 38: Graph: Highway showing dynamic signage for toll fees.
Notes
Description of the Slide
Managed lanes are defined as highway facilities or a set of lanes where operational strategies are proactively implemented and managed in response to changing conditions. Managed lanes are based upon flexible operating strategies and active management of the transportation system.
Key Points
- The managed lane concept is typically a "freeway-within-a-freeway" where a set of lanes within the freeway cross section is separated from the general-purpose lanes.
- The principal management strategies can be categorized into three groups: vehicle eligibility, pricing, and access control.
- Demand and available capacity of the managed lane is pro-actively managed based on changes in price and eligibility requirements.
Sources of Benefit Information
Slide 40. Active Traffic Management (ATM)
Content
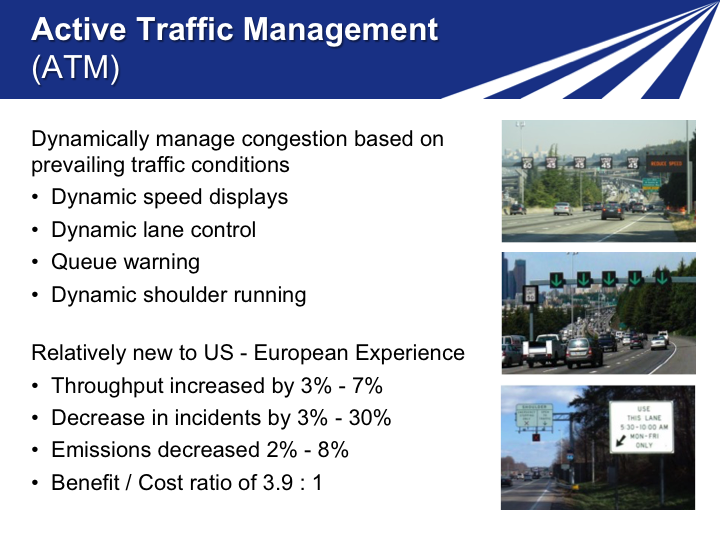
Dynamically manage congestion based on prevailing traffic conditions
- Dynamic speed displays
- Dynamic lane control
- Queue warning
- Dynamic shoulder running
Relatively new to US - European Experience
- Throughput increased by 3% - 7%
- Decrease in incidents by 3% - 30%
- Emissions decreased 2% - 8%
- Benefit / Cost ratio of 3.9 : 1
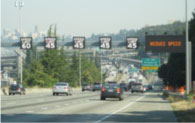
Figure 39: Photo: Highway showing signage for dynamic speed limits and queue warning.
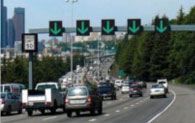
Figure 40: Photo: Highway showing signage for dynamic speed limits and lane assignment.
Figure 41: Photo: Signage allowing use of highway shoulder, reserving right-most turning lane for morning commute period only.
Notes
Description of the Slide
The two fundamental concepts of ATM are active management of the capacity and direct interaction with drivers to encourage them to make tactical driving decisions (e.g., stopping, slowing down, and changing lanes).
Key Points
- Active traffic management includes several strategies that are often deployed and integrated together, including:
- Dynamic Speed Displays: This strategy adjusts speed limits based on real-time traffic, roadway, and/or weather conditions. Dynamic speed limits can either be enforceable (regulatory) speed limits or recommended speed advisories.
- Dynamic Lane Control: This strategy involves dynamically closing or opening individual traffic lanes as warranted and providing advance warning of the closure(s) in order to safely merge traffic into adjoining lanes.
- Queue warning: This strategy involves real-time displays of warning messages to alert motorists that queues or major slowdowns are ahead, thus reducing rear-end crashes.
- Dynamic Shoulder Lanes: This strategy enables the use of the shoulder as a travel lane(s) based on congestion levels during peak periods and in response to incidents or other conditions as warranted during non-peak periods.
Sources of Benefit Information
- "Active Traffic Management: The Next Step in Congestion Management"; FHWA-PL-07-012; July 2007 (Scanning Tour Report).
- ATM strategies have been widely used in Europe with very positive results. The initial deployments of ATM in the US – in Seattle and Minneapolis – have also shown positive benefits, such as:
- ATM in Washington (NB I-5) showed a 4.1% reduction in total crashes over a three-year period; while the SB segment of I-5 (without ATM) experienced a 4.4% increase during the same period.
- In both cases, the roadway segments were already actively managed and operated via robust incident management, traveler information, and ramp metering programs.
Slide 41. Integrated Corridor Management
Content
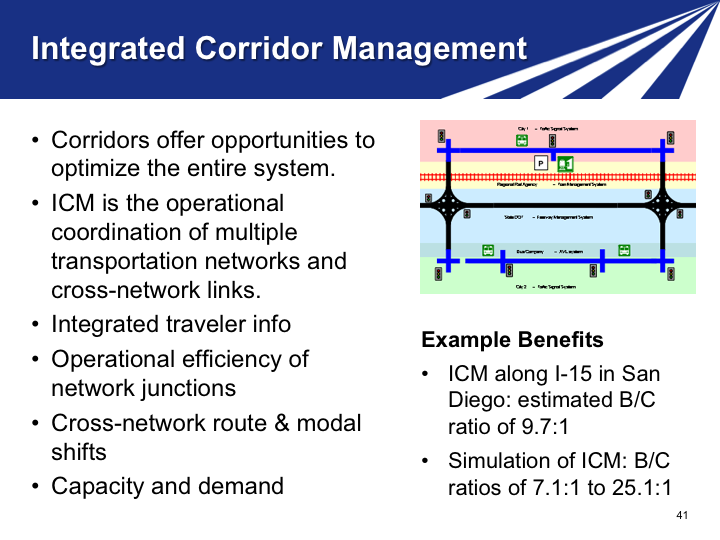
- Corridors offer opportunities to optimize the entire system.
- ICM is the operational coordination of multiple transportation networks and cross-network links.
- Integrated traveler info
- Operational efficiency of network junctions
- Cross-network route & modal shifts
- Capacity and demand
Example Benefits
- ICM along I-15 in San Diego: estimated B/C ratio of 9.7:1
- Simulation of ICM: B/C ratios of 7.1:1 to 25.1:1
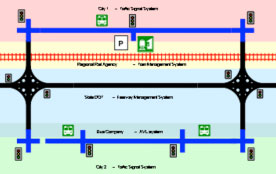
Figure 42: Diagram: Diagram showing the concept of integrated corridor management, with a corridor consisting of multiple transportation networks such as freeway, arterials, rail and bus.
Notes
Description of the Slide
Integrated Corridor Management (ICM) consists of the operational coordination of multiple transportation networks and cross-network connections comprising a corridor, and the coordination of institutions responsible for corridor mobility.
Key Points
- Corridors, consisting of parallel roadway networks and modes, offer an opportunity to operate and optimize the entire system as opposed to the individual networks.
- Several ICM approaches exist, consisting of the integrated management of multiple operations strategies across the shoulder. Basic approaches include:
- Integrated traveler information.
- Improved operational efficiency of network junctions, such as signal priority for transit, multi-modal electronic payment, transit hub connection protection.
- Accommodated / promoted cross-network route and modal shifts, such as modified arterial signal timing to better accommodate traffic diverting from freeway; modified transit priority parameters to accommodate more timely bus operation; and promotion of route shifts between roadways and modal shifts (from roadway to transit) via traveler information.
- Managed capacity – demand relationship within a corridor such as dynamic lane use controls (including reversible lanes / contra-flow) and variable speed limits via ATM); conversion of regular lanes (and / or shoulders) to transit only or emergency only; additional transit capacity by adjusting headways / additional vehicles; additional capacity at parking lots (temporary lots); and increased roadway capacity by opening HOV / HOT lanes / shoulders, restricting ramp access, and modified toll / HOT pricing.
Sources of Benefit Information