Comprehensive Truck Size and Weight Limits Study - Highway Safety and Truck Crash Comparative Analysis Technical Report
Chapter 3: Analysis of Safety Vehicle Stability and Control
This analysis compares the stability and control characteristics of the control and six scenario vehicles, which were run through specific maneuvers in a computer simulation. This analysis, a direct comparison between vehicles in idealized situations, was conducted to identify vehicle stability and control issues for the six scenario configurations. It complements the results of the other analyses, which used crash involvement statistics from various sources.
Additional information developed under a project to assess braking performance for certain trucks under certain conditions was included to complement the simulation-based work conducted for this study. This braking performance project was conducted by the Federal Motor Carrier Safety Administration (FMCSA) and Oak Ridge National Laboratories (ORNL).
3.1 Vehicle Stability and Control Scope
This analysis compared the stability and control properties of the six scenario vehicles with their two corresponding control vehicles. Models of the eight vehicles were run in computer simulations through a series of five maneuvers, each designed to challenge a specific aspect of the vehicle stability. The maneuvers quantified the performance in intersections at low speed and on a highway curve at high speed. Braking performance and stability were simulated on a straight road and a curved road for both fully functioning brakes and for two types of brake malfunction. The final maneuver examined performance in an avoidance maneuver at highway speed. To limit the scope of the analysis, each maneuver, except the avoidance maneuver, was run at one simulated speed and one radius of curvature. The idealized situations that were simulated could occur on any highway network. They are not specific to a particular network of where the vehicle might be allowed to operate.
This analysis provided a direct comparison of the stability of the vehicles in the selected maneuvers. Without data on how frequently these situations are encountered on public roads, these results cannot be used in any crash data estimates. Thus, this analysis complements the foregoing crash data analyses, but its results cannot be combined with theirs.
As noted, additional results based on field testing conducted by FMCSA and ORNL produced useful, relevant information on vehicle stopping distance and its relationship to gross vehicle weight. These results were included in this study to supplement the results produced through simulation modeling. FMCSA and ORNL tested a 3S-2 tractor flatbed semi-trailer configuration under various loading conditions (various gross vehicle weight conditions) with regard to stopping distances. Results from the FMCSA/ORNL project are generally consistent with results produced in the computer simulation analysis.
3.2 Vehicle Stability and Control Methodology
The methodology in this analysis was to develop computer models of the vehicles, simulate them through a series of maneuvers, and observe trends in objective performance parameters.
Analytical Approach
As discussed in the Chapter 1 – Introduction, the USDOT selected two control vehicles and six scenarios with input from stakeholders. The maneuvers for study were based on those used in prior truck size and weight studies and on standardized tests. They were selected to challenge the vehicles in a variety of ways that might reflect on their relative safety performance.
Research Approach for the Vehicle Stability and Control Analysis
The simulations were conducted with TruckSim® (versions 8.1 and 8.2), a commercially available and widely accepted heavy truck modeling package.
The vehicles were simulated through defined maneuvers to evaluate their performance. The maneuvers are based on established test procedures and prior research so that the results are comparable with those of other studies. Table 24 lists the maneuvers that were used to evaluate the vehicles as well as the performance metrics that were extracted from each maneuver and the crash type that each is intended to assess. The maneuvers are illustrated in the results section, where descriptions and sketches of each path are presented along with sample results. Complete technical descriptions of the maneuvers and analysis are in Appendix C.
The performance metrics are objective measures that can be used to compare the behavior of vehicles. Each metric can be related to one or more kinds of crashes, so the performance metrics are relative measures of the safety and stability of vehicle configurations. Results from these highly idealized maneuvers, however, cannot be quantitatively related to crash involvement in actual use. The performance metrics are:
- Stopping Distance. Perhaps the most commonly measured performance metric is stopping distance. A truck with a longer stopping distance is more likely to be involved in forward collisions. The regulation for air brakes, as legislated in Federal Motor Vehicle Safety Standard (FMVSS) No. 121, provides a straight-line stopping distance test (see S5.3.1.1. of the standard). The brake-in-a curve test referenced in S5.3.6.1 does not include a stopping distance criterion, but the stopping distance in this test was a performance metric.
- Maximum Path Deviation. The brake-in-a-curve test referenced in FMVSS No. 121 S5.3.6 requires that the truck remain within a 12-ft. lane during a hard braking stop on a slippery road surface. If part of a truck leaves its lane, it may strike a vehicle in an adjacent lane. If the truck is on a narrow road, it may strike roadside objects or leave the pavement entirely, possibly leading to a rollover.
- Off-tracking. Off-tracking is the phenomenon of one or more trailers following a path different than the tractor. It can occur in different situations and have different consequences; for example, in an urban environment, the trailer's tires may ride up on the curb, potentially impacting pedestrian safety. Trucks have also been known to roll over at rural intersections when the trailer tires took a path into soft soil.
Low-speed off-tracking occurs when a truck makes a right-angle turn at an intersection and is also a factor, albeit less pronounced, on entrance and exit ramps. High-speed off-tracking occurs on a curve at a highway speed. The trailer may be inside or outside of the tractor’s path, depending on the speed, loading, trailer length, and properties of the tires.
Transient off-tracking can occur during a lane change and is affected by loading, length, tire properties, and suspension properties as well. Transient off-tracking reflects the condition where the trailer is subject to greater lateral forces than the tractor and is associated with sudden, avoidance type maneuvers. The tires' ability to provide lateral forces plays a strong role in all off-tracking situations; their ability to maintain those forces as load shifts between left and right sides affects high-speed and transient off-tracking. Any kind of off-tracking can lead to trailer tires leaving the lane, which can lead to striking a vehicle in the adjacent lane or a tripped rollover where the higher profiled vehicle (truck) rolls over the lower profiled vehicle (car) during a lateral collision. - Rearward Amplification. When a multi-trailer vehicle executes a sudden lane change, the rearmost trailer may overshoot the position selected by the driver. Poor lateral control can lead to the perils listed above. Rearward amplification is the ratio of the maximum value of a quantity (usually lateral acceleration or yaw rate) of a following vehicle to that of the tractor.
- Lateral Load Transfer Ratio. When an evenly loaded trailer is driving on a straight, level road, the loads on its tires are the same on both ends of the axle. In a steady or transient curve, the trailer will lean and some of the load will transfer from the tires on one end of the axle to those on the other end. If the load on one side falls to zero, the result can be a rollover. Mathematically, the formula for calculating the Lateral Load Transfer Ratio (LTR) of an axle is:
![]()
Where:
FL = the force on the left-side tires
FR = the force on the right-side tires
When an evenly loaded vehicle is driving straight on a level road, the LTR is 0. When the load on one end of the axle is completely removed, the ratio is 1 or -1. An absolute value of 1 means that a set of tires has momentarily lifted from the pavement, but it does not necessarily mean that the truck has rolled over.
Validating the Analytical Approach
The approach for this analytical approach was discussed in broad terms in the study’s December 2013 and May 2014 public meetings along with other tasks. No comments were received.
Key Data and Models Used in the Analysis
Figures 4 and 5 list the particulars of the eight models. The four single-trailer combinations are in the first page of the figure, and the four multi-trailer combinations are on the second page. On both pages, the top row is the control vehicle, which is the configuration allowed under current Federal size and weight limits.
Figure 4: Vehicles Modeled – Single Trailer Combinations
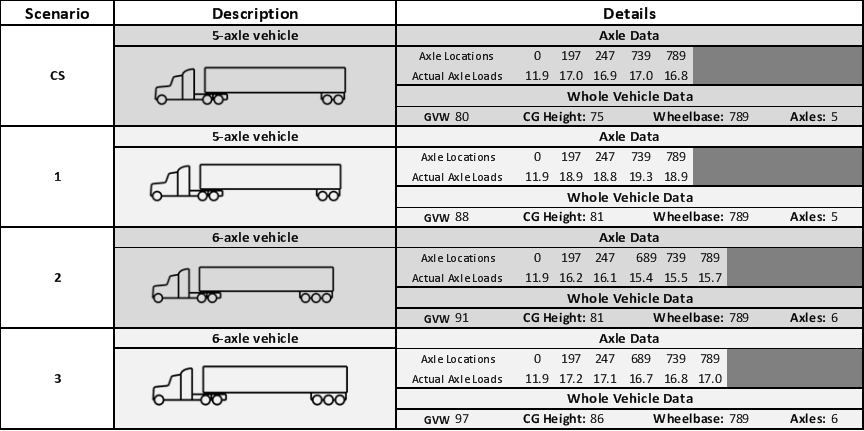
Note: Axle locations are measured in inches from the steer axle. Axle loads are in units of 1000 lb. Center of Gravity (CG) heights are inches.
Figure 5: Vehicles Modeled – Multiple Trailer Combinations
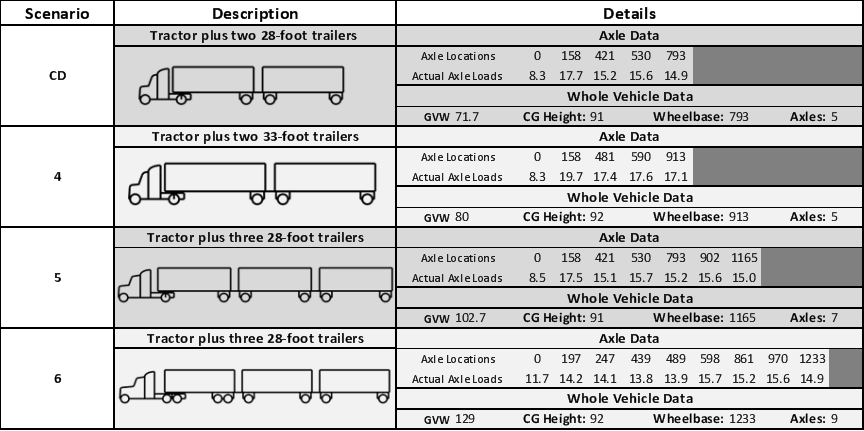
As noted in previous sections, the axle arrangements and maximum allowed GVWs were selected by the USDOT. Under this guidance, the axle locations were set in the Project Plan (Appendix B) to correspond to typical commercial practice. The axle loads were set to distribute the weight evenly, according to the approach in the payload discussion that follows.
The model for the control single configuration was based on a model that was verified for a number of maneuvers in prior work (Rao et al. 2013a and Rao et al. 2013b). The other seven models were built by modifying this original model to add an axle, change the length of a trailer, and so forth. Properties have been compared with industry values where possible, but the new models have not been directly verified by new track tests.
Key Assumptions and Limitations of the Simulation Modeling and Analysis
The USDOT study team made several assumptions to establish the scope of the work to be completed in this area of the study. Important assumptions included:
- All vehicles were dry van trailers with fixed, rigid loads.
- Loads were centered laterally within the trailer. The position and distribution of the payload were selected according to payload density (discussed below).
- Steer axles had two tires, and all other axles had a set of two on each end.
- All multi-trailer combinations were modeled with a pintle hitch between the trailer and converter dolly—an “A train.”
- Simulations were run with dry pavement, except for the brake-in-a-curve test in Maneuver 4.
- In the two braking maneuvers, each of the vehicles in Figure 4 and Figure 5 was tested in three braking conditions:
- Functioning foundation brake system with anti-lock braking system (ABS) on all axle ends. Normal TruckSim® brake and ABS model.
- ABS malfunctioning on one axle or both axles of a tandem. The wheels may lock when brakes are applied.
- Brake failure on one axle end or one tandem end. Braking torque is zero in the failure scenario.
The ABS malfunction and brake failures were modeled on the right ends of both drive axles for the single-trailer combinations. They were on the right end of the lead dolly in the multi-trailer combinations. The brake-in-a-curve maneuver was a left turn to create additional loading on the right wheels to evaluate the effect of the brake failures. - Electronic stability control, as in the proposed new FMVSS No. 136, was not included. Vehicles equipped with electronic stability control were not included in the analysis since this equipment is not required under the existing FMVSS. This requirement is currently being progressed through a NHTSA proposed rulemaking that was not completed at the time that the analysis and modeling were performed for this study.
The assumption for the payload in the four single-trailer combinations was that a carrier with a hypothetical load is limited by current weight regulations. If the weight limit were to rise, the carrier would stack the load higher in proportion to the allowed increase in weight. The payload in the models consisted of two uniform blocks that were positioned to provide the desired distribution of axle loads shown in Figure 4. The payload for the Scenario 1 88,000-lb. configuration is the same as that in the 80,000-lb. control vehicle, but slightly taller. With the addition of the third trailer axle in Scenario 2, the densities of the two hypothetical blocks were adjusted to move the center of gravity rearward and maintain a uniform distribution of loads across the axles. Again, with the increase in gross weight from 91,000 lbs. to 97,000 lbs. for Scenario 3, the hypothetical payload was made taller. Complete details are in Appendix D.
The assumption for the payload of the multi-trailer combinations for the control double, Scenario 4, and Scenario 5 was that they would be identical, varying only with the length of the trailer. Thus, and the trailers in Scenarios 4 and 5 all have the same floor loading. Scenario 4 (with double 33-ft. trailers) has the maximum allowed weight of 80,000 lb. With the same payload density on shorter trailers, the control double weighs 71,700 lbs. The weight set for the control double configuration was based on actual findings observed in the WIM data used in the study. All three trailers in Scenario 5 are identical to the two trailers in the control double. The gross vehicle weight used for the Scenario 5 configuration was 102,700 lbs. based on data provided by the states as part of the Crash Analysis. Scenario 6, being much heavier, has loads that bring all of its axles up to the allowed maximum.
The payload densities and positions in the models were adjusted so that the axle loads were within two percent of the target values.
Similarities and Differences from Prior TSW Studies
This analysis follows the overall approach for the corresponding portions of prior truck size and weight (TSW) studies. It directly parallels them in that it compares key performance metrics for the control and study vehicles in various maneuvers. The two off-tracking maneuvers were taken directly from the 2000 Comprehensive Truck Size and Weight Study (2000 CTSW Study) (USDOT 2000, Vol. 2, pp. VI-34 and VI-35). Both the 2000 CTSW Study and the present study use computer simulations, rather than actual measurements, to evaluate the performance of the vehicles in the prescribed maneuvers.
The present study simulates two standard braking tests to quantify braking performance. This study is novel in that brake failures were added to analyze the directional stability of the vehicles during the braking maneuver.
The 2000 CTSW Study (USDOT 2000, Vol. 3, p. VIII-9) used a standard that is now canceled (SAE, 2000) for the evasive maneuver and the present study used a current standard (ISO, 2000). Both the 2000 and 2014 studies use a single lane change.
3.3 Vehicle Stability and Control Simulation Results
This portion contains the results of the simulations. Sample graphs, sufficient to illustrate the results and analysis, are provided for each maneuver. Graphs of all results are in Appendix F.
The control single and double vehicles are the basis of comparison for the scenario vehicles. The results tables in this section show the control values in bold characters in shaded cells.
Maneuver 1. Low-Speed Off-tracking
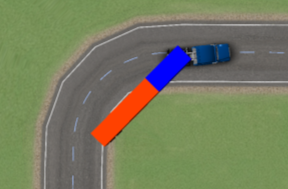
Off-tracking is how much the path of an axle follows to the side of the path taken by the steer axle. Low-speed off-tracking is a measure of the tendency of a trailer to follow to the inside of a curve taken by the tractor. It is important for clearances on reasonable access roads. Figure 6 shows the control single as it turns the standard corner.
Figure 6: Low-Speed Off-tracking Maneuver Simulates an Intersection
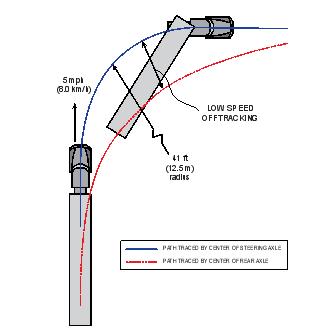
Sample data from this maneuver is in Figure 7. The curves show the off-tracking of the drive and trailer axles of the control single as it drives through the bend. Both drive axles exhibit essentially the same off-tracking in this low-speed maneuver, as do the two trailer axles. The off-tracking begins at zero when the tractor is on the straight path leading to the curve. It reaches a peak in the curve, with the drive axles approximately 50 in. to the inside of the steer axle’s path and the trailer axles 244 in. from the steer axle’s path. Off-tracking returns to zero when the vehicle is again in a straight path. The 244-in. value is reported in Table 25. Graphs of the data for all vehicles, for every maneuver, are in Appendix E.
Figure 7: Off-tracking of the Drive and Trailer Axles Rises and Falls During the Maneuver.
| CS | 1 | 2 | 3 | CD | 4 | 5 | 6 | |
|---|---|---|---|---|---|---|---|---|
| Peak Off-tracking (in.) | 244 | 244 | 232 | 232 | 150 | 197 | 198 | 199 |
Table 25 lists the results of the low-speed off-tracking maneuver for the eight vehicles. The off-tracking values for control single and Scenario 1 are the same. At low speeds the off-tracking depends mostly on the vehicle geometry and tire properties; inertial forces make little difference. Similarly, Scenarios 2 and 3 have the same off-tracking. The trailers with three axles (e.g., Scenario 2 and 3 vehicles) off-track less than those with two trailer axles because the third set of tires helps to steer the trailer in a straight line so the trailer has less propensity to “cut” the corner. Shorter trailers off-track less than longer trailers in low-speed maneuvering, so the control double configuration has less off-tracking than the control single. For this same reason, the 33-ft trailers in Scenario 4 have more off-tracking than the 28-ft trailers in the control double. The third trailer in Scenarios 5 and 6 off-tracks more than the second trailer in the control double configuration.
Maneuver 2. High-Speed Off-tracking
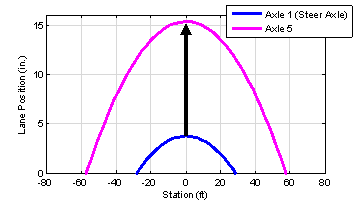
This maneuver is illustrated in Figure 8. The tractor is attempting to follow the dotted line in the center of the pavement. The rear axle of the trailer can be seen displaced toward the outside of the curve. A graph of sample data from the control single vehicle is in Figure 9. The blue curve indicates the path of the steer axle centerline. The red curve, which is outside of the blue curve, is the path of the fifth axle. The distance between these two curves, indicated by the arrow in the figure, is the off-tracking.
Low-speed off-tracking is always to the inside of the curve. High-speed off-tracking can be to the inside or the outside. The trailer tracked to the outside of the tractor’s path in all of the cases simulated here.
Figure 8: Trailer Tracks to the Outside of the Curve Centerline in this High-Speed Off-tracking Illustration.
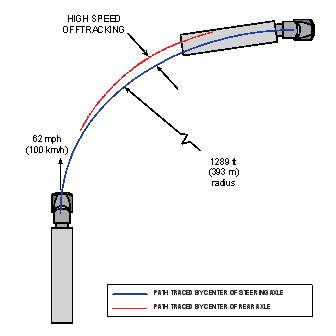
Figure 9: Off-tracking was Calculated by Taking the Difference in the Path Followed by the First and Final Axles.
Note how the trailer tracks to the outside of the curve centerline in the illustration.
Table 26 lists the results of the high-speed off-tracking maneuver. The values of the four single-trailer combinations vary by barely an inch. The two triple-trailer configurations, Scenarios 5 and 6, off-track more than do the two double-trailer configurations , but all vehicles would be well within the width of a typical highway lane.
| CS | 1 | 2 | 3 | CD | 4 | 5 | 6 | |
|---|---|---|---|---|---|---|---|---|
| Off-tracking (inches) | 12 | 13 | 12 | 13 | 17 | 19 | 25 | 26 |
CS = control single vehicle
CD = control double vehicle
Note: All values are toward the outside of the curve.
To put the off-tracking values (and the lane position values of the next two maneuvers) in context, consider a vehicle with a nominal width of 102 in. in a12-ft-wide lane. The edge of a unit will be at the extent of the lane when the center of an axle is displaced 21 in. from the centerline of the lane. The trailer’s yaw angle and road curvature may put the rear corner of a unit over the edge line even when the displacement is less than that. Highway design guidelines call for lanes to be widened on curves to allow for inevitable off-tracking. If this curve occurred on a two-lane roadway, the lane would be widened by approximately 14 in. (AASHTO 2011, p. 3-94).
The high-speed off-tracking of a vehicle, particularly a multi-unit combination vehicle, is as much a function of trailer loading and the tire properties as it is the vehicle itself. The tires at the front of the trailer (either the tractor’s drive tires or the dolly tires) and the tires at the rear of the trailer exert forces toward the center of the curve to keep the vehicle in the curve. The mass at the unit’s center of gravity exerts the equivalent of a centrifugal force. The balance between the inward and outward forces (called understeer or oversteer characteristics) determine the angle of the unit as it rounds the curve and thence its off-tracking. The tire models have been validated through the NHTSA testing (Rao et al., 2013) to represent reasonable properties, and the center of gravity was positioned to achieve the desired axle loads; however, a change in loading or a change in tires would change the off-tracking. Furthermore, for a given vehicle and payload, the off-tracking varies with speed. In a transient situation (as in Maneuver 5), the situation is more complicated. The height of the center of gravity affects the left-right load transfer, which in turn affects the ability of the tires to generate lateral forces.
Maneuver 3. Straight-Line Braking
This maneuver is based the stopping distance test in S5.3.1.1 of FMVSS No. 121. The stopping distance requirement in Table II of FMVSS No. 121, for two-axle tractors and for three-axle tractors with a gross vehicle weight rating (GVWR) of 70,000 lbs. or less is 250 ft. According to the requirement, the compliance test is conducted with a tractor with an un-braked control trailer. For purposes of this simulation, the control single vehicle was modeled as a vehicle for which the stopping distance was measured with a GVW of 80,000 lb., which is consistent with the stopping distances outlined in Figure 5 of Hoover et al., 2005. The brakes for the control single vehicle were modeled so that it stops in approximately the average distance shown in that figure as well (i.e., 240 ft.).
Other vehicles have brakes that are identical to those in the control single. The third trailer axle for Scenarios 2 and 3 has braking capability identical to those on the tandem trailer axles of Control Vehicle CS and Scenario 1. To be sure, brake equipment of better capability is commercially available, but the assumption was to leave the brakes unchanged in the models so the results would be a comparison of the change in gross weight and trailer arrangement and nothing else.
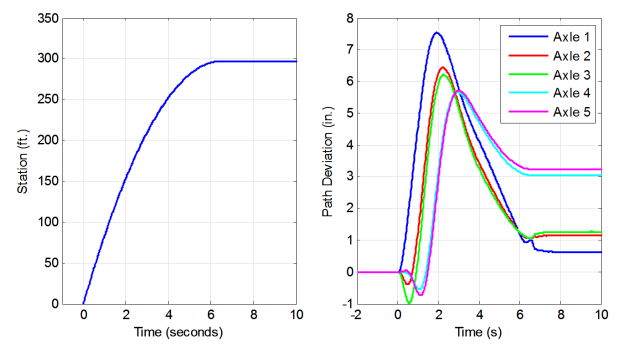
An illustration of a simulated truck beginning this maneuver is in Figure 10. Figure 11 has the data from the control single simulation in the case where the right-side brakes on both drive axles are disabled. The left portion of the figure shows how its position (“station”) begins at zero when brakes are applied at time zero and comes to a stop after traveling 297 ft. The right side of the figure shows the positions of the axles as a function of time. The vehicle pulls to the left (positive direction) when the brakes are applied, but the driver can steer it back to the lane center as it slows. The peak deviation of an axle center from the intended path was 8 in. The results for all vehicles are in Table 27.
Figure 10: Simulation of the Straight-line Braking Maneuver
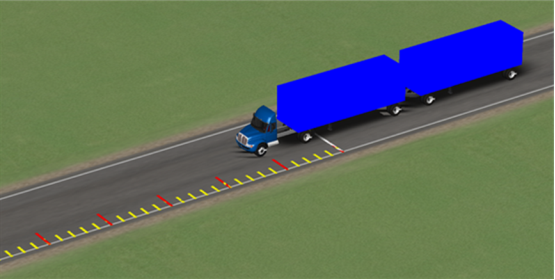
Figure 11: Position vs. Time (left) and Path Deviation vs. Time (right) of Control Single Vehicle as it Stops with Brake Failure on the Right Ends of the Two Drive Axles
| Quantity | Brake Condition | CS | 1 | 2 | 3 | CD | 4 | 5 | 6 |
|---|---|---|---|---|---|---|---|---|---|
| Stopping Distance (ft.) | Normal | 235 | 255 | 234 | 247 | 230 | 252 | 247 | 239 |
| ABS malfunction | 235 | 255 | 234 | 247 | 230 | 252 | 247 | 239 | |
| Brake Failure | 297 | 323 | 286 | 301 | 249 | 272 | 262 | 249 | |
| Maximum Path Deviation, (in.) | Normal | 0 | 0 | 0 | 0 | 0 | 0 | 0 | 0 |
| ABS malfunction | 0 | 0 | 0 | 0 | 0 | 0 | 0 | 0 | |
| Brake Failure | 8 | 8 | 7 | 8 | 5 | 5 | 8 | 5 |
CS = control single vehicle
CD = control double vehicle
The control single vehicle stops in 235 ft. By contrast, Scenario 1, with a slightly higher weight on the same brakes, has a stopping distance that is longer. The addition of the trailer axle in Scenario 2, with its additional brakes, slightly reduces the stopping distance despite the additional weight. The higher weight of Scenario 3 also lengthens the distance—by about 5 percent over the distance of the control single vehicle.
The stopping behavior of the multi-trailer combinations also is different from that of the single-trailer combinations. This is because when a vehicle brakes hard, the body pitches forward and transfers load from the rear tires to the front, and the results of this behavior depend on the height of the payload, the suspension properties, and the length of the trailer.
The brake failure has a greater effect on the two five-axle combinations (control single and Scenario 1) than the six-axle combinations (Scenarios 2 and 3) because more brakes remain intact in the combinations with more axles. The effect of the brake failure is also less on the multi-trailer combinations, where two axle ends suffer failure, than the single-trailer combinations, with one axle end failure.
The ABS malfunction does not affect the straight-line stopping distance because the ABS is not engaged by the dry pavement stop in this simulation.
FMCSA has recently conducted testing to investigate the straight-line stopping distances of five- and six-axle combinations of a tractor and flatbed semitrailers at various weights and brake failure scenarios (Lascurain et al., 2013 and 2014). The vehicles in those experiments differ from the configurations modeled in the present study in several respects. Most notably, the semitrailers in those studies were 48-ft. flatbeds, not 53-ft. dry-vans. Those measurements cannot be used to verify the present simulations, but comparisons can be drawn. Further details on the testing conducted by FMCSA can be found in the section that follows.
The stopping distances of both the simulated and experimental 80,000-lb. vehicles with fully functioning brakes differ by 11 ft. because both were intended to meet the FMVSS No. 121 stopping distance requirement. When two drive axle brakes were disabled, the simulated vehicle’s stopping distance increased 26 percent and that of the experimental vehicles by 38 percent. Again, when two drive axle brakes were disabled on a 97,000-lb. six-axle vehicle, the stopping distance increased in the simulation by 22 percent and in the experiment by 32 percent. Either study’s results can be considered a reasonable value for its conditions.
The lane deviation in Table 27 for the first two braking conditions is exactly zero because the idealized computer model does not cause the vehicle to deviate to the right or left. A real truck would inevitably have some asymmetry, producing some deviation. The third braking condition, brake failure on the same side of both drive axles or on the one side of the first dolly, does produce a yaw moment. The vehicle moves a few inches from the lane center in the simulation, which is consistent with experience.
FMCSA/ORNL Tractor-Semitrailer Brake Testing
This testing was led by FMCSA in coordination with FHWA and with the support of ORNL. The tests were performed on a combination vehicle with larger tractor brakes meeting the reduced stopping distance (RSD) requirement reflected in FMVSS 121 (49 CFR Part 571). The RSD tractor configuration uses larger front drum brakes to meet the NHTSA FMVSS 121 air brake testing upgrade, which went into effect in 2011 for three-axle tractors.
Five-Axle Tractor-Semitrailer Testing
The first set of tests involved a five-axle combination vehicle fitted with brakes meeting the RSD requirement. Following a complete brake rebuild, instrumentation, and brake burnish, the study team conducted stopping tests for various brake conditions at 60,000, 80,000, 91,000, 97,000, 106,000, and 116,000 lbs. GVW. The 80,000-lb. GVW tests included both balanced (load equally distributed on trailer) and unbalanced (loading of trailer biased towards front of trailer) loads. The condition of the braking system was also varied from fully operational to induced braking defects. To introduce these defects, the brakes were alternately deactivated on the forward drive axle of the tractor and the rear trailer axle. In addition to the stopping tests, performance-based brake tests were conducted for the various loading and brake conditions on a brake roller dynamometer.
Analysis of the stopping test data showed that the stopping distance generally increases with load and also showed that more braking force was generated by the drive axle brakes than the trailer axle brakes.
| Gross Vehicle Weight | Full Brakes | Disabled Drive Axle | Disabled Trailer Axle |
|---|---|---|---|
| 60,000 lbs | 228 feet | 299 feet | 229 feet |
| 80,000 lbs (balanced) | 223 feet | 309 feet | 256 feet |
| 80,000 lbs (unbalanced) | 223 feet | 320 feet | 246 feet |
| 91,000 lbs | 225 feet | 310 feet | 272 feet |
| 97,000 lbs | 238 feet | 328 feet | Not done |
| 106,000 lbs | 240 feet | 326 feet | 294 feet |
| 116,000 lbs | 252 feet | 340 feet | 319 feet |
Six-Axle Tractor-Semitrailer Testing
The first part of the six-axle testing was conducted in 2013 and involved a combination vehicle equipped with RSD brakes on the steer axle of the tractor. Similar to the five-axle research vehicle, tests for this phase of the research effort included Performance Based Brake Tests (PBBT), and full effectiveness stops. The condition of the braking system was also varied from fully operation to induced braking defects. To introduce these defects, the study team alternately deactivated the brakes on the forward drive axle and the rear trailer axle. In addition to the stopping tests, performance-based brake tests were conducted for the various loading and brake conditions on a brake roller dynamometer.
FMVSS 121 stopping distance test protocols were followed and additional induced brake defect stopping distance tests were performed. The six-axle test weights were conducted for various brake conditions at 80,000, 88,000, 97,000 (balanced), 97,000 (unbalanced) 112,000, and 132,000 lbs. GVW.
ORNL gathered the required stopping distance data and analyzed it to provide background information regarding the braking capability of air-braked commercial combination vehicles operating at maximum weight allowed by FHWA Bridge Formula and in heavy weight conditions under various levels of brake performance. This testing was conducted on a vehicle with larger tractor brakes meeting the RSD requirement rulemaking reflected in FMVSS-121 (49 CFR Part 571). A similar set of tests were repeated on the same vehicle fitted instead with non-RSD brakes on tractor steer axle.
| Gross Vehicle Weight | Full Brakes | Disabled Drive Axle | Disabled Trailer Axle |
|---|---|---|---|
| 80,000 lbs | 218 feet | 289 feet | 272 feet |
| 88,000 lbs | 216 feet | 273 feet | 290 feet |
| 97,000 lbs | 221 feet | 292 feet | 274 feet |
| 97,000 lbs (unbalanced) | 215 feet | 292 feet | 274 feet |
| 112,000 lbs | 234 feet | 311 feet | 283 feet |
| 132,000 lbs | 269 feet | 363 feet | 334 feet |
| Gross Vehicle Weight | Full Brakes | Disabled Drive Axle | Disabled Trailer Axle |
|---|---|---|---|
| 80,000 lbs | 257 feet | 333 feet | 306 feet |
| 88,000 lbs | 249 feet | 315 feet | 305 feet |
| 97,000 lbs | 262 feet | 338 feet | 298 feet |
| 97,000 (unbalanced) | 251 feet | 333 feet | 299 feet |
| 112,000 lbs | 250 feet | 343 feet | 300 feet |
| 132,000 lbs | 299 feet | 409 feet | 347 feet |
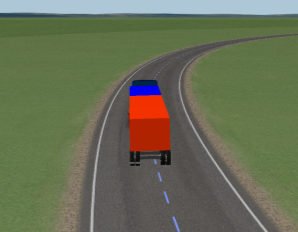
Maneuver 4. Brake-in-a-Curve
This maneuver is based on the brake-in-a-curve test in S5.3.6.1 of FMVSS No. 121. The curve radius is 500 ft. This full-treadle brake application on a slippery surface is intended to evaluate the performance of ABS, which is currently required on all heavy vehicles with a GVWR over 10,000 lbs. The brake models in this maneuver are identical to those in the straight-line braking maneuver.
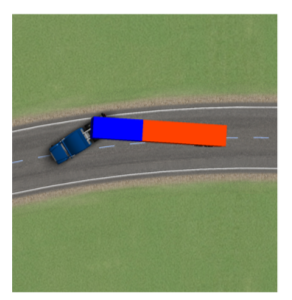
Table 28 provides the results for this maneuver. The path deviation for the cases with the normal brake system was mostly due to steady-state off-tracking; the deviation increased marginally when the brakes were applied. However, the single-trailer cases with a simulated ABS malfunction all jackknifed, as illustrated in Figure 12.
None of the multi-trailer configurations jackknifed when the ABS malfunction was applied to the lead dolly, although three of them experienced a path deviation of approximately 36 in. Scenario 4, with two 33-ft. trailers, had a minor path deviation. That is not because the configuration is significantly more stable than the other vehicles, but rather because it is near a threshold of instability in the study’s assumptions. If the coefficient of friction in the model road is lowered from 0.5 to 0.46, Scenario 4 will deviate significantly from the path. The reason for the different behavior is a combination of factors, including load and length.
| Quantity | Brake Condition | CS | 1 | 2 | 3 | CD | 4 | 5 | 6 |
|---|---|---|---|---|---|---|---|---|---|
| Stopping Distance (ft.) | Normal | 85 | 88 | 84 | 86 | 86 | 88 | 88 | 86 |
| ABS Malfunctiona | - | - | - | - | 86 | 89 | 87 | 86 | |
| Brake Failure | 107 | 111 | 103 | 105 | 96 | 98 | 95 | 92 | |
| Maximum Path Deviation (in.) | Normal | 19 | 19 | 17 | 17 | 4 | 7 | 5 | 5 |
| ABS Malfunction | 104 | 112 | 102 | 106 | 36 | 7 | 35 | 35 | |
| Brake Failure | 21 | 22 | 20 | 20 | 10 | 12 | 11 | 8 | |
| Lateral Load Transfer Ratio | Normal | 0.34 | 0.37 | 0.34 | 0.37 | 0.44 | 0.42 | 0.44 | 0.44 |
| ABS Malfunction | 0.34 | 0.37 | 0.34 | 0.37 | 0.44 | 0.42 | 0.44 | 0.44 | |
| Brake Failure | 0.34 | 0.37 | 0.34 | 0.37 | 0.44 | 0.43 | 0.44 | 0.44 |
a Stopping distance is not reported for the four cases that jackknifed in this maneuver.
CS = control single vehicle
CD = control double vehicle
Figure 12: A Bird’s Eye View of Control Vehicle CS after Coming to Rest in the Brake-in-a-curve Maneuver with the ABS Disabled on the Drive Axles
The stopping distance is reported for all cases in which the vehicle did not jackknife. FMVSS No. 121 does not have a stopping distance requirement for this test, and the distances are not meaningful for the jackknifed cases. The failed brake does extend the stopping distance of a particular vehicle, but the variations between vehicles are less than 10 ft. and are not significant.
The lateral load transfer has a steady state value while the vehicle is at a steady speed in the curve. The quantity begins to decrease when the brakes are applied, but some cases had a minor transient as the brakes were applied.
Maneuver 5. Avoidance Maneuver
The procedure to evaluate rearward amplification properties was based on the single lane change maneuver in ISO 14791 (ISO 2000).
All avoidance maneuvers were run at 50 mph. Eight paths were drawn, each in the shape of a single lane change but with a different amount of lateral path change. For each path, the longitudinal distance of the transition was set so that, if the tractor exactly followed the path, its lateral acceleration would be a single cycle of a sine wave with a peak lateral acceleration of 0.15 gravitational units. How much the trailers responded to the steering would depend on how sudden the maneuver was (technically, the frequency of excitation). Eight lane change widths (3, 6, 9, 12, 15, 18, 21, and 24 ft.) were simulated for the avoidance maneuvers. Given these eight lane changes, the highest response (i.e. highest off-tracking, highest rearward amplification, and highest lateral load transfer ratio) for each vehicle is reported in Table 29. A formal mathematical explanation of the maneuver and analysis is in Appendix C.
| CS | 1 | 2 | 3 | CD | 4 | 5 | 6 | |
|---|---|---|---|---|---|---|---|---|
| Peak Off-tracking (in.) | 3.9 | 4.3 | 3.9 | 4.4 | 23.2 | 21.7 | 43.8 | 44.5 |
| Rearward Amplification of Lateral Acceleration | 1.0 | 1.0 | 1.0 | 1.0 | 2.1 | 2.3 | 2.1 | 2.3 |
| Lateral Load Transfer Ratio | 0.42 | 0.44 | 0.49 | 0.46 | 0.93 | 0.84 | 1.00 | 1.00 |
CS = control single vehicle
CD = control double vehicle
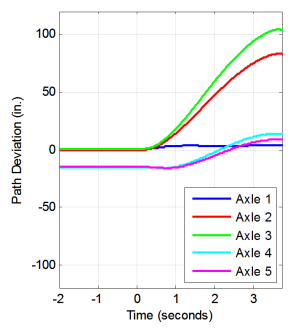
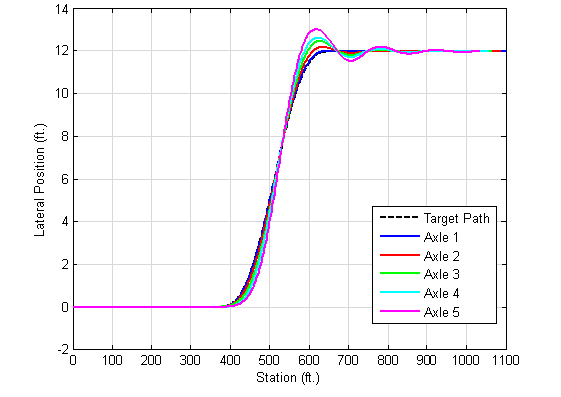
The path of the 12-ft lane change for control double is illustrated in Figure 13. The figure shows how the tractor steer axle is attempting to follow the target path. The steer axle followed the path quite well, staying within 2 in. in all cases; the peak lateral acceleration of the tractor center of gravity ranged from 0.14 to 0.19 gravitational units from case to case.
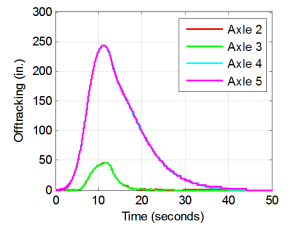
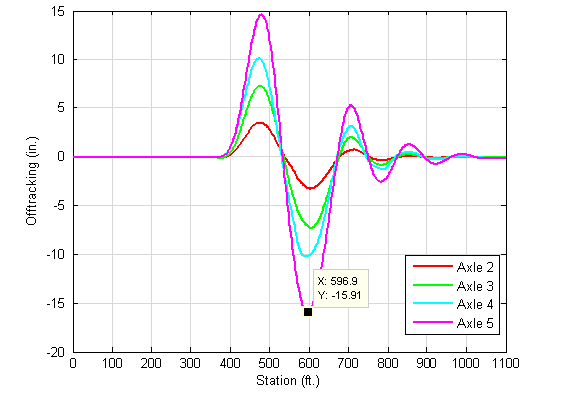
Figure 13 shows that, while the steer axle follows the intended path quite well, the drive and trailer axles lag behind during the main part of the maneuver and overshoot at the conclusion of the maneuver. Figure 14 shows the difference between the paths of axles 2 through 5 and the steer axle at each point along the roadway. This difference is the transient off-tracking. The off-tracking begins at zero when the tractor is on the straight path before the maneuver and reaches its peak as the lane change is ending, when the rear axle on the second trailer was 16 in. beyond the path of the steer axle. Off-tracking returns to zero when the vehicle is again in a straight path.
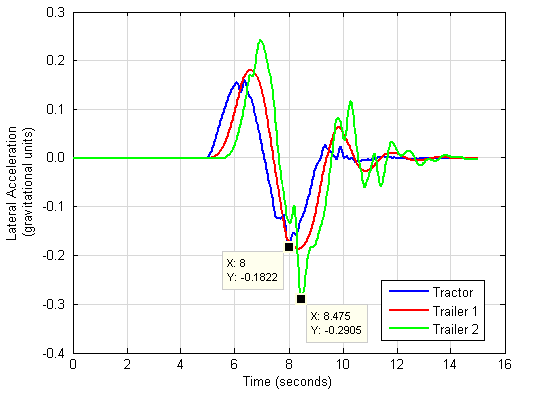
Figure 15 is a graph of the lateral acceleration time history for this same maneuver. Markers in the figure indicate the peaks in the lateral acceleration of Trailer 2 and of the tractor. The rearward amplification is the ratio of these two quantities. Rearward amplification results for this maneuver are in Table 29. The trailer of all single-trailer combinations followed the tractor’s path almost exactly at low rates, and the ratio is reported as unity in the table. Trailer motion was less at the more abrupt lane changes. For each of the four multi-trailer configurations, there was at least one lane change distance where the rearward amplification was greater than unity, as in Figure 14.
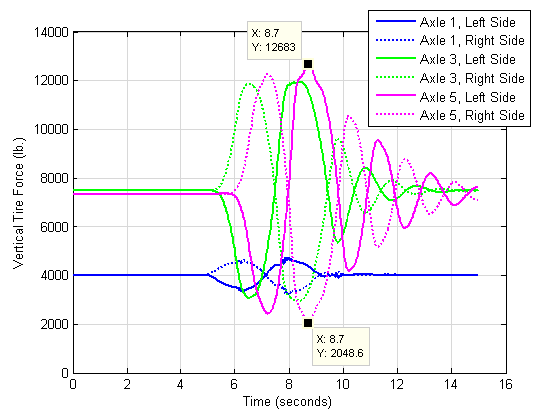
Figure 16 plots the vertical forces on the tires for this same case. (These are forces on the axle end. The steer tires have the forces plotted; other axles have dual tires so the force on each tire is half of the value.) Vertical tire forces remained positive throughout the duration of the lane change maneuver, meaning that no wheels lifted off the pavement. Markers in the figure indicate the moment where the maximum amount of load was transferred from the right side to the left side of the rear axle. Lateral load transfer ratio in this case is (12,683‑2,049)/(12,683+2,049) or 0.72. A value of 0.93 is reported for the control double in Table 29 because the load transfer was greater in the 6-ft. lane change.
Figure 13: Paths of the Axle centerlines of the Control Double as it Executes the 12-ft. Avoidance Maneuver
The differences between the results for the four single-trailer combinations are not significant. Off-tracking is minimal for all scenarios. The load transfer across the trailer axles is nearly the same for the three scenario vehicles as for the control vehicle, and momentary load transfers at this level will not roll over a trailer.
As expected, the responses for the multi-trailer combinations to this maneuver were more significant. With the exception of the off-tracking of the three-trailer combinations, the differences in dynamic responses between the four multi-trailer combinations are not meaningful. A sensitivity study with more conditions would yield variations in results and the order of the vehicles’ performance.
Load transfer ratios for all four multi-trailer combinations were high, and all would be in danger of rolling over if a maneuver of this severity were performed on an actual vehicle. Scenarios 5 and 6 had a lateral load transfer of 1.00. This means that the load on one end of the axle on the third trailer was completely removed for periods of less than one second, but the trailer did not roll over in the simulation. Although not advisable in service, it is possible on a test track to briefly lift one trailer axle without rolling the trailer over. The load transfer ratio of 1.0 is slightly higher than the 0.94 for the control vehicle. This illustrates why drivers of multi-trailer combinations are trained to avoid sudden steering maneuvers.
Figure 14: Off-tracking was Computed from the Axle Paths in the Previous Figure[3]
3.4 Conclusions
The simulations and field test results generally agreed with trends that could be expected for the nature of the modifications to the two control vehicles. The simulations quantified the changes in performance as the size or weight of the vehicles was increased.
None of the maneuvers identified a condition where the stability of a single-trailer combination was severely impaired by the addition of payload weight or a third trailer axle. Low- and high-speed off-tracking results were changed by amounts that would be difficult to measure in practice. Adding weight to the payload increased the stopping distance on dry road by less than 10 percent; in the proportions selected for the study, the additional brakes on the third trailer axle compensated for the additional payload in Scenario 2. Simulating a complete right-side brake failure on both drive axles increased the stopping distance, and the effect of that failure on the alternative configuration vehicles was similar to its effect on the control vehicle. The ABS malfunction caused a jackknife on all single-trailer combinations as expected; its severity did not appreciably differ between scenarios. All four single-trailer combinations had a benign response to the avoidance maneuver.
Figure 15: Lateral Acceleration Time Histories of the Three Units of Control Vehicle CD in the 12-ft Lane Change.[4]
Multi-trailer combinations were most challenged by the avoidance maneuver, which was formulated for that purpose. The final trailer in all four vehicles traced a wider path, experienced greater lateral acceleration, and put more load on the outside tires than did the tractor. The severity of the maneuver caused amplification of the second trailer’s response compared to the tractor’s response in the two-trailer combinations. The greater length of the 33-ft. trailers in Scenario 4 lowered the response slightly below that of the control vehicle with 28-ft. trailers. The amplification of the third trailer’s response in Scenarios 5 and 6 was greater than that of the second trailer in the control vehicle, as would be expected. Differences between the multi-trailer combinations in the off-tracking and braking maneuvers were present but not as significant. Under the assumptions of the study, the Scenario 4 alternative configuration had a higher average axle load than the other combinations and had a marginally higher stopping distance. When the ABS on the lead dolly malfunctioned during the brake in a turn, all 28-ft. combinations experienced a path deviation of 35 in., which was short of a jackknife but would violate a 12-ft. lane. The 33-ft. combination of Scenario 4 was on the verge of instability, but its path deviation was not affected by the ABS malfunction under the specific conditions of this study.
Figure 16: Vertical Tire Forces during the Lane Change Maneuver for the 12-ft Lane Change for Control Vehicle CD[5]
The high-speed off-tracking of the three-trailer combinations was 8 to 9 in. greater than the control vehicle but still well within the width of a highway lane for that speed and curvature. All three multi-trailer study vehicles had a low-speed off-tracking roughly one third higher than did the control double.
These results quantify the effects of these specific changes to truck size and weight in the limited set of maneuvers studied here. The maneuvers were selected because they follow recognized vehicle dynamic performance standards or were used in previous studies. The results are representative of the respective vehicles’ behavior, but they would be different if similar maneuvers of different curvature or speed were selected.
[3] At each station down the road, off-tracking is the distance between the steer axle's lateral position and the following axle's position when it reached that station. Return to Footnote 3
[4] Note that the trailers experience more acceleration than does the tractor. Return to Footnote 4
[5] The vehicle leans to one side and then the other as it executes the avoidance maneuver. This removes load from tires on one end of each axle and transfers it to the other end. Return to Footnote 5