Comprehensive Truck Size and Weight Limits Study - Highway Safety and Truck Crash Comparative Analysis Technical Report
Appendix B: Safety Project Plan and Schedule
B.1 General Approach
This document presents the safety comparative analysis final draft project plan for the Safety Work Area of the Comprehensive Truck Size & Weight Limits Study (CTS&WLS). The Final Draft Project Plan/Schedule presents the methodology for the completing the safety analysis area of the Study.
The overall approach to the analysis includes four components:
- Desk Scan
- Analysis of Truck Crash Data
- Analysis of Vehicle Stability and Control
- Analysis of Safety Inspections and Violations
The specifics for each of these components are described in the remainder of this plan.
B.2 Desk Scan
A comprehensive investigation was conducted on studies and research in the area of truck safety related to truck size and weight policy. It included relevant truck size and weight reports, safety technologies that may improve heavy truck safety performance, notable international activities and an investigation of the availability and potential usefulness of trucking industry fleet data to support a fleet level analysis focusing on the influence of increased gross vehicle weight (GVW) and configuration variation on safety performance. The latest version of the Draft Desk Scan was made available to the public on the Project Website in November, 2013.
B.3 Analysis of Truck Crash Data
The goal of the crash data analysis is to predict the level of safety for alternative truck configurations and compare that level of safety to baseline (reference) truck configurations. Recall that the two baseline vehicles and six future configurations to be studied are:
- Five Axle, Tractor-Semitrailer Combination (3-S2), 80,000 pounds (Reference configuration) - The "standard" configuration of a three-axle tractor with a 53-ft., two-axle semitrailer and a GVW of 80,000 pounds.
- 3-S2, 88,000 pounds - The same tractor-semitrailer configuration, but with a GVW of 88,000 pounds.
- Six axle, Tractor-Semi-trailer Combination (3-S3), 97,000 pounds- A tractor-semitrailer configuration with a three-axle tractor and a three-axle semitrailer and a GVW of 97,000 pounds.
- Six axle, Tractor-Semi-trailer Combination (3-S3), 91,000 pounds - A tractor-semitrailer configuration that meets the Federal Bridge Formula with a three-axle tractor and a three-axle semitrailer and a GVW of 91,000 pounds.
- Twin 28.5 foot, 80,000 pounds (Reference configuration) - The current "standard" configuration of a tractor and two "twin" trailers, each 28.5 ft. long, and a GVW of 80,000 pounds.
- Twin 33 foot, 80,000 pounds - A twin configuration with two twin trailers, each 33 foot long and a GVW of 80,000 pounds
- Triple 28.5 foot, 105,000 pounds - A triple-trailer configuration with three 28.5 foot trailers and a GVW of 105,000 pounds.
- Triple 28.5 foot, 129,000 pounds - The triple-trailer configuration with three 28.5 foot trailers and a GVW of 129,000 pounds.
The level of safety is to be measured by crash rates for the different configurations. Obviously, such comparisons can only be made with data from trucks that are currently legally operating over the limit. Hence, the twin 33-ft. vehicles cannot be evaluated using crash data since they are not currently on the road.
Three possible methods for doing these comparisons will be conducted. One approach, by itself, will not provide the insights and answers that we are seeking regarding the safety of alternative configurations. A preliminary examination of the extent of the data available has been completed, including State crash data, traffic volumes, and fleet data. Once data has been compiled from the carriers and the States, the method(s) that offers the best chance of meeting the study objectives will be identified and developed. Other methods will be considered as offered through stakeholder outreach; such methods are not discussed in this document. As documented in the method descriptions that follow, the challenge for any method to be successful is the availability of crash data and exposure data for the target (future) and baseline (reference) truck configurations.
The first method is called as the route-based method: this route-based method compares the safety of routes that operate future configuration trucks and routes that operate baseline (reference) configurations. The second method is called as the fleet-based method, where the goal is to compare the crash history of baseline configuration trucks and future configuration trucks that are operated by the same carrier - the crash and exposure data from the carriers along with traffic volume (AADT) will be used for this analysis. The third method is the analysis of crash rates using State-based crash data. Following is further discussion about our thinking on the three methods.
Method 1: Route-Based Method
In order to do the comparison of crash rates, data is needed for crashes involving trucks and exposure by truck configuration (i.e., vehicle miles by truck configuration). Since the configurations involve differences in weight (either actual or registered gross weight), number of trailers (singles, doubles, triples), and length of individual trailers, ideally, both the crash and exposure data should include this information. Crash report forms from all 50 States have been reviewed. The goal of the review was to determine the availability of data from truck-related elements needed for our analysis - configuration, axles, length, and weight. Number of trailers and axles are available in the crash reports in many of the States. Length of trailers is available in a few States. For exposure, data from Weigh-in-Motion (WIM) stations and classification counts from permanent count stations can be used - these data sets have been used in previous studies to estimate the exposure of longer combination vehicles (e.g., Abdel-Rahim et al., 2006a; 2006b). Since the WIM stations are located predominantly on freeways and interstates, the main focus will be on these types of roadways.
The proposed analysis approach will involve the comparison of the safety performance of roadway segments and routes that operate trucks with the baseline configuration and those that operate trucks that belong to the future configurations (e.g., triples, heavier semitrailers and doubles). It should be emphasized that this procedure compares routes, not specific truck types. This is a less than desirable comparison but one that we feel will contribute knowledge to the results obtained from the other methods. The analysis will involve the following steps:
- Identify States with that allow future configuration trucks on certain routes, but do not allow future configuration trucks on other similar routes.
- Identify the specific routes and/or segments that operate future configuration trucks. The data from the WIM stations along with information from the States will be used to identify these routes and segments.
- Identify similar routes and/or segments that do not allow future configuration trucks. For each route and/or segment identified that allows future configuration trucks, we will seek to identify similar routes and segments that do not allow future configuration trucks (i.e., baseline routes). Again the data from the WIM stations will be used for this purpose. Factors such as traffic volume (AADT), area type (rural versus urban), overall truck percentage, number of lanes, and terrain, will be used to determine which segments are similar (most of this data about the routes and segments can be obtained from State Departments of Transportation (DOT); for Highway Safety Information System (HSIS) States. In some States, it may be difficult to identify a sufficient number of such segments. For example, all or most of the freeway/interstate routes may allow future configuration trucks. In that case, the routes and segments will be divided based on the proportion of future configuration trucks, (e.g., <5 percent, 5-10 percent, and more than 10 percent), and the routes and segments with lowest proportion of future configuration trucks will be considered as the baseline routes/segments.
- Estimate Safety Performance Functions (SPFs) using data from baseline routes and segments. SPFs are functions that relate the expected number of crashes to a measure of exposure (e.g., driving miles). SPFs explicitly recognize the fact that the relationship between crash frequency and exposure may not always be linear. Typically when SPFs are a function that relates the expected number of crashes to a measure of exposure (e.g., driving miles). Figure 1 is an example of the type of relationship often found between crash frequency and exposure. The SPF replaces, in a general way, the concept of the crash rate. If needed, the crash rate can be derived directly from the SPF as the slope of the line from the origin to the point of interest on the curve. The literature (Hauer, 1995) presents a description of the advantages of this approach and it is widely accepted by the road safety community.
Figure 1. Example Safety Performance Function
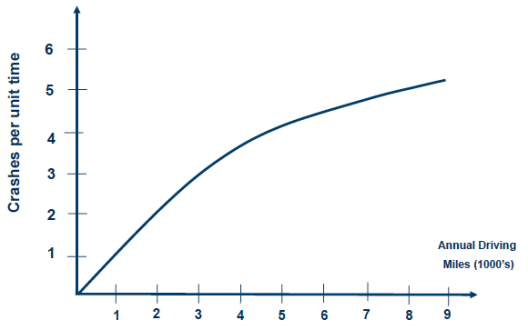
- The current state of the art is to use negative binomial regression to estimate the SPFs. The dependent variable will be the expected number of truck involvements in crashes in a particular segment. SPFs will be estimated for total truck crashes, and fatal and injury truck crashes; separate SPFs may be needed by time of day as well. The independent variables for this SPF will include traffic volume, overall truck percentage, area type (rural versus urban), number of lanes, terrain, whether a particular segment is within the influence of an interchange, and/or the number of interchanges within a section.
- Estimate the expected number of truck crashes in routes that allow future configuration trucks. Using the SPFs that are estimated in Step 4, and the characteristics of the routes that allow future configuration trucks, predict the number of the truck crashes in the routes that allow future configuration trucks. Estimate the expected number of crashes on these routes using the Empirical Bayes (EB) method (AASHTO, 2010). (This is the expected number of crashes on the routes that allow future configurations had these routes not allowed the future configuration trucks.)
- Compare the actual number of total truck crashes on the routes with future configuration trucks with the expected number of total truck crashes. The goal of this comparison is to determine if the reported number of truck crashes in the routes with future configuration trucks is significantly different from the expected number of truck crashes. This comparison will provide insight into whether the routes that allow future configuration trucks are associated with a higher/lower rate of crashes compared to routes that operate within the baseline.
It is important to note that the EB method has traditionally been used for before-after studies to determine the safety of engineering treatments (AASHTO, 2010). However, it is not within the scope of this Study to conduct a before-after study. As discussed above, this method will be adapted to obtain insight into whether routes that allow future configuration trucks are associated with a higher/lower rate of crashes compared to routes that allow only the baseline configurations. Further details about this approach are available from Bonneson and Pratt (2008).
An alternative approach is to combine the data from the baseline and routes with future configurations and estimate SPFs by including the percentage of alternative truck configurations trucks (based on the WIM data) as an independent variable (in addition to the other independent variables mentioned earlier). If the percentage of future configuration trucks is statistically significant, then findings can be identified as to whether the alternative truck configurations are associated with a higher/lower rate of crashes compared to trucks that operate within the baseline. If data are available, the possibility of categorizing the future configuration trucks into a range of weights can be explored and an assessment of the individual safety performance of the different weight categories may be possible.
An initial review has identified Ohio, Indiana, Maine, and Louisiana as possible candidates for this method. In Ohio and Indiana, triples are allowed on interstate toll roads, but not on other Interstates. So, in these two States, non-toll Interstate routes will be the 'baseline.' In Maine, heavier semitrailer trucks (more than 80,000 pounds) have been allowed on the Maine interstate turnpikes since 2008, but not on other interstates until 2013. So, similar to Ohio and Indiana, in Maine, the 'baseline' can include non-turnpike interstates. In Louisiana, heavier semitrailer trucks are allowed on interstates during the 100-day harvest season to accommodate the transport of sugarcane. Hence, for this State, the 'baseline' will be the Interstate roads during the non-harvest months. To the extent possible, the analysis will account for the differences between the summer and non-summer months by including traffic volume data (by month) from permanent count stations in the State and the WIM data, and by examining wet weather and dry weather crashes separately, and day and night crashes separately.
Efforts will continue to identify States that could be possible candidates for this method. Permitting offices in many States have been contacted and will efforts in reaching out will continue to help identify potential routes. Enforcement agencies in the States will be contacted as well; it is expected that enforcement agencies have insights on where various configurations are traveling. Finally, an evaluation of the availability and coverage of roadway segments where WIM data is being or has been collected is underway to determine the level of exposure data that are available for this area of the analysis, including the location of specific WIM stations on routes of interest. As part of the decision-making process, the extent of the mileage available in each State where reference trucks are traveling will be taken into account. It is recognized that the mileage available in some States is limited, and that care must be taken when attempting to extrapolate the results from these locations to a more extensive network of roadways. At the same time, selections will be limited by the locations where the reference configurations are presently operating.
Method 2: Fleet-Based Method
The availability of fleet data is being explored for use in the safety analysis in the CTS&WLS. Discussions have been conducted with the American Trucking Associations (ATA) and the American Transportation Research Institute (ATRI) in order to explore the possibility of accessing and using trucking company based information to supplement truck crash information and data available through public sector sources. For example, carrier contacts were established and are being pursued for crash and operations data reflecting triples operations and legal divisible heavy trucks (i.e., those regularly operating over 80,000 pounds). Two types of analyses are proposed: 1) a comparison of triples safety (i.e., three 28.5 foot trailers) compared to doubles (two 28.5 foot trailers) and 2) a comparison of the heavy legal vehicles compared to a 3-S2 80,000 pounds configuration. Additional private sector based truck crash data and operations may be pursued where critical gaps are noted in building the data sets required to complete the work in the area of the Project.
There are important commonalities in these analyses. Crash data will consist of USDOT-reportable crashes as these are most consistently reported and known to USDOT regulators; discussions with all trucking industry representatives indicate that this is a reasonable request. Exposure to risk data will be needed for all routes in question; this will be either number of dispatches or vehicle miles traveled. It is important that we obtain data on road segments with operations that result in zero crashes in a year as well as those with crash events. The preferred analysis approach is to use the SPF-based methods as described in method one. Where data are not available to use the Highway Safety Manual (HSM) methods, a comparison of mean crash rates will be undertaken.
In the Study application Method 2, the SPF will be developed from the crash and exposure data for baseline vehicles provided by carriers. It is likely that exposure from general traffic level as a covariate will need to be added. The effect of future vehicles will be estimated by comparing the crashes experienced with the future vehicles compared to the SPF developed from baseline vehicles using negative binomial regression This is the basic formulation to be pursued; other options will be explored within the limitations of available data.
Data Request and Data Custody
The data requests for legal divisible heavy trucks and triples analysis have been developed. The basic data elements requested from both groups of carriers include:
- Date of crash - would prefer historical data back to 2006 if possible.
- Time of Day
- Location of crash (street address; interstate highway; State route number and milepost or other location reference).
- State
- Gross Vehicle Weight
- Axle based weight
- Number of axles
- Axle spacings
- Number injured in truck
- Number injured in other involved vehicle
- Number killed in truck
- Number killed in other involved vehicle
- Truck driver age
- Truck driver experience with firm
-
Type of collision
- Truck rear-ending passenger vehicle
- Passenger vehicle rear ending truck
- Truck crossing center median (head on)
- Passenger vehicle crossing center median (head on)
- Truck striking passenger vehicle (other)
- Passenger vehicle striking truck (other)
- Truck single-vehicle crash
- Driver-related factors in crash
- Vehicle-related factors in crash
- Roadway/weather related factors in crash
-
Seat belt use
- Truck driver
- Passenger vehicle driver and passengers
- Driver and vehicle violations - truck
- Driver-related factors - passenger car
Requests for these data have been transmitted directly to carriers. Responses from the carriers are currently pending at this time. A data use agreement and data custody policy has been crafted. Both are aimed at protecting the confidentiality of the carrier and their data, by assuring that access to and use of the raw data will be restricted. Figure 2 shows the data custody guideline proposed for use with carrier data. Note that the carrier data (item 2 in Data/Model Access section) will be subject to limited access and availability. In addition, the identity of participating carriers will be shielded using several methods: aggregating analysis results; using letters or other acronyms for locations (if potentially revealing); or, other techniques as required.
Analysis of vehicle crash experience for over-80,000 pounds trucks
Obtaining fleet data for heavy truck operations has proven more challenging than for triples. Additional discussions with the ATA and ATRI have led to the need to approach industry through the State-level ATA's. Both industry organizations agree that the users of these heavier legal trucks are dispersed across the industry as well as geographically. A project description was prepared for communication with the industry and was delivered to ATRI. Current indications are that 10-12 carriers are considering participation in the analysis of heavy divisible load vehicles. More definitive commitments are expected very soon.
One aspect of the comparison is that there is a range of these legal heavy vehicles operating in different States: 85,000 pounds, 88,000 pounds, and 90,000 pounds. Separate comparisons for each of these three weights will be conducted. It is likely that the data will need to be pooled together as there may not be a sufficient sample size of each weight class to conduct separate analyses.
The purpose of this portion of the fleet-level analysis is to evaluate the relative safety of heavy divisible load vehicles in practice. The fleet-level analysis will be a comparison within carriers that operate more than one of the alternative configurations. The analysis approach uses a paired comparison method in which route-specific crash frequencies and rates are compared for the same firm operating on different routes. The number of dispatches of each vehicle type along each specific route in a year is used to estimate vehicle miles traveled, and a matched-pair comparison of means is used to compare rate differences for the baseline and comparison vehicles operated by the same company on the each route. This approach indicates the risk to all travelers of having each vehicle operate. The travel will be checked to see if it is occurring at similar times, months, etc.; the preliminary finding is that this seems like a feasible approach. If the heavy vehicles are limited to truckload operations, then we need to look for "lanes" commonly used to route the vehicles to customers.
Specific steps in the analysis include:
- Obtain agreement with 3-4 truck fleets that operate both legal divisible heavy vehicles and 80,000 pounds comparable vehicles (3-S2). Carriers with geographically distributed operations and a range of sizes are ideally suited for this having this data.
- Identify and obtain crash and exposure data from the fleets that operate both baseline and alternative configurations.
- Process data to determine the types of analyses that can be performed, including related factors that affect safety outcomes, such as driver tenure, crash avoidance and other vehicle-based technologies.
- Perform appropriate paired-comparison statistical analysis (Jovanis, et al., 1990).
- Compare crash frequency and severity distributions within each fleet for the crashes of trucks that operate within the 80,000 pounds limit and trucks that operate legally over the 80,000 pounds limit.
An alternative method to the matched-pair approach is to use the HSM formulation in which the road baseline vehicle AADT is used as the basic measure of exposure and then the company's divisible heavy vehicle crash experience and AADT are added as "after treatment" observations. This formulation will indicate if the divisible load heavy vehicles have a higher expected number of crashes than the 80,000 pounds AADT. When permitted by the data, level of severity and crashes by type will also be analyzed by building SPF using crashes of different types.
Status of legal divisible heavy truck data analysis with fleet data. Some commitments from carriers have been received; it is expected that additional commitments will be made during the next few weeks. The data use agreement and data requirements have already been sent to carriers. Once contact is established with an individual firm, access to crash and operations data will be pursued; it is expected that this will occur during the months of November and December, 2013. To the extent possible, crash information will be verified by secondary sources. To date, two firms have indicated a willingness to provide data for this portion of the Study and one has returned a signed data sharing agreement.
Approach to triples safety analysis using fleet data
Contact has been established with four carriers. Early discussions with these carriers gave the consistent message that carriers using triples operate an overwhelming proportion of triples on routes where they are allowed (because of the operational efficiencies), so twin trailer mileage on these routes is very low, and consequently crashes are few. As a result, the paired-comparison method is not feasible for triples analysis. An alternative plan to work around the problem has been discussed with the fleets. This approach is to obtain doubles crash and operations data for other routes in each carrier's operating environment nationwide. Care would be taken to obtain match routes for doubles operations that are comparable to those of triples. Crash data as well as miles traveled (or number of dispatches) is being pursued for each route traveled by the triples. It is important to obtain data on as many routes as possible, including those with zero crashes. The triples crash experience would be compared to those of doubles on these "comparable routes." The technique is similar to the approach discussed for comparing routes with and without the heavy divisible load trucks) using the HSM approach. The comparison sites (i.e., the routes with the doubles) would be used to build SPFs; the actual experience of the triples operations would be compared to these sites This comparison takes advantage of the fact that the range of error about the SPF is known and can be compared to the data for the triples as one would do in a comparison of differences between means.
Specific steps in the analysis include:
- Seek agreements with 2-4 carriers operating triples that are willing to share their crash and operations data. The operations data, specific routes and times of day of triples dispatch, will be used to identify comparable doubles road segments.
- Use carrier-supplied data to match routes of operation for triples with comparable routes for doubles. State-level data will be used to identify road segments used by twin trailer combinations across the country that are reasonably comparable to those used for the triples. The crash experience for double trailer combinations of the fleets will be obtained for these additional national-scale road segments.
- Particular attention will be paid to traffic levels of personal vehicles (those other than trucks) so that appropriate comparisons can be made of crash risk. If possible, two - three road segments used by double trailer combinations will be used for comparison with each segment used by triple-trailer combinations in order to develop satisfactory precision for the analysis. It is possible that some carriers may be operating triples over the same Interstate routes in the west; these overlapping operations will be considered in the analysis.
- Identify and obtain crash and exposure data from the fleets that operate both triple trailer and baseline twin-trailer configurations and build the needed SPFs from the double trailer combination's operations.
- Perform appropriate statistical analysis, depending on the type and detail of crash and exposure data available. If the SPF comparison is not possible, then crash rates will be used.
- To the extent possible with the obtained fleet doubles records, compare crash severity distributions for triples and doubles.
Status of triples data analysis with fleet data. Direct communications with carrier safety personnel has been established to describe the details of the Study data needs. One carrier has supplied some crash data and is assembling additional data consistent with a signed data sharing agreement. Clarification of the status of the other three that were already contacted is being pursued and steps have been taken to reach out to an additional two carriers.
Method 3: State Crash Rate Analysis
Both the fleet-based and the route-based methods are aimed at comparing the crash-based level of safety for future truck configurations with current baseline trucks. Depending on the level of detail and amount of data available for both these methods, difficulties may be encountered in developing estimates of crash increases or decreases for each individual future truck configuration of interest. In an attempt to develop specific safety estimates for each future configuration, attempts will be made to conduct analyses based on crash and exposure data from individual States.
The basic method here will be to:
- Identify States in which individual future configurations can be identified through the use of variables in the existing crash data;
- Identify the subset of these States where information is available from State DOT staff and/or trucking fleets concerning which individual future configurations have accumulated adequate annual VMT to result in a reasonable sample size of crashes (i.e., which future configurations have accumulated significant exposure in which State);
- Work with those State DOTs to identify specific routes or route sections on which large numbers of both the alternative truck configurations and current baseline trucks (i.e., 53-ft., 80,000-lb. semitrailers and twin 28-ft. trailers) operate;
- Obtain total AADT for each route study section;
- Obtain WIM data for those routes and combine with the AADTs to develop VMT estimates for each baseline and alternative truck configuration, and
- Estimate safety performance functions (discussed in Method 1 section) to compare the safety of baseline trucks and alternative truck configurations.
The remainder of this section concerns the first step above - the identification of States with sufficient VMT for the truck configurations to be studied in which adequately detailed truck descriptors are included on their crash report forms. Recall that the two reference (baseline) vehicles and six alternative truck configurations to be studied are:
- 3-S2, 80,000 pounds (Reference configuration) - The "standard" configuration of a three-axle tractor with a 53 ft two-axle semitrailer and a GVW of 80,000 pounds.
- 3-S2, 88,000 pounds - The same tractor-semitrailer configuration, but with a GVW of 88,000 pounds.
- 3-S3, 97,000 pounds - A tractor-semitrailer configuration with a three-axle tractor and a three axle semitrailer and a GVW of 97,000 pounds.
- 3-S3, 91,000 pounds - A tractor-semitrailer configuration with a three-axle tractor and a three axle semitrailer and a GVW of 91,000 pounds that complies with the Federal Bridge Formula.
- Twin 28.5 ft, 80,000 pounds (Reference configuration) - The current "standard" configuration of a tractor and two "twin" trailers, each 28.5 ft long, and a GVW of 80,000 pounds.
- Twin 33 ft, 80,000 pounds - A twin configuration with two twin trailers, each 33 ft long and a GVW of 80,000 pounds.
- Triple 28.5 ft, 105,000 pounds - A triple-trailer configuration with three 28.5 ft trailers and a GVW of 105,000 pounds.
- Triple 28.5 ft, 129,000 pounds - The triple-trailer configuration with three 28.5 ft trailers and a GVW of 129,000 pounds.
In order to conduct the Method 3 crash analysis, States must be identified in which the following are true:
- There is significant VMT for both one or more alternative truck configurations and the pertinent reference vehicle - e.g., sufficient triples VMT and sufficient twin 28.5 ft, 80,000 pounds VMT. (Note that there will be adequate exposure data for the reference vehicles in all States.)
- In the crash data, the reference vehicle can be distinguished from each of the alternative truck configurations and the alternative truck configurations can be distinguished from each other (e.g., if both 105,000 pounds and 129,000 pounds triples are operating in the same State). This separation has to be done using only number of trailers and number of total axles, since none of the States has "actual" weight information on the crash report forms. Many of the States have fields for reporting the GVWR, but we have not discovered any States of interest to date that are actually recording the actual loaded weight of the truck.
The 3-S2, 88,000 pounds configuration will be examined by looking at States which allow 90,000 pound intermodal container chassis combinations. These intermodal container chassis combinations may be easily discernible by looking at accident records and FMCSA database coding schemes allow easy analysis of roadside vehicle inspection data for intermodal container chassis.
It may not be possible to conduct an empirical analysis the two twin 33 ft configurations. The twin 33 foot configurations have never been operated in the United States; discussion continues as to whether the twin trailer STAA control vehicle can be used as a suitable surrogate. Maintenance and inspection records and information on the twin 28 foot trailer combination may be useful in the comparative assessment of the twin 33 trailer combination for example. Thus, the following discussion will only concern identifying States where analyses for the tractor-semitrailer configuration or the two triple configurations can be conducted (i.e., (1) the 3-S2, 80,000 pounds reference vehicle can be compared to the 3-S3, 97,000 pounds future vehicle, and/or (2) the twin 28.5 ft, 80,000 pounds reference vehicle can be compared to the triple 28.5 ft, 105,000 pounds vehicle and to the triple 28.5 ft, 129,000 pounds vehicle). The decisions are based on different data inputs for the two different future vehicle types. The following text provides details for each.
Analysis of Triples
The inputs to the decision concerning which States will be used to compare the reference twin to the two triple configurations were from the following sources:
- A table listing States allowing triples under the ISTEA Freeze is based on data extracted from the Title 23 Code of Federal Regulations, Part 658, Appendix C. For each of the 17 States allowing triples, the table provided information on "Allowable Length - Cargo Carrying Units (feet)" and "Gross Vehicle Weight Limit (pounds)".
- 2008 VMT data for each of 25 vehicle configurations for each of 14 functional classes within each State has been developed.
- Presence of "number of trailers" and "number of total axles" variables on State crash report forms. This information was compiled through searches for crash report forms from internet sources.
The results of this combination of data are shown in Table 1. Each item is explained below.
Since significant VMT of triples is critical to this analysis, the 2008 VMT data were searched to identify triples States with VMT for either or both seven axle triple-trailer combinations (TS7) and eight or more axle triple-trailer combinations (TS8+) configurations. The triples VMT levels for each State was then categorized as either very low, low, medium or high by functional class (mainly rural and urban interstates, as expected). In addition, for these same triples States, similar VMT information was extracted for each doubles category (i.e., VMT for double trailer combinations with five axles (DS5), double trailer combinations with six axles (DS6), double trailer combinations with seven axles (DS7), and double trailer combinations with eight axles (DS8) since the first two are potential reference vehicles. Note that the use of 2008 VMT is suitable since the analysis will include crash data from 2008 - 2012, and a verification of triples use was needed for the full period.
Finally, information on the presence of crash form variables related to number of trailers and number of axles were added to the table for each triples State. Again, the axle count information is critical in the separation of data for the 28.5 ft, 80,000 pounds twin configuration from data for the heavier doubles configuration. Initially, it was hoped that the axles count could also separate the triples into the two weight categories - i.e., that the 7-axle triples would be more likely to have 105,500 pounds GVW and the 8+ axle triples would be more likely to have 129,000 pounds GVW. However, after further discussions, it was indicated that this was not likely to be the case - that the number of axles on triples is not a good indicator of maximum GVW. For that reason, the attempt to analyze the crash experience of the two target GVW classes will be accomplished by using States with different GVW limits. That is, the sample of States to be studied will include both ones with a 105,500 pounds GVW limit and ones with a 129,000 pounds GVW limit.
Conclusions concerning the suitability for use in the analysis for each of the triples States are shown in the final column. In summary, as noted above, the primary three criteria a State should meet in order to allow a sound analysis of triples are:
- High VMT for triples
- Ability to limit the reference group to 28.5 ft, 80,000 pounds twin-trailer configuration. This can be done by using an axle count variable on the crash form or if the VMTs for DS5 and DS6 or much higher than the VMTs for DS7, DS8 and DS9.
- A GVW limit that matches the two possible future configurations -- 105,500 pounds and 129,000 pounds triples.
While none of the States allowing triples fit all three criteria, at this point it appears that the best States are as follows:
-
105,500 pounds triples
- Idaho - Even though the triples VMT is not high, the reference group will be sound. Crash data for 2010 and earlier will be used.
- Oregon - Less acceptable than Idaho. Even though matching the 105,000 pounds GVW limit and having very high triples VMT, the reference group cannot be limited to the target DS5 and DS6 configurations.
-
129,000 pounds triples
- Kansas - Even though the 120,000 pounds GVW limit is less than the 129,000 pounds target, it is acceptable due to the higher triples VMT and the ability to develop a sound reference group.
- Nevada - Less acceptable than Kansas. While the GVW limit matches the target 129,000 pounds and there appears to be adequate triples VMT, the reference group cannot be limited to the target DS5 and DS6 configurations.
- Utah - Less acceptable than Kansas. Like Nevada, while the GVW limit matches the target 129,000 pounds and there appears to be adequate triples VMT, the reference group cannot be limited to the target DS5 and DS6 configurations.
The final choice of States for use in this triples analysis (and indeed the viability of the entire methodology) will depend to a great extent on the adequacy of the WIM data. The WIM stations in any State are somewhat limited. For the analysis to be successful, these "spot counts" must be extrapolated to a large sample of similar roadway sections in the same State. During the Desk Scan phase, no description of such a methodology being used before was identified. An acceptable one will have to be developed.
Analysis of Heavy Tractor-Semitrailer Configuration
This second analysis involves comparison of crash experience for two types of tractor-semitrailer configurations. The target future configuration has three axles on the tractor, three on the trailer, and a GVW limit of 97,000 pounds. (These will be referred to as "heavy semitrailers" in the following discussion.) The reference vehicle is the standard tractor-semitrailer combination with the three axles on the tractor, two on the trailer and an 80,000 pounds GVW limit. As in the triples analysis, the primary criteria for including a State in the analysis are:
- There is significant VMT for both the heavy semitrailers and the reference vehicle. (Note that there will be adequate VMT for the reference vehicles in all States.)
- In the crash data, the heavy semitrailers can be distinguished from the reference vehicle using only number of trailers and number of total axles. It is noted that the assumption here is that a six-axle semitrailer is indeed a "heavy" semitrailer. Since VMT for six-axle trucks was found on Interstates in States with a GVW limit of 80,000 pounds, this assumption is not completely true. As noted below, to better identify States in which a six-axle configuration is more likely to be a heavy semitrailer, only States where the six-axle configuration can be identified and which have a GVW limit higher than 80,000 pounds are being considered for this analysis.
The inputs to the decision concerning which States will be used in this analysis were from the following sources:
- A table of "Grandfathered Weights Allowed by States". This table was prepared by the Truck Size and Weight Program Office within the FHWA Office of Freight Management and Operations. The data are based on U.S. Code Title 23 Section 127.
- A table of "State Weight Exemptions (As of March 2008)". This table was prepared by the Truck Size and Weight Program Office within FHWA Office of Freight Management and Operations. The data are based on US Code Title 23 Section 127.
- A table of "CTS&WLS Heavies (grandfathered over 80,000 pounds) allowed on Interstate System. Updated 11-14-13." This table listing States was developed for use in the Volume II: Compliance Comparative Assessment work area of the Study with input provided by CVSA.
- 2008 VMT data for each of 25 vehicle configurations for each of 14 functional classes within each State. The classes of interest in this analysis are target configuration CS6 (conventional tractor-semitrailer with six axles) and reference configuration 3-S2 (conventional tractor-semitrailer with three axles on the tractor and two axles on the semitrailer).
- Presence of "number of trailers" and "number of total axles" variables on State crash report forms. This information was compiled through searches for crash report forms from internet sources.
The results of this combination of data are shown in Table 2. The columns are explained in the following text.
Note that the following discussion will concern choosing States for analyses of the heavy semitrailers on Interstates even though information is also desired about the safety of these vehicles on non-Interstate routes. The rationale used is that if a State allows these heavy semitrailers on Interstate routes, they are also very likely to allow them on non-Interstate routes. Then the same State's data can (and will) be used to analyze safety on both roadway types.
The first two documents were reviewed and compared to identify States that have allowed heavy semitrailers on Interstate highways since at least 2008. Differences between the sources are indicated by a question mark in the GVW Limit column. States with these differences are lower priority than States without. The 13 States allowing use of these heavy semitrailers are listed in the first column of the table. As with the triples analysis, the crash sample size will be maximized by using States with the highest VMT for heavies. The 2008 VMT data for the heavies on rural Interstates, rural major arterials, and urban Interstate/other-expressways were extracted for these 13 States. Finally, information on the presence of crash form variables related to number of axles was added to the table for each heavy semitrailers State. (Note that all of the States have a "number of trailers" variable. Again, the axle count information is critical in the separation of data for the six-axle heavies from the five-axle semitrailers in the reference group.)
Conclusions that were developed concerning the suitability for use in the analysis are shown for each of the heavy semitrailers States in the final column. Recall that the primary three criteria a State should meet in order to allow a sound analysis of heavy semitrailers are:
- High VMT for the heavy semitrailers.
- Ability to separate the six-axle heavy configuration from the five-axle reference configuration in the crash data.
- A GVW limit that matches the 97,000 pounds target limit as closely as possible.
While none of the States allowing heavies fit all three criteria, at this point it appears that the best States are as follows:
- Michigan - Medium-high VMT for heavy semitrailers on all three road classes, and the presence of the axle count variable on the crash form means that heavy semitrailers can be separated from the reference group. While the 104,000 pounds GVW limit is not 97,000 pounds, it is close.
- Idaho - Less acceptable than Michigan - Medium heavies VMT on rural Interstate and rural major arterials. The heavies can be separated from the reference group semitrailers. While the GVW limit of 105,500 pounds is not the target 97,000 pounds, it is close.
- Washington - Medium VMT for heavy semitrailers, but may have to use the 7-axle configuration rather than the target 6-axle configuration to better identify heavier GVWs. The presence of the axle count variable on the crash form means that heavy semitrailers can be separated from the reference group. While the 105,500 pounds GVW limit is not 97,000 pounds, it is close. In addition, crash data and detailed AADT and roadway data which will be needed in the analysis are available through FHWA's Highway Safety Information System (HSIS).
- Kentucky - Very high VMT for heavy semitrailers on Interstate and RMA. The presence of the axle count variable on the crash form means that heavy semitrailers can be separated from the reference group. May have to use 7-axle configuration to better isolate heavier GVWs. Unfortunately, the GVW limit is unknown at this time.
- Maine - Less acceptable than the other four due to low VMT for heavy semitrailers on rural Interstates. This is because heavies have traditionally been limited to the Maine Turnpike. However, Maine crash, AADT and other roadway data are available through HSIS. If examination of heavy semitrailers crashes on the Turnpike indicates a sufficient sample size, the priority will increase. The heavy semitrailers can be separated from the reference group semitrailers, and the GVW limit is equal to the target 97,000 pounds.
As with the triples analyses, the final choice of States for use in this heavy semitrailers analysis will depend to a great extent on the adequacy of the WIM data. There must be acceptable numbers of WIM stations within each State and an acceptable methodology will have to be developed to extrapolate the limited WIM station counts to a large sample of similar roadway sections in the same State.
It is important to note that roadway safety infrastructure like median barriers and guide rail systems must be considered as part of the evaluation of heavy commercial motor vehicle impacts. Currently, median barriers are tested using a 80,000 pound truck's impact. A weight increase causes a re-examination as to the durability and performance of median barriers as well as guide rail. Guidance and direction from FHWA's Office of Safety in performing an assessment on roadway safety infrastructure performance is being formulated so as to assess the impacts that heavier trucks may have in this area.
Data Availability for Method 3 Analyses
As noted above, crash data, roadway inventory data and AADT data for 2008-2012 will have to be acquired for both the triples and heavies study for each State chosen. At this point there are eight candidate States - Oregon, Kansas, Nevada and Utah for the triples study, Washington, North Dakota and perhaps Maine for the heavy semitrailers study, and Idaho for both. Washington and Maine crash, inventory and AADT data are available from HSIS. NHTSA's State Data System (SDS) has captured multiple years of crash data from certain States. Some States will allow non-NHTSA access to their data with prior permission. If SDS crash data are not available, a request for the data will be made to the State. Current SDS information indicates the following:
-
Triples study
- Idaho - No SDS data. Will have to obtain from Idaho.
- Oregon - No SDS data. Will have to obtain from Oregon.
- Kansas - 2008 data available with permission in SDS. 2009 -2012 data will have to be obtained from Kansas.
- Nevada - No SDS data. Will have to obtain from Nevada.
- Utah - No SDS data. Will have to obtain from Utah.
-
Heavies study
- Michigan - 2008-2009 data available with permission in SDS. 2010-2012 data will have to be obtained from Michigan.
- Idaho - No SDS data. Will have to obtain from Idaho.
- Washington - Available in HSIS.
- Kentucky - 2008-2010 data available with permission in SDS. 2011 -2012 data will have to be obtained from Kentucky.
- Maine - Available in HSIS.
In general, SDS will not be a useful source of crash data for this study. All years of crash data for the chosen States will have to be collected from the States.
Except for Washington and Maine, roadway inventory and AADT data will have to be obtained directly from the chosen States. It is noted that States generally only retain current year inventory data, but usually do retain historical AADT data.
Except for Washington and Maine where customized analysis files can be obtained from HSIS, the development of State analysis files will require significant effort. Crashes involving the trucks to be analyzed will have to be linked with roadway segments in order to link with AADT data. WIM station data (perhaps with a different linear reference system than the crash and inventory/AADT data) will have to be linked to the roadway segments and extrapolated to longer study segments. Procedures will be formulated to link and merge State-based crash, inventory and AADT data to make this complex process as efficient as possible.
Limitations of State Crash Rate Analyses
- A key assumption in the heavy semitrailer analysis is that a six-axle tractor-semitrailer combination is a "heavy" vehicle type in all cases. Since six-axle VMT was found on Interstates in States with a GVW limit of 80,000 pounds, this may not be completely true. State permit information is needed to determine if indeed these vehicles are operating at 80,000 pounds or less or operating under a State issued overweight permit at a weight greater than 80,000 pounds. In other cases, 6-axle trucks may be operating at or below current Federal weight limits. Further investigations will be conducted in this area.
- The current six-axle configurations may be carrying different commodities than will the CTS&WLS alternative six-axle configurations. Thus, the carriers may differ, which in turn may cause the "safety culture" to differ (e.g., driver training, driver experience, truck maintenance procedures, equipment age, etc.) The study will identify any commodity specific qualifications for current six-axle data used from the States from which it is gathered.
- The drivers of the current six-axle configurations may differ from the future drivers in terms of training, experience, and abilities.
Unfortunately, none of these factors can be controlled for in data available for use in this Study. However, even if such data existed (e.g., crash data concerning the driver's years of experience driving triples), it is not possible at this time to accurately predict what the future fleet will be. While certainly not perfect, the goal of this crash analysis is to provide as much data-driven information as possible for use in decisions concerning that future fleet.
B.4 Analysis of Vehicle Stability and Control
In brief, the work in this subtask is to develop computer models of a various vehicle configurations, simulate those configurations through a series of scenarios, and observe trends in objective performance parameters.
Consultation with personnel from USDOT's FHWA, National Highway Traffic Safety Administration (NHTSA) and Federal Motor Carrier Safety Administration (FMCSA) will be conducted to investigate the differences in vehicle performance with regard to vehicle stability and vehicle control (VSC) for trucks that operate within Federal size and weight limits and actual or hypothetical trucks that might operate in excess of current Federal limits. An evaluation and assessment of the operational performance will be conducted with regard to stability and control, including vehicle braking, for the alternative configurations selected for this project. These alternative truck configurations will be evaluated with regard to their performance maneuvers or scenarios. The performance of the vehicles will be compared with two control vehicles that meet current Federal truck size and weight limits: a 5-axle tractor with a 53 ft semitrailer having a GVW of 80,000 pounds, and a tractor with twin 28 ft semitrailers, also with five axles and weighing 80,000 pounds.
Figure 3 depicts the approach graphically. The alternative configurations to be assessed in the Study have been identified and the highway network scenarios are currently being developed. This broad guidance will be translated into specific vehicle models and maneuver paths. Finally, an examination of the results will be undertaken to identify trends and commonalities and assemble a set of technical findings.
Data
Data to support this effort will come from a number of sources. Consultation with personnel that have validated models of heavy vehicles in many configurations that approximate those being considered will be conducted. Inputs will also come from industry or inquiries program area experts within FHWA. Publications will be consulted as necessary, and other activities within this project are expected to produce relevant findings as well.
Model
Models of proposed configurations of large vehicles will be developed in TruckSim, a commercially available and widely accepted software package. The configurations will be run through a series of scenarios.
Figure 3. Vehicle Stability and Control Approach Workflow
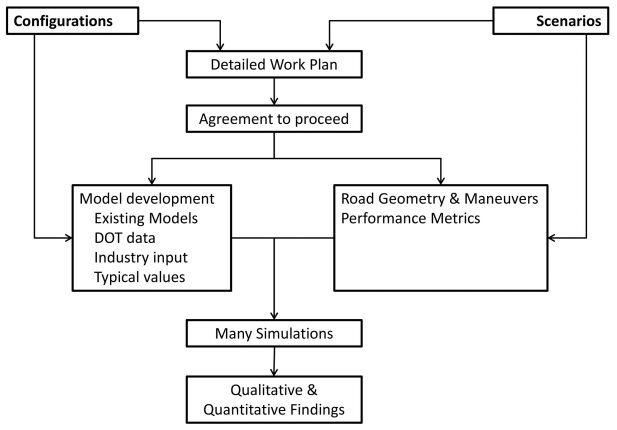
Configurations
Six commercial motor vehicle configurations have been selected for the Study, as presented in Figure 4. One vehicle in each geometry will be modeled, and then the variations in loading and braking condition discussed below will be made. All are dry van trailers with rigid loads. Steer axles will have two tires, and all other axles will have duals on both ends. As indicated in the figure, most of the multi-trailer geometries will be modeled with two styles of couplings, "A-train" and "B-train." All vehicles will be modeled with air ride suspension rather than leaf springs. Vehicle tare weights, dimensions, suspension behavior, and other properties will be typical of United States practice.
Within most of the geometries, at least two load distributions are planned. All loads will be fixed and will be centered longitudinally and laterally within the trailer. Inertias and vertical load locations will be representative of prior testing.
In the two braking scenarios listed below, each of the above combinations will be tested in three braking conditions:
- Functioning Anti-lock braking system (ABS) on all axle ends. Normal TruckSim ABS model.
- ABS malfunctioning on one axle end. The wheels lock when brakes are applied.
- Brake malfunctioning on one axle end. Braking torque is zero.
- FMCSA brake testing data on 3S-2 Base Case 80K, and 88K will be reviewed and included in the study.
- FMCSA brake testing data on 3S-3 97K pound truck will be reviewed and included in the study.
Vehicle Stability and Control Scenarios
The vehicle configurations will be simulated in various VSC scenarios to evaluate their performance. To the extent possible, scenarios will be based on established test procedures so that the results will be comparable with those of other studies.
These maneuvers and associated metrics are based on prior studies of larger trucks. The crash data and fleet analyses may find other specific vulnerabilities of certain configurations of trucks.
Figure 4 includes the listing of truck configurations being evaluated in the Study.
Methodology
The steps are:
- Determine the vehicle dimensions, axle spacing, fifth wheel settings and hitch offsets that represent practical vehicle design characteristics. Determine other vehicle properties such as the cargo load characteristics and generalized tire and suspension properties. Consultation with industry will be required at this step.
- Assemble simulations models and compile each configuration.
- Define roadway models and simulated maneuvers to represent each of the VSC scenarios.
- Finalize the performance metrics. Some of the standards in Table 3 are based on those in the 2000 Comprehensive Truck Size & Weight Study as well as the 2004 Western Governor's Uniformity Scenario Analysis.
- Run the simulation models.
- Conduct the comparative analysis and codify the findings.
Certain quantities will be extracted from the results of each simulation to calculate performance-metrics, such as load transfer ratio, maximum lateral excursion, and rearward amplification. These metrics will be tabulated according to vehicle configuration so that the behavior of the respective configurations can be compared.
Trends and commonalities in the metrics will be noted and put in the draft report that documents the assumptions, approach, and results. The report will justify the assumptions. Example images to illustrate the scenarios will be included. Details of the models and raw data are expected to be in appendixes.
Approach
The technical approach will be conducted by performing the following tasks.
Build Simulation Models
The models will be built in TruckSim. Models for some of the configurations are expected to be available from prior projects. Models for other configurations can be adapted from these models. The models will be developed primarily using vehicle and tire parametric data currently available in the public domain. As necessary, vehicle and tire data sets will be augmented to fit specific vehicle configurations and loading conditions. This project does not include making any laboratory measurements to obtain vehicle or tire parameters, or conducting dynamic field tests for the purpose of validating full vehicle models. Models will be built so they represent vehicles that meet the current stopping distance requirements of Federal Motor Vehicle Safety Standards (FMVSS) 121. Electronic Stability Control, as in the proposed new FMVSS 136, is not included. The selected the configurations to be modeled are presented in Figure 4 and serve as the basis for estimating the effort.
Roadway models will be developed to define the scenarios in Table 3. Simulated vehicle runs will be made to follow the desired path using open-loop control or the driver model in TruckSim, whichever achieves the best approximation in each scenario.
A means of efficiently will be developed executing the many simulations. This will allow key values to be extracted from the simulation results, so the performance-based metrics can be calculated from them.
Execute the Simulations
The six basic geometric truck configurations and their variants will be run through the VSC scenarios according to the project plan. As simulations are run, a check for unexpected results will be made and adjustments to the models may be needed or new cases may need to be run to answer questions that arise. A number of preliminary simulation runs will be necessary to develop the models. Some runs may be repeated under slightly varying conditions to isolate the worst case behavior. The number of simulation runs in the final set to calculate the performance metrics is estimated in the Table 4. The first row of numbers is for the VSC scenarios that do not require braking, and the second row of numbers is for the straight and curved braking scenarios.
Summarize Findings
Findings on the simulation results and their implications will be prepared for the stability and control of vehicles within and beyond current Federal truck size and weight limits. The trends and commonalities discovered in the simulations results will be provided. Tables and sketches will document the configurations and variations. Animation stills and graphs will depict the scenarios. Detailed descriptions of the models will also be provided.
B.5 Safety Inspections and Violations Analysis
The goal of this subtask is to understand the implications of truck size and/or weight on the safe highway operations, on the rate of consumption of service life of roadway infrastructure (pavement and bridge service life) and on goods movements by other modes of transportation.
Approach
Identify Data Needs
The use of current, accurate data and up-to-date, effective modeling tools is critical to the success of this project. The USDOT is in possession of a number of national datasets related to commercial vehicle operations. For example, data from Commercial Driver's License Information System (CDLIS) can provide information on the type of licenses that exist among commercial drivers (number of Class A, B, and C, with special restrictions/exemptions to exceed Federal weight limits). Multi-year data from the Motor Carrier Management Information Systems (MCMIS) will be relevant for identifying crashes and inspection violations that may be associated with weight and size limits. The inspection file contains a field for GVW, which will be particularly useful for segmenting truck configurations (Subtask 2). This database also contains company safety profiles.
As part of this task, an additional search through the literature may be needed to identify factors associated with truck weight and size violations. Based on these past studies and discussions with experts in the field, a list of the variables needed to conduct the safety inspection and violations analysis will be prepared and national databases identified where data would be obtained the data.
Finalize Technical Analysis Plan
The data identified in the prior task will be reviewed and efforts will be made to fill in gaps where there are missing data or if additional variables are needed. Once the data is prepared, work will begin on data segmentation/aggregating the data as appropriate for data analysis. The specific data segmentations will include (but not limited to):
- Classifying specific configurations for comparisons (e.g., tractor-semitrailers) as 80,000 pounds or over 80,000 pounds using the GVW field in the inspection data.
- Aggregating inspections from States to sets with relatively similar size and weight regulations.
- Primarily, Level 1 Inspections will be analyzed. Level 2 and Level 3 Inspections will also be included where driver training requirements are relevant (for example, operating combinations that include double and triple-trailer combinations).
- Segmenting violation types based on driver, vehicle, or other (e.g., paperwork).
Data Analysis
In this task, an assessment of the impact that a truck's compliance with size and weight limits on safety will be conducted using the data procured and cleaned from work completed earlier in this area of the Study. The data analysis will include descriptive statistics, which will include numerical (e.g., mean, standard deviations, min, max) and graphical summaries (e.g., boxplots, time-series plots and trends). The descriptive statistics will reveal if there are any patterns of violations for within 80,000 pounds and over 80,000 pounds configurations. The descriptive statistics will also show whether patterns of violations exist for States that follow the Federal 80,000 pounds weight limit and those that permit operations over 80,000 pounds. These patterns will be further examined using inferential statistics as appropriate.
The inferential statistics will be highly dependent on the quality of data received and will be regression based given the a priori hypothesis. The data is also multi-year and will most likely require a mixed linear model, random effects approach. A crucial component will relate to the sample size for specific events associated with weight and size limits. If the sample size is small, a reevaluation will be conducted as to whether rolling up the data to the carrier level would be more meaningful, or if a bootstrapping method (to resample based on the distribution of the existing sample) would be feasible. Incidence and rate of violations and out-of-service conditions for within 80,000 pounds and over 80,000 pounds configurations will be computed. Rates will be computed for weight-related, specific systems critical to safe operations for alternative truck configurations, drivers, and other violations as available from the data.
Summarize Findings
A summary of the findings of the data analyses will be completed for the safety inspections and violations analysis and provide input to the final report.
B.6 Findings Summary and Final Report
The results of all analysis efforts - truck crash, vehicle stability and control, and safety inspections, and violations - will be compiled into a findings summary and final report.
B.7 Proposed Schedule for Completion
Project work described in this plan will be completed according to the following schedule:
References
Abdel-Rahim, A., S. G. Berrio-Gonzales, et al. (2006a). Classification of Longer Combination Vehicles Using Weigh-in-Motion Data. Final Report Part A. University of Idaho. , National Institute for Advanced Transportation Technology.
Abdel-Rahim, A., S. G. Berrio-Gonzales, et al. (2006b). Longer Combinations Vehicles: A Comparative Crash Rate Analysis. Final Report Part B. University of Idaho. , National Institute for Advanced Transportation Technology.
AASHTO (2010). Highway Safety Manual, AASHTO, Washington, D.C.
Bonneson, J.A. and M.P. Pratt (2008), Procedure for Developing Accident Modification Factors from Cross-Sectional Data. Transportation Research Record: Journal of the Transportation Research Board, No. 2083, Transportation Research Board of the National Academies, Washington, DC.
Hauer, E., "On exposure and accident rate," "Traffic engineering and control", 36(3) (1995): 134-138
Jovanis, P.P., H. Chang and I. Zabaneh. "Comparison of Accident Rates for Two Truck Configurations," Transportation Research Record, 1249, Washington, D.C., pp. 18-29, 1990.
Project Name: Comprehensive Truck Size and Weight Limits Study
____________________________
Authorized Agent
UNC HSRC
____________________________
Authorized Agent
Carrier
________________
Date
previous | next