Comprehensive Truck Size and Weight Limits Study - Highway Safety and Truck Crash Comparative Analysis Technical Report
Chapter 4: Inspection And Violation Analysis
4.1 Overview
The goal of this analysis is to understand the implications of increased size and weight on motor carrier inspection violations, out-of-service violations, and citations. A violation can be discovered during the inspection, and some violations may place the vehicle out-of-service (OOS) or be issued a citation. MAP-21 Section 32801 requires a comparative analysis to be conducted to examine “vehicles that operate with size and weight limits in excess of the Federal law regulations, or that operate under a Federal exemption or grandfathered right, in comparison to vehicles that do not operate in excess of Federal laws and regulations (other than vehicles with exemptions or grandfathered rights).” For more information on the findings of that analysis, please see Volume II: Compliance Comparative Analysis.
The purpose of the study team’s review of safety inspections and violations was to identify the potential impact of increased gross combined vehicle weight (GCVW)[6] on the overall level of violations-related actions as a result of inspections. Level 1 inspection, an inspection of driver and vehicle, data extracted from the 2008 to 2012 MCMIS Inspection Data were used for the analysis.
The analysis included 14 States with heavy semitrailer configurations (Alaska, Idaho, Kentucky, Maine, Michigan, Nevada, New Hampshire, New York, North Dakota, Oregon, Utah, Vermont, Washington and Wyoming) and 10 States with triple-trailer configurations (Colorado, Idaho, Kansas, Montana, Nevada, North Dakota, Oklahoma, Oregon, South Dakota and Utah). Ohio was not included in either analysis as the unit data did not match the inspection data extracted from MCMIS. Ten States allowing the operation of triple-trailer configurations were explored to assess the violation-related issues with this configuration. Unfortunately, the search of the 10 State inspection files over 5 years yielded only 73 Level 1 inspections, making the sample size insufficient for any additional statistical modeling. Selective tables are presented summarizing these data.
The analysis of tractor semitrailers in Scenarios 1, 2, and 3 was based on specific tractor semitrailer configurations that were legally operated (that is, there were no overweight violations). Analyses comparing triple trailers with twin-trailer configurations included all triple-trailer configurations over 80,000 lbs. and legally operated tractor twin-trailer configurations at 80,000 lbs. There were limited data available for triple-trailer configurations in MCMIS; thus the distinction between overweight and not overweight was not made for this configuration.
The vehicle was identified as overweight if it had received an overweight violation during the inspection. That is, a Commercial Motor Vehicle (CMV) with any type of overweight violation (e.g. exceeding axle weight limits) was regarded as illegally operated.
4.2 Objectives
The objective of this portion of the study is to identify any relationships between the patterns of violation, out-of-service actions and citations, and truck configuration, especially configurations operating legally. Due to limitations in MCMIS data (no information on number of axles or length of units), truck configurations had to be separated based on their unit type (i.e. tractor) and GVW. Using this method, a tractor semitrailer weighing 88,000 lbs. can be considered a legally operated 88,000-lb. tractor semitrailer, but it can also be an illegally operated 80,000-lb. tractor semitrailer. Hence, we cannot distinguish a legally operated tractor semitrailer weighing 88,000 lbs. from an illegally operated overweight 80,000-lb. semitrailer. Thus, “legally operated” CMVs were selected to eliminate trucks with overweight violations (i.e., illegal) from our analyses. This study objective ties directly to basic inspection data collected by FMCSA and part of their MCMIS database and seeks the answers to 4 questions:
- How does the pattern of inspections differ across the baseline and candidate vehicle configurations?
- How do violations differ with configuration?
- How do out-of-service outcomes differ with configuration?
- How do citations differ with configuration?
4.3 Methodology
The USDOT study team used a series of tables and statistical models to explore the nature of the relationships regarding truck configurations and roadside safety inspection data. Exploratory cross tabulations show initial trends and patterns. Logit models are then developed to predict the likelihood of a discrete outcome as a function of predictor variables. The outcomes are, in this case, “yes” or “no” categories that help provide answers to bullet items 2-4 above bullet 1 is answered through the use of cross-tabulations.
4.4 Data Used in Inspection and Violations Analysis
MCMIS Inspection File Data
For the years 2008 to 2012, the number of inspections, violations, and citations by truck configuration and year is shown in Table 30. The number of inspections includes all Level 1 data available in MCMIS for the 5 years. (See Appendix G for a description of the three levels of inspections to which a driver or vehicle may be subjected.) The violations include all safety violations as well as out-of-service and some moving violations as well. The citations shown do not include overweight violations, except as noted in selected tables.
The truck configurations examined in this study were limited to those available within the MCMIS inspection file. Each inspection included information about the type and number of vehicle units as well as the gross vehicle weight. Note that the gross combined vehicle weight (GROSS_COMB_VEH_WT) field is filled in by the field inspector and may include the gross vehicle manufacturers’ weight rating, the weight of the load per the bill-of-lading, or an actual measured weight if the truck was weighed at time of inspection. For the period 2008 to 2012, 82 percent of the data in MCMIS includes data in this field.
K = 1,000 lbs.
OOS = out of service
In order to include configuration inspections around the target weights used in this study (e.g., 88,000 lbs.) it was reasonable to allow a weight tolerance around the target value. For tractor semitrailers, inspections were included with a variation around a specific target weight of +/- 1,000 lbs.; for twin trailer/triple-trailer configurations, the tolerance is +/- 6 percent of the target weight. This only affects the inspections included in the study; most analyses use a rate per inspection as a dependent variable.
Tractor semitrailers were identified by their configuration of one tractor and one semitrailer. There were five possible tractor semitrailer combinations with number of axles ranging from 3 to 6 and gross weight limits equal to 60,000 lbs. or 80,000 lbs. per the Bridge Formula (see Figure 17). The Bridge Formula is used to calculate the allowable weight of a truck. It is based on the weight-to-length ratio of a vehicle crossing a bridge (FHWA-HOP-06-105). It should be noted that the Bridge Formula could not be used for individual trucks because MCMIS does not include axle count data, a required variable for the Bridge Formula. Hence, it is not possible to distinguish between the first three configurations shown in Figure 17 as they all operate legally at 80,000 lbs. or less. The weight limit also varies for States that allow tractor semitrailers over 80,000 lbs., and therefore additional tractor semitrailer configurations that exceed 80,000 lbs. are possible. However the focus of this analysis is on the potential safety impacts of vehicles with increased sizes and weights; therefore, it is reasonable to compare tractor semitrailers at or below 80,000 lbs. with those with a higher GVW (i.e., 88,000 lbs., 91,000 lbs., and 97,000 lbs.). Furthermore, only CMVs listed as “legally operated” were selected in order to separate the effect on safety performance of overweight trucks from the effect of increased GVW.
It was also difficult to distinguish tractor twin-trailers with a GVW of 80,000 lbs. (control single) from other twin-trailer configurations such as Turnpike Doubles and Rocky Mountain Doubles. One alternative was to examine States that only allow triple-trailer configurations and no other types of long combination vehicles. However, none of the 10 States that allowed triple-trailer configurations identified for this project met this condition. As a result, there are likely some Turnpike Doubles and Rocky Mountain Doubles among the “twin trailers” in this study. This is noted as a limitation in this research, since triple-trailer configuration violations could not be compared due to limited sample size.
| Tractor Semitrailer Configurations | No. Axles | Interstate Weight Limit |
|---|---|---|
| 3 | 60,000 lbs | |
| 4 | 80,000 lbs | |
| 5 | 80,000 lbsa | |
| 6 | 80,000 lbsa |
a Weight limit is computed from the Bridge Formula
Vehicles Miles Traveled Data
The estimated VMT on Interstates for the year 2011 for the 10 States that allow triple-trailer configurations was available at the time of this report (Table 31). This table is calculated from an original table of VMT estimates by State, functional class, and the 28 vehicle classes prepared for the overall study. There are three States that have considerably more VMT for twin-trailer configurations with 5 or 6 axles (3-S2 and 3-S3) as compared to 7, 8, and 9+ axles (2-S1-2-2 or DS7, 3-S3-2 or DS8, and 3-S3-3 or DS9+); these States are Colorado, Kansas, and Oklahoma. There are very few VMT estimates of triple-trailer configurations (including both 2-S1-2-2 or TS7 and 3-S1-2-2 or TS8) for Kansas and Oklahoma, and only four commercial vehicles types were identified as triple-trailer configurations for these three States using MCMIS inspection data. These low levels of VMT for triple-trailer configurations contributed to the low level of inspections for this configuration, ultimately resulting in triple-trailer configurations being dropped from this portion of the study.
Note: DS5/6/7/8/9+ denote double-trailer configurations with five/six/seven/eight/and nine or more axles; TS7/8 denote triple-trailer configurations with seven/eight axles. These categories include the 2-S1-2 double configuration and 2-S1-2-2 and 3-S2-2-2 configurations assessed in the Study.
Oak Ridge National Laboratory Data
The ORNL data was also provided to the team from FMCSA. This data is based on a study on overweight commercial vehicles and their impact on safety on the Nation’s highways. The data has a similar format to that of the MCMIS inspection files, with two fields added to capture the measured gross vehicle weight and indicate whether the vehicle has a special weight permit. ORNL data was considered a supplement to MCMIS inspection data as it has more accurate gross vehicle weights (the MCMIS data is based on the reports of the field inspectors and may not be based on the actual weight at the time of the inspection). However, the data were not used for the following reasons:
- ORNL data was collected for the years 2012 to 2014 on nationwide basis. The study period for the analysis is from 2008 to 2012 and only focused on the 19 States that allowed heavy semitrailers and/or triple-trailer configurations. This timeframe also allowed comparison with the crash analyses.
- There were 913 inspections matches between the ORNL and MCMIS data files, and 213 of those inspections included meaningful values in the ORNL-added field of gross vehicle weight. Among these 213 inspections, 143 were for tractor semitrailers and none were for twin or triple-trailer combinations.
- Gross vehicle weight recorded in the ORNL file was only for overweight vehicles. As mentioned earlier, the inspection and violations analyses was largely comprised of legally operated CMVs. Therefore, this additional accuracy in GVW provided by the ORNL file did not provide additional insights to the model.
4.5 Data Analysis
Analysis was conducted to examine the number and rate of violations, out-of-service violations, and whether the carrier was issued a citation in addition to the violation. Safety violations are noted on the vehicle inspection form and must be fixed prior to next re-dispatch of the vehicle. OOS violations are such that operation of the vehicle cannot continue until all OOS violations are immediately remedied, whereas axle or gross weight violations are State-recorded violations that are addressed according to each individual State’s operating procedures; in some cases a citation is issued, and in others the vehicles load might have to be re-balanced or a portion of the load removed before the continuation of the current trip can be resumed.
The statistical analysis is separated into two parts: descriptive and inferential. The descriptive statistics provide summary data for the truck configurations at or below 80,000 lbs. and greater than 80,000 lbs., as reported by the inspector under GVW in the inspection file (in the GROSS_COMB_VEH_WT field) for each analysis conducted. The data are compiled for all 19 States allowing heavy semitrailers or triple trailers that were identified earlier. The data are summarized by violations, out-of-service violations, and whether the carrier was issued a citation in addition to the violation. The inferential statistics are based on regression-based models.
Each analysis was conducted using the statistical software package R, version 3.0.3 (R Core Team, 2012).
Inspected Commercial Vehicles within the Data Set
Based on a Level 1 inspection, very few inspected trucks were reported with an overweight violation (see Table 32). As expected, the chi-squared test showed that significant differences in the proportion of vehicles that were overweight that operated at or less than 80,000 lbs. when compared to those that operated at greater than 80,000 lb. Hence, the forthcoming analysis is separated into two groups.
Table 32 is based on information from MCMIS and shows the number of trucks inspected in the field for the 19 States in the analyses. That is, this table includes commercial vehicles with at least one unit as full trailer, pole trailer, semitrailer, straight truck, truck tractor, van, or intermodal chassis, and does not include the specific truck configurations (e.g., tractor semitrailers weighing 80,000 lb).
Violations Analysis
This section compares average violation counts per inspection for different weight and size configurations. Note that vehicles with any overweight violations in the inspection were excluded from this analysis.
Summary Statistics
A total of 717,300 inspection records were available for the selected 19 States for all trucks in the years 2008 to 2012. Of these, 109,610 inspections are associated with vehicles operating at greater than 80,000 lbs. There are 2,163,666 violations recorded for inspections of all vehicles; 2,151,495 are associated with violations that are not overweight. The average number of violations per inspection for vehicles above and below the 80,000 lb. threshold was compared. There were 2.8 to 3.5 violations per inspection for those vehicles that were not overweight and 6.25 to 7.64 violations per inspection for those vehicles that operate at 80,000 lbs. and above (see Table 33). This trend is also present when we examine the data by truck configuration, where twin trailers had more violations per inspection compared to the other truck configurations (see Table 34).
| GCVWa | Overweight Violation Noted in MCMIS | All | Driver | Vehicle | Hazardous Material |
|---|---|---|---|---|---|
| ≤ 80K lb | No | 2.80 (3.4) | 0.46 (0.9) | 2.24 (2.9) | 0.031 (0.28) |
| Yes | 6.25 (5.0) | 1.91 (1.4) | 4.18 (4.4) | 0.034 (0.30) | |
| > 80K lb | No | 3.48 (3.9) | 0.35 (0.8) | 3.05 (3.5) | 0.022 (0.20) |
| Yes | 7.64 (5.9) | 1.91 (1.5) | 5.57 (5.2) | 0.010 (0.13) |
K= 1,000 lbs.
a Gross combined vehicle weight as reported by the field inspection personnel.
| Gross Combined Vehicle Weight (GCVW)a | All | Semitrailer | Twin-Trailer | Triple-Trailerb |
|---|---|---|---|---|
| ≤ 80K lbs | 2.80 (3.4) | 3.10 (3.6) | 4.62 (5.7) | 2.48 (3.6) |
| > 80K lbs | 3.48 (3.9) | 3.42 (3.9) | 4.94 (5.3) | 2.83 (4.3) |
K= 1,000 lbs.
a Gross combined vehicle weight as reported by the field inspection personnel.
b As discussed in the body of the report, the number of inspections for triple trailers is very small.
A further breakdown of each semitrailer configuration by weight and average violations per inspection is provided in Table 35 for the truck configurations in Scenarios 1, 2, and 3 in the study. The mean number of violations per inspection for the tractor-semitrailers with recorded GVW greater than 80,000 lbs. was higher than the control, especially for the 97,000-lb. configuration. However, the large standard deviations suggest that a significant difference in violations per configuration may not be observed. Triple trailers weighing 105,000 lbs. and 129,000 lbs. have seven and four inspection records respectively, and therefore were not included in this table.
K = 1,000 lbs.
Summary data (contained in Appendix F) were also extracted for the top 15 violation categories for each truck configuration, where similar patterns exist with the same types of violations continually appearing on the list. That is, all truck configurations had violations for braking, lighting, tires, emergency equipment, and windshield. Additionally, all semitrailers and twin-trailers had suspension-related violations.
Likelihood of a Violation
A binary logit model was developed to predict the likelihood of a violation given that an inspection had occurred. Table 36 summarizes the explanatory variables considered in the models. Driver and vehicle age were included as previous studies suggest an association with truck violations.
| Variable | Level | Definition |
|---|---|---|
| Driver Age | Driver | (Date of inspection) - (Date of Birth) |
| Vehicle Age | Vehicle | (Year of Inspection) - (Model Year of Unit)* |
| Out of Service (OOS) Rate | Carrier | (Tot # Driver Vio) + (Tot # Veh Viol) + (Tot # Haz Mat Viol) (Total # of Inspections) |
* For CMVs with multiple units, the oldest one was chosen.
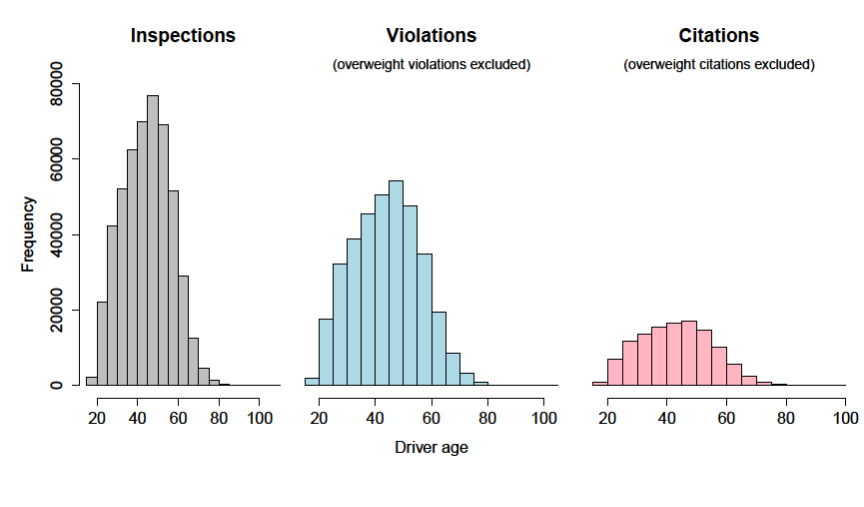
Vehicle age has been associated with crash injuries (Blows et al, 2003) and driver age has been associated with crash risk, types of driving errors, and violations (Harrington and McBride, 1970; Westerman and Haigney, 2000). Driver age is typically correlated with experience level, and several studies have already shown the impact of age on crash risk (e.g., Campbell, 1991). A distribution of driver age for those that encountered an inspection, violation, and citation is shown in Figure 18. As noted, the age is fairly normally distributed, so this variable was included as a continuous rather than categorical variable.
Vehicle age was also included as an explanatory variable since older vehicles are more susceptible to inspections and violations (Cantor, et al., 2010). Factors such as safety performance, economic status, and the motor carrier’s management policies can affect the safety performance of its drivers (Mejza, et al., 2003). Due to the limitation of motor carrier information in MCMIS data file, only carrier-wide out-of-service rates were included to predict the likelihood of a truck violation.
Table 37 shows the results for the logistic regression analysis for tractor semitrailers, where the 80,000-lb. configuration was used as the base (e.g., included in the intercept). This first model shows how the explanatory variables relate to whether a tractor semitrailer is more likely to receive a violation. Correlations between each of the two explanatory variables are all lower than 0.15.
K = 1,000 lbs.
Note: Configuration base is 80,000 lbs.
This model suggests that vehicle weights (88,000 lbs., 91,000 lbs., and 97,000 lbs.) are not particularly good predictors of safety-related violations when vehicle age, driver age, and carrier OOS rates are accounted for in the model. Older drivers (perhaps due to experience) have a reduced likelihood of receiving a violation, whereas using older equipment increases the likelihood of a violation as older vehicles may require more general maintenance as compared to new vehicles. However, a carrier with a high OOS rate is (intuitively) a good predictor that vehicle safety violations will be identified by roadside inspectors conducting inspections. These findings have direct implications for the use of heavier combination vehicles. If carriers that enter the market using the heavier 3-S3 vehicles also have higher OOS and older equipment, this model suggests they may have higher violation rates as well.
For the data compiled for all 19 States, 7 inspection records were identified for triple-trailer combinations weighing 105,000 lbs., and 4 for triple-trailer combinations weighing 129,000 lbs. This small sample size may introduce non-coverage bias and incorrect estimates of errors. A logit model for triple-trailer configurations cannot, therefore, be estimated.
Figure 18: Distribution of Driver Age for the 19 States in the Analyses (2008–2012).
4.6 Out-of-service Violations Analysis
Summary Statistics
The study team considered OOS violations at the vehicle level. Vehicles inspected with overweight violations, as noted on roadside inspection reports, had OOS rates more than two times higher than vehicles with no overweight violations; vehicles over 80,000 lbs. also had more OOS violations (Table 38). The twin-trailer configurations had the highest proportion of OOS violations per inspection (with an average of one or more OOS violations per inspection in each GVW grouping) and triple-trailers had the lowest with an average of 0.5 OOS violations per inspection in each GVW grouping (Table 39).
| GCVWa | Overweight Violation Noted in MCMIS | All | Driver | Vehicle | Hazardous Material |
|---|---|---|---|---|---|
| ≤ 80K lbs. | No | 0.58 (1.2) | 0.08 (0.3) | 0.46 (1.1) | 0.011 (0.14) |
| Yes | 1.35 (1.9) | 0.12 (0.4) | 1.12 (1.7) | 0.015 (0.17) | |
| > 80K lbs. | No | 0.67 (1.3) | 0.05 (0.3) | 0.56 (1.2) | 0.004 (0.07) |
| Yes | 1.57 (2.2) | 0.07 (0.3) | 1.38 (2.1) | 0.001 (0.03) |
K = 1,000 lbs.
a Gross combined vehicle weight as reported by the field inspection personnel.
| GCVWa | All | Semitrailer | Twin-trailer | Triple-trailer |
|---|---|---|---|---|
| ≤ 80K lbs. | 0.58 (1.2) | 0.64 (1.3) | 1.01 (2.2) | 0.54 (2.0) |
| > 80K lbs. | 0.67 (1.3) | 0.65 (1.3) | 1.10 (1.9) | 0.57 (2.0) |
K = 1,000 lbs.
a Gross combined vehicle weight as reported by the field inspection personnel.
These violation counts are further broken down by vehicle weight (including double-trailer configurations) in Table 40 and as noted, twin trailers have the highest OOS violation count. Similarly, triple trailers weighing 105,000 lbs. and 129,000 lbs. were not included because of the very limited sample size.
K= 1,000 lbs.
Likelihood of an OOS Violation
A binary logit model was developed to analyze the likelihood of an OOS violation occurring during an inspection for GVW violations. The same explanatory variables were used as in prior models. Driver age, vehicle age, and carrier OOS rate were analyzed to determine relative significance as a factor in the prediction of an OOS violation occurring during a roadside inspection. The data analysis, in Table 41, shows that there was an increase in violations from the 80,000-lb. control vehicle to the 88,000-lb. configuration, but there was an inability to show a difference in the other two weight categories.
K = 1,000 lbs.
Note: Configuration base is 80,000 lbs.
Citations Analysis
This section analyzes the citations received during inspection. Citations are the most severe form of a violation. As with the previous analyses, inspections that resulted in an overweight violation were excluded. There are 149,977 citation records included in this analysis.
Summary Statistics
The USDOT study team compared the mean number of citations per inspection for vehicles at the 80,000 lb. threshold between overweight and not overweight vehicles and among the triple-trailer configurations. All vehicles with overweight violations have more citations regardless of whether they are heavier than 80,000 lbs. or not (see Table 42). A similar summary based on truck configuration is provided in Table 43 and shows that tractor twin-trailers have more citations per inspection.
| GCVWa | Overweight Violation Noted in MCMIS | All | Driver | Vehicle | Hazardous Material |
|---|---|---|---|---|---|
| ≤ 80K lb | No | 0.42 (1.2) | 0.14 (0.5) | 0.98 (0.3) | 0.004 (0.09) |
| Yes | 1.61 (2.1) | 0.91 (0.9) | 1.50 (0.6) | 0.009 (0.14) | |
| > 80K lb | No | 0.35 (1.2) | 0.07 (0.3) | 1.05 (0.2) | 0.002 (0.05) |
| Yes | 1.84 (3.3) | 0.83 (0.9) | 2.84 (0.9) | 0.002 (0.04) |
K = 1,000 lbs.
a Gross combined vehicle weight as reported by the field inspection personnel.
| GCVWa | All | Semitrailer | Twin-Trailer | Triple-Trailerb |
|---|---|---|---|---|
| ≤ 80K lb | 0.42 (1.2) | 0.41 (1.2) | 0.53 (1.4) | 0.12 (0.6) |
| > 80K lb | 0.35 (1.3) | 0.34 (1.1) | 0.66 (2.2) | 0.11 (0.7) |
K = 1,000 lbs.
a Gross combined vehicle weight as reported by the field inspection personnel.
b Triple-trailers based on small sample size.
A further breakdown of each configuration by weight and average citations per inspection is provided in Table 44. Similarly, triple trailers weighing 105,000 lbs. and 129,000 lbs. were not included because of the limited sample size.
K = 1,000 lbs.
Likelihood of a Citation
A binary logit model was developed to examine the likelihood of a citation occurring given a Level 1 inspection. Table 45 shows the findings for the logit model for tractor semitrailers, where once again the 80,000 lb. configuration was used as the base (e.g. included in the intercept).
K = 1,000 lbs.
Note: Configuration base is 80,000 lbs.4.7 Summary
Using data obtained from MCMIS and the study team, a series of analyses were conducted to explore the relationship between vehicle configurations and violations. Separate analyses compared an 80,000-lb. five-axle combination to an 88,000-lb. six-axle configuration, a 91,000-lb. six-axle configuration, and a 97,000 lb. six-axle configuration. A comparison of the 80,000-lb. twins with heavier triple-trailer configurations was also explored, but the small sample size (less than 10) limited the opportunities for an inferential analysis.
Commercial motor vehicles heavier than 80,000 lbs. appear to have more overweight violations. Vehicles with overweight violations also have more types of other, additional violations compared to vehicles that do not have overweight violation. This observation is also applicable for commercial vehicles operating both at or below 80,000 lbs. as well as at greater than 80,000 lbs. As for vehicles without overweight violations (referred to as “legally operated” in this section), those weighing more than 80,000 lbs. have higher violation rates in general and also have higher OOS violation rates, which are primarily due to vehicle-related violations.
The study team only conducted analyses by truck configuration for “legally operated” vehicles. This was because vehicles are identified with the reported GVW noted by field inspectors. Illegally operated vehicles (those with overweight violations) were therefore dropped to distinguish the effect of violations among overweight trucks as compared to those among trucks with increased GVW. Notably, although the sample size for triple-trailer combinations was fairly small, the summary statistics does suggest that these configurations have lower violations and OOS violation rates as compared with twin-trailer combinations.
Tractor semitrailers that weigh greater than 80,000 lbs. experienced more overall violations per inspection. Among tractor semitrailers, twin trailers, and triple trailers, twin trailers have the highest violation rates. Vehicles weighing more than 80,000 lbs. have higher OOS and non-OOS violation rates for all three combination types. Not all truck configurations with higher GVWR had higher OOS violation rates. That said, when truck configuration was included in the regression models (with other factors accounted for), this variable was not a significant predictor of the likelihood of a violation, not even an OOS violation.
The strongest predictors of the likelihood of an OOS or non-OOS violation were associated with driver age, vehicle age and company OOS record. An increase of 10 years in driver age will lead to a 9 percent decrease in the likelihood of an OOS violation and an 11 percent decrease in the likelihood of a non-OOS violation. Every increase of 5 years in vehicle age increases the likelihood of a non-OOS violation or an OOS violation by 1.39 and 1.34 times, respectively. A one-unit increase in the carrier OOS rate will result in an increase of 11.10 and 13.23 for non-OOS violations and OOS violations, respectively.
As mentioned previously, carrier OOS rate is intuitively a good predictor as carriers with higher OOS rate are more likely to be involved in roadside inspections and are therefore more likely to receive violations. The analyses are limited to the data available in the MCMIS inspection file, which we recognize is subject to the subjective recordings of the roadside inspector. These inspectors may also have their own biases with respect to the CMVs and motor carriers that they perceive as being likely candidates for a violation. However, it should be noted that, even under these circumstances, there are no significant differences in tractor semitrailers weighing 88,000 lbs., 91,000 lbs., and 97,000 lbs. when compared to semitrailers weighing 80,000 lbs. with respect to violations. This indicates that these alternative tractor semitrailer configurations do not appear to be worse than the reference semitrailer group in the current analyses.
As for the top violation categories by truck configuration (see Appendix F), brake violations (including “Brakes, all other violations” and “Brakes, out of adjustment”) always account for the highest proportion of all violations. Compared with vehicles operated at or below 80,000 lbs, vehicles operating at greater than 80,000 lbs. show a higher percentage (18 percent) of brake violations and a higher number (0.76) of brake violations per inspection. For the four tractor semitrailer configuration groups, “Brakes, all other violations” all account for about 35 percent of all violations, whereas the percentage of “Brakes, out of adjustment” for semitrailers greater than 80,000 lbs. is typically 2 points higher. As for triple trailers, brake violations are 4 percentage points higher than they are for twin trailers, although triple configurations receive one less brake violation per inspection as compared to twin trailers.
[6] The term gross combined vehicle weight (GCVW) is used here so that it is consistent with the description used in MCMIS, which is the primary data source used in this section and described in Section 4.4. Return to Footnote 6