Traffic Analysis Tools Volume IX: Work Zone Modeling and Simulation
A Guide for Analysts
Utah DOT I-15 Reconstruction Design-Build Evaluation
Utah Department of Transportation & University of Utah
Evaluation of the I-15 Reconstruction Design-Build [11]
| Work Zone Characteristics | |
|---|---|
| Transportation Analysis: | |
| Approach | Travel Demand Model |
| Modeling Tools | VISUM TP+ |
| Work Zones: | |
| Type | Type I |
| Network Configuration | Network |
| Geographic Scale: | |
| Work Zone Size | Large |
| Analysis Area | Metropolitan |
Overview
In 1996, the Utah Department of Transportation began reconstructing a 17-mile segment of I-15 in Salt Lake City, Utah in preparation for the 2002 Winter Olympic Games. The reconstruction of I-15 was the culmination of nearly ten years worth of planning and analysis that resulted in the decision to widen I-15, construct HOV lanes and install a new a light rail system serving downtown Salt Lake City. In deciding to reconstruct I-15, the Utah Department of Transportation (UDOT) ultimately made the decision to move forward with a Design-Build construction method for two reasons: 1) the public strongly supported timely I-15 completion so as to minimize traffic congestion on alternate routes; and 2) Design-Build would complete reconstruction before the 2002 Winter Olympic Games began in Salt Lake City.
The decision to move forward with a Design-Build methodology for I-15 in Utah was the first of its kind for the state. Thus, a number of state procurement laws had to be changed in order to make it possible. In addition, UDOT had to restructure the manner in which they oversaw construction projects of this size and impact. Overall, the decision to use Design-Build was a leap-of-faith for UDOT with the understanding that the overall project would be constructed more quickly, include lower costs and not as greatly impact the traveling public.
Because the I-15 reconstruction was the first use of Design-Build for UDOT, an ex ante evaluation of the project was conducted by the Utah Traffic Lab at the University of Utah. The evaluation consisted of modeling three construction scenarios:
- Design-Build (aka Fast Track) — Innovative construction technique whereby time savings are gained as design and construction occur simultaneously. Cost savings occur from shorter construction duration and lower user delay and costs.
- Traditional-Build — More common design and construction method that typically includes lower capital costs but protracted construction duration and congestion.
- No-Build (aka Do Nothing) — Planned transportation improvements in the region would be implemented. Structural and pavement deficiencies on I-15 would be corrected.
The Utah Traffic Lab used the VISUM travel demand model to evaluate the three construction scenarios. Evaluations were based upon three criteria: user delay, I-15 corridor travel times and network congestion. In addition, an accident analysis was conducted to see the impact of the construction methods on safety. In the end, the evaluation of the reconstruction of I-15 in Salt Lake City led to the development of a construction impact modeling methodology (Figure1 below) that local jurisdictions can employ to justify the use of the Design-Build contracting. The methodology has been applied to five projects within Utah’s Statewide Transportation Improvement Program with the recommendation that all five use Design-Build.
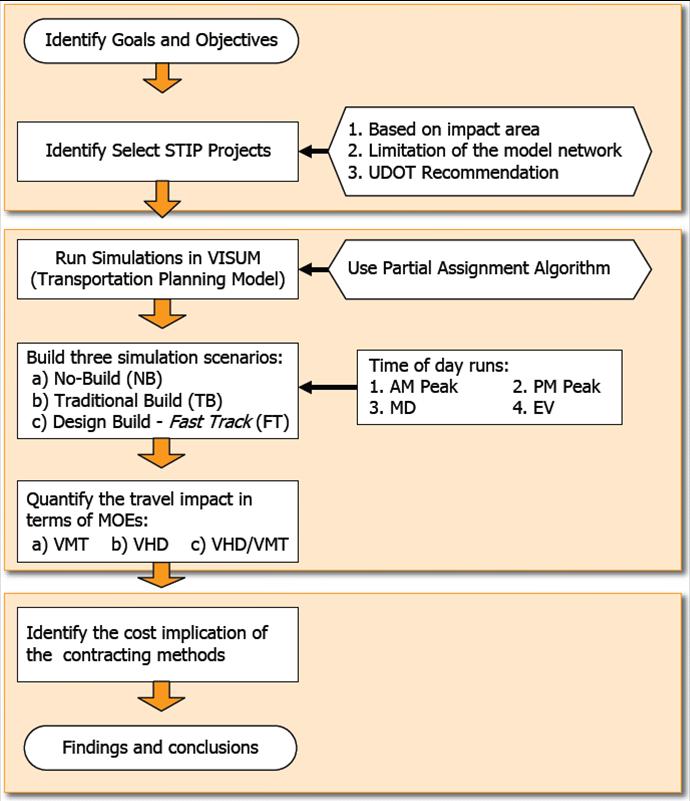
Figure 22 Construction Impact Modeling Methodology
Overall, the evaluation of the Design-Build construction scenario estimated a savings of 60 million hours of user-delay over the Traditional-Build scenario representing approximately $600 million (2002 dollars) in savings to travelers (value of time = $10 per hour). In addition, the accident analysis estimated a reduction in vehicles crashes, injuries and fatalities of 287, 100 and 1 respectively. This is an estimated savings of $120 million (2002 dollars).
Model Selection
The study area for the evaluation comprised the entire Salt Lake Valley (Figure 23 below), about 500 square miles. The study area includes four major types of roadways: freeways, principal and minor arterials and collector roads (local and residential streets were excluded). Freeways include I-15, I-80 and I-215. In all, the area to be modeled included more than 5,000 roadway links.
In order to model such a large geographic area, the Utah Traffic Lab considered various transportation modeling software tools which included travel demand models (TransCAD, TP+, EMME/2, VISUM), mesoscopic simulation models (Integration) and microscopic simulation models (Paramics). Model selection was made based upon the following criteria:
- Quality of traffic assignment functionality
- Size of the network - number of nodes and links that can be handled
- Available traffic assignment routines
- Potential to export inputs/outputs to a microscopic simulation software package
- Number and variety of performance measures produced
- Price of the software (discounts, academic versions, technical support)
- User interface
- Peer reviews on the weaknesses and advantages of the software
VISUM was selected because it satisfied the given criteria. VISUM data is efficient as it can be directly exported to the VISSIM traffic simulation package giving the analyst an opportunity to use compatible microscopic simulation models for operational analyses. Practically speaking, Utah Traffic Lab owned a version of VISUM and the VISSIM model, keeping costs down. Also, the Wasatch Front Regional Council (the local metropolitan planning organization) modeled the region using the TP+ travel demand model which can be easily imported into VISUM. The VISUM Salt Lake Valley network is shown below in Figure 24.
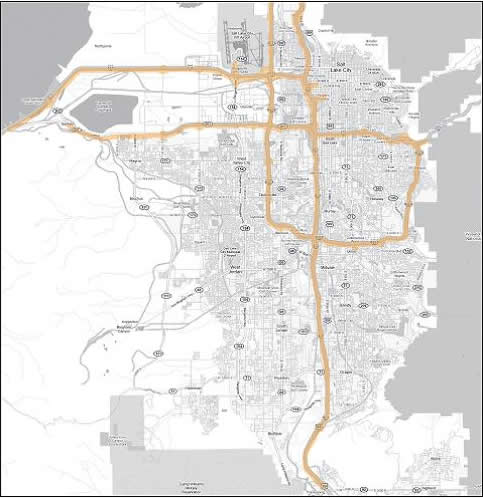
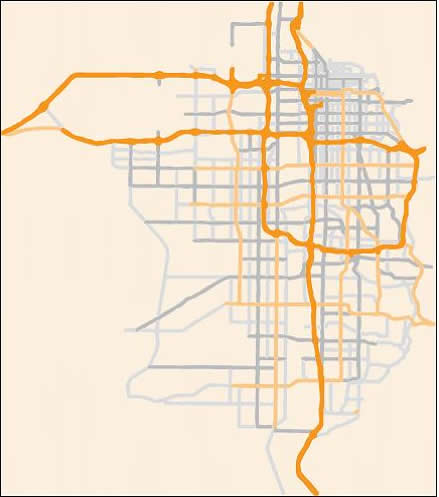
Figure 23 Salt Lake Valley Area Figure 24 VISUM Salt Lake Valley Network
Measures of Effectiveness
User Delay
User Delay was measured in terms of annual user delay and cumulative user delay. The values were calculated from VISUM output of Vehicle Hours of Delay (VHD) which is standard model output and is a region-wide measure of traffic in the system. VHD represents the difference between vehicle-hours on a link when it is congested and in free-flow conditions. Results (shown in Figure 25) indicate that the Design-Build scenario produces less user delay during the study period than both the Traditional-Build and No-Build.
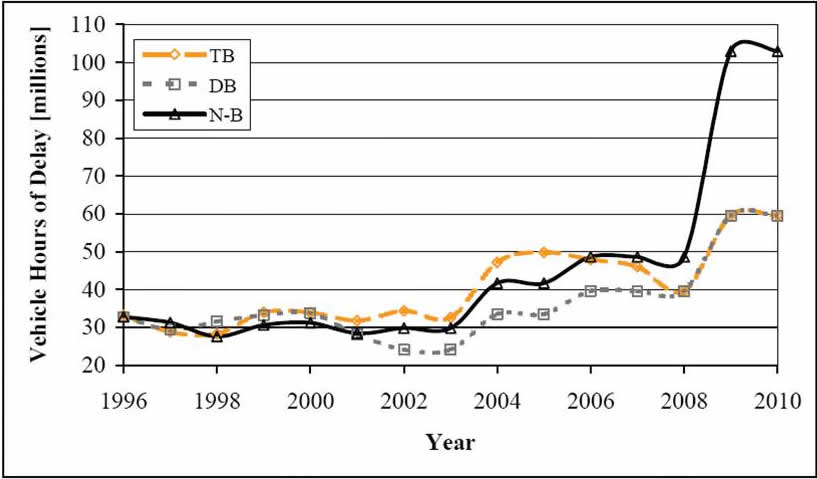
Figure 25 User Delay
Travel Time
Travel Time was measured only on certain sections of I-15 using the route-search option in the VISUM software. This measure was used to evaluate the impact of different traffic loads during and after the I-15 reconstruction periods. Figure 26 shows that travel time are generally less for the Design-Build over the Traditional-Build and significantly less than the No-Build.
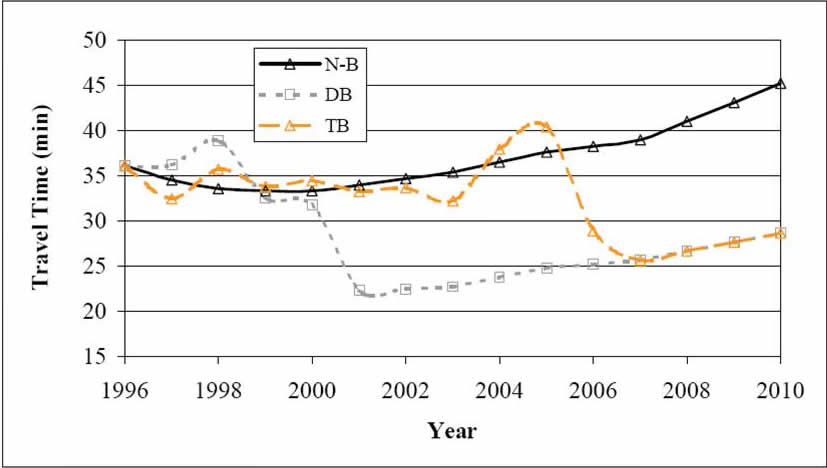
Figure 26 Travel Time
Congestion
Congestion was measured in terms of volume-to-capacity ratios where saturation occurs with a value greater than 0.9 (1.0 represents volume equal to capacity). Conducting this part of the analysis was done off-line from VISUM using Microsoft Excel. Results are shown in Figure 27 and are difficult to interpret. Suffice it to say, the Design-Build produces more congestion early-on but less overall compared to both the Traditional-Build and No-Build.
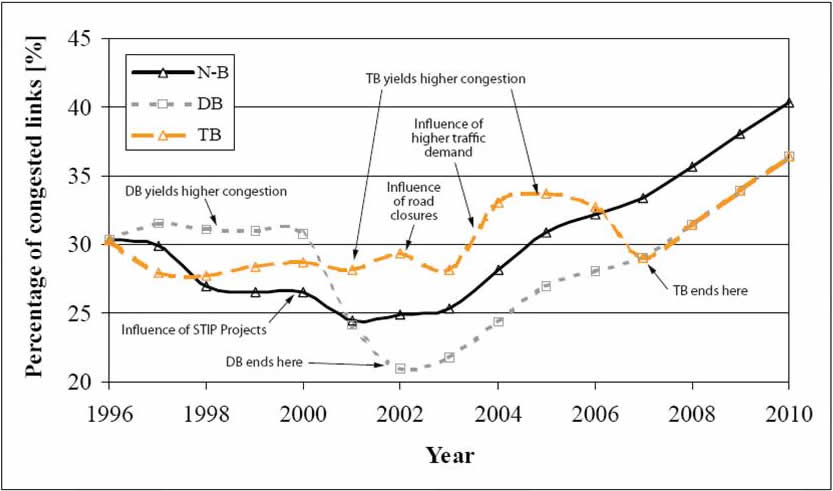
Figure 27 Congestion
Crash Analysis
An important component to the evaluation of the Design-Build scenario was the impact on accidents. In order to conduct a comparison among the three alternatives, a regression model was constructed which included a traveler exposure component represented by the vehicle-miles traveled (VMT) output from the VISUM model. Other regression components included work zone length, number of interchanges opened and congestion on the network. The regression model was calibrated to actual condition between 1996 and 2001 in order to predict accidents and accident rates for the three construction scenarios.
Results were expressed in terms of crash rate and total number of crashes. Figure 28 shows the calculated accident rates for the three construction alternatives for both highways and surface streets. Overall, the Design-Build scenario has a lower rate for the duration of the study period even though it is greater during certain periods. The total number of crashes during the study period is smallest for Design-Build (65.3 thousand) compared to both Traditional-Build (69.7 thousand) and No-Build (66.2 thousand).
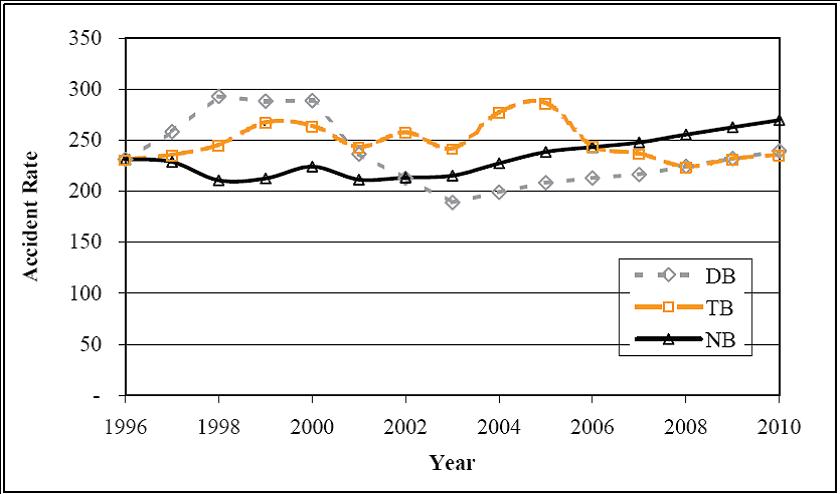
Figure 28 Crash Rates
[11] This case study was adapted from the reports Evaluating Design-Build vs. Traditional Contracting Methods for STIP Projects: An Assessment of Travel Impact & Delay Cost (July 2004) and I-15 Reconstruction In Ogden, Utah: Evaluation of Various Traffic Maintenance Plans (July 2005) prepared by Dr. Peter Martin at the University of Utah.
Table of Contents | Previous | Next