4.0 DATA SOURCES AND COMPUTATIONAL METHODS FOR SAFETY-RELATED PERFORMANCE MEASURES
The safety effects of work zones have long been a major concern of both transportation agencies and highway contractors. However, the monitoring and systematic improvement of work zone safety remains a challenge. Work zones are highly variable, the combined result of decisions regarding specific work zone design elements to use, traffic handling strategies to employ, scheduling choices, signing, special traffic management strategies, and other aspects. Work zones also involve periodic changes to the overall layout and design as work progresses through various phases of a project. In some cases, multiple traffic handling schemes are overlaid on one another, such as during temporary lane closures performed within a large construction project that has already implemented long-term lane and shoulder closures, lane shifts, etc.
Complicating matters further is the temporary nature of work zones themselves. Unlike traditional roadway design features that are implemented to last 30 to 50 years and for which significant amounts of data can be gathered over time to assess their safety implications, work zones can be in place for as little as a few minutes. Although some work zones are in place for several years, one typically has much less data to use to assess if and how safety is being impacted at that site.
Despite these challenges, work zone safety-related performance measures provide an opportunity for agencies to monitor performance in (near) real time, and to evaluate how decisions made regarding design and operations affected safety. Similar to mobility measures, work zones have several safety-related dimensions. Specifically, safety impacts are commonly described in terms of the following categories:
- Traffic crashes;
- Safety surrogates; and
- Worker accidents.
Although less numerous than for mobility measures, multiple data sources are available to assess these safety impacts. In some cases, data that already exists within an agency or is gathered as part of other agency requirements can be used; in other cases, data must be collected in and around the work zone to measure safety impacts. A discussion of these various sources is presented in the following sections.
4.1 Safety-Related Data Sources
4.1.1 Crash Data Sources
Agencies and contractors alike are concerned about the frequency and severity of traffic crashes that occur in a work zone. Crashes in work zones often become sources of litigation, which can take several years and hundreds of thousands of dollars to resolve. More importantly, crashes are the most direct indicator of work zone traffic safety.
Many agencies monitor the number of fatalities that occur in work zones each year. Due to the small (fortunately) sample size of such crashes each year, it is difficult to gain much insight into the problems and/or possible countermeasures related to these crashes. Consequently, it is preferable to expand the analyses to injury (and, possibly, even property-damage-only [PDO]) crashes occurring in work zones. Furthermore, collation of crash data with specific work zone locations and times allows exposure and indicator/stratification data to be used to focus the monitoring and assessment efforts on specific phases, work zone design features, and/or work activities if so desired.
4.1.1.1 Sources That Already Exist
|
Traffic Crash Data That May be Available from Existing Agency Sources
|
Data from existing agency sources – Each state has a statewide crash records database that is used to systematically evaluate crash patterns and prioritize safety improvements to be made as part of each state’s highway safety improvement program. These data come from the crash report form that is prepared by the investigating officer of a crash. The report and database contains a wide range of details regarding the roadway location, the vehicles, and the drivers/passengers/ pedestrians involved. Most states also have a field on the form that officers can code if the crash occurred in a work zone. Some of these states have additional fields to document the type of work zone (lane closure, lane shift, shoulder work, or moving work operation), the location of the crash in the work zone, and whether workers or law enforcement personnel were present. The accuracy of the data entered into these fields is believed to vary considerably from jurisdiction to jurisdiction, as a basic understanding of work zone traffic control concepts is required to properly code the fields.
There is typically a lag between when the crash occurs and a report is filled out, and the time that it shows up in the database. In some jurisdictions, the lag may be only a few weeks; in others, it may be several months. Especially long lag times hinder the ability of practitioners to monitor the ongoing safety record of a work zone while it is in place. In fact, the lag time may be so long that the project itself is completed before any crash data occurring during the project is made available.
| The Ohio Department of Transportation personnel gather hard copies of police crash reports at major projects every two weeks and manually code that data into a database so that current crash statistics on those projects can be monitored (1). |
To mitigate the large lag times some agencies experience in obtaining crash information through their statewide database, some practitioners choose to manually collect copies of the actual crash reports occurring at a select number of work zones directly from the law enforcement agencies with jurisdiction over each work zone of interest. Transportation agency staff typically meets with the local enforcement agency to describe the need for the data and set up a recurrent collection schedule of copies of the report form itself. The copy may be physical or electronic photocopies, depending on the available technology in the enforcement agency office. Practitioners who obtain these report copies must enter them physically into a spreadsheet or other database in order to perform the desired analyses. As part of that process, the practitioner may have to make judgments for certain database elements. Some agencies, for example, determine a manner of collision code after reviewing the crash report form and narrative itself rather than have the investigating officer make that decision. The practitioner may also need to contact more than one enforcement agency office if the work zone crosses jurisdictional boundaries or if crashes on the roadway can be investigated by several possible enforcement agencies (state highway patrol, sheriff, local police department, etc.).
A third option that may exist for those work zones located within the limits of a TOC is to use incident logs recorded by system operators. Most centers document the incidents that occur within system boundaries, and can be readily extracted from the database by identifying the location and time periods of interest. An example of a safety dashboard that FAST personnel in Las Vegas have developed that can be used to evaluate work zone crash trends on a project is shown in Figure 4-1. Many of the recorded incidents may be minor PDO crashes that will not meet the agency’s reporting threshold for its statewide crash database. Consequently, it will be necessary to compare any incident data during a work zone to similar incident data collected at the same location and for a similar period of time prior to the initiation of the work zone. It should also be noted that most incident databases will include non-crash events (stalled vehicles, debris in road, etc.) that will need to be extracted prior to analysis.
| The New Hampshire Department of Transportation examines freeway service patrol and fire dispatch calls throughout key work zones, with exceptionally high dispatch volume to a specific location serving as an indication of a potential safety problem in the work zone (1). |
Similar to the use of a TOC incident database, some agencies may be able to access and use the dispatch logs or database of emergency response or service patrol personnel to a work zone. One would expect fairly good correlation between emergency response dispatches and crash reports that eventually end up in the statewide database. However, it will be necessary to pull out the non-traffic crash events that are likely to exist in both types of logs or databases. It is likely that some privacy concerns would need to be addressed as well before such data could be pulled and used for performance measurement purposes.
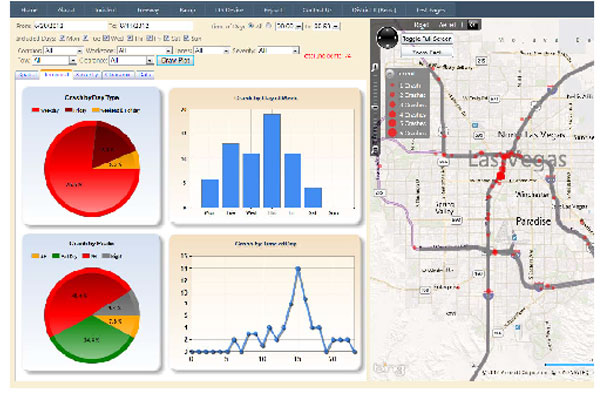
Figure 4-1. Crash Dashboard In Use by FAST Personnel in Las Vegas, NV
Brian Hoeft, Freeway and Arterial System for Transportation (FAST),
Regional Transportation Commission of Southern Nevada, Las Vegas, Nevada
4.1.1.2 Potential Sources in the Near Future
|
Traffic Crash Data Potentially Available in the Future
|
Work zone crash and accident data collected by agency staff – As noted above, data collected as part of regular traffic crash investigations law enforcement officers typically has very limited information regarding specific features of the work zone itself. Project information, type of work being performed, type of traffic control devices in use, whether or not vehicles intruded into the work space, etc., will generally not be captured in a statewide database, and may or may not be documented in the narrative or diagram of a crash report form. Consequently, a few agencies rely on their own staff to collect specific work zone data present when a traffic crash occurs. New York State DOT staff does this for each work zone crash occurrence during active work hours, and for those it is notified about when the work zone is inactive. Agency staff then enters this information into an internal database for analysis (a few other states perform a less rigorous data collection effort, often limiting it to fatalities or very severe crashes). Analysis of these data can assist the agency in identifying traffic control set up errors or other issues that should be corrected. The process captures most, but not all traffic crashes. As a result, it is not possible to perform accurate before-during comparisons of these data to the statewide crash records database. Likewise, it is not feasible to combine these data with exposure or work zone indicator/stratification data to develop rate-based measures. However, the data can be useful in assessing the relative frequency of different work zone elements and element combinations involved in work zone crashes. A significant effort is required to establish protocols and documentation procedures to make this happen. Therefore, it requires the support and emphasis of an agency’s senior management in order to be successful.
|
Establishing and using an agency-collected work zone crash database requires the support of senior management. |
Connected vehicle initiative – As with most of the mobility-related work zone performance measure data sources, the connected vehicle initiative does offer potential as a future work zone crash performance measure data source as well. Work zones equipped with electronic infrastructure that can receive vehicle data about collisions in real time could offer agencies the opportunity to continuously monitor and update crash information at a work zone. Combined with other types of location-based electronic information about the roadway and the work zone itself, an agency could establish a variety of near-real-time dashboard metrics regarding work zone crashes overall and by type of roadway, work operations, etc.
4.1.1.3 Key Considerations and Trade-offs of Work Zone Traffic Crash Data Sources
Table 4-1 provides a summary of the key considerations and trade-offs regarding the use of each of the work zone crash data sources described above. The appropriate data source will depend on the intended use. For monitoring of current work zones, the ability to obtain the data as quickly after a crash occurs as possible is critical. For comparisons across work zones or work zone operations, or for assessments of the relative effects of design or strategy decisions upon safety which require a more rigorous analysis and comparison to baseline or “expected” conditions, a complete and stable data source over multiple years is important.
| Data Source | Key Considerations and Trade-offs |
|---|---|
| Statewide Crash Records Database |
|
| Electronic or hard copies of crash report forms from investigating law enforcement officers |
|
| TOC operator incident logs |
|
| Dispatch Logs (or Electronic Database) of Emergency Response or Service Patrols |
|
| Agency-collected crash and work zone database |
|
| Connected vehicle data |
|
4.1.2 Safety Surrogate Data Sources
One of the challenges in using actual crash data for performance monitoring and measurement is that crashes are rare events, and obtaining a large enough sample to draw reasonable conclusions about the safety of a work zone can take a considerable amount of time. Therefore, it can be beneficial to look at certain operational performance data that are believed to be correlated to traffic safety at the work zone. Traffic speeds, changes in speed, and speed variance are commonly-used safety surrogate measures. Erratic maneuvers and vehicle conflicts are other examples. The sections below identify the major sources of work zone safety surrogate data.
4.1.2.1 Sources That Already Exist
|
Safety Surrogate Data That May be Collected
|
Data collected specifically for a work zone – Work zones located within the surveillance limits of a TOC may have spot speed sensor data available that could be employed for safety surrogate purposes, if the sensor is located where speed data would be beneficial. As described in the previous chapter on mobility-related data sources, it is important to verify the availability of TOC sensor data during the work zone prior to the project being initiated.
Meanwhile, a number of data sources obtained specifically from a work zone can be used for safety surrogate purposes. Data collection personnel can use hand-held radar or lidar devices to easily obtain a sample of speeds at one or more locations before and within a work zone. Standard procedures for collecting this type of data exist in many traffic engineering manuals. Any spot speed sensors that are part of a work zone ITS deployment could also be used. Travel time data, collected as described in the previous chapter, can also be used to assess the speed being driven through a work zone relative to the posted speed limit.
Moving away from speed-related data as a surrogate of safety, the positioning of cameras at key trouble spots to videotape driving behaviors can be an effective source of safety surrogate data. Rates of erratic maneuvers and vehicle conflicts occurring at the location can be extracted manually from the video, and yield insights into the magnitude of possible safety problems at a location. The data can also indicate whether the implementation of a countermeasure to reduce such behavior has been successful. This approach relies heavily upon the skill of the analyst in defining specific movements and behaviors that constitute erratic or conflicting behavior, such as the severe braking maneuvers, last-minute lane changes, near miss sideswipes, etc.
Finally, most agencies and contractors perform regular inspections of the temporary traffic control devices in place in a work zone. A few, however, formalize the inspection process by establishing specific levels of acceptability/effectiveness of devices and the overall time-to-collision (TTC) system and performing a detailed scored inspection of the work zone. These scores are then tallied to identify areas of needed improvement for the work zone. The scores can also be compared across work zones to identify patterns of deficiencies, establish baseline standards, and evaluate improvement efforts. An example of a form utilized by the Oregon Department of Transportation is illustrated in Figure 4-2.
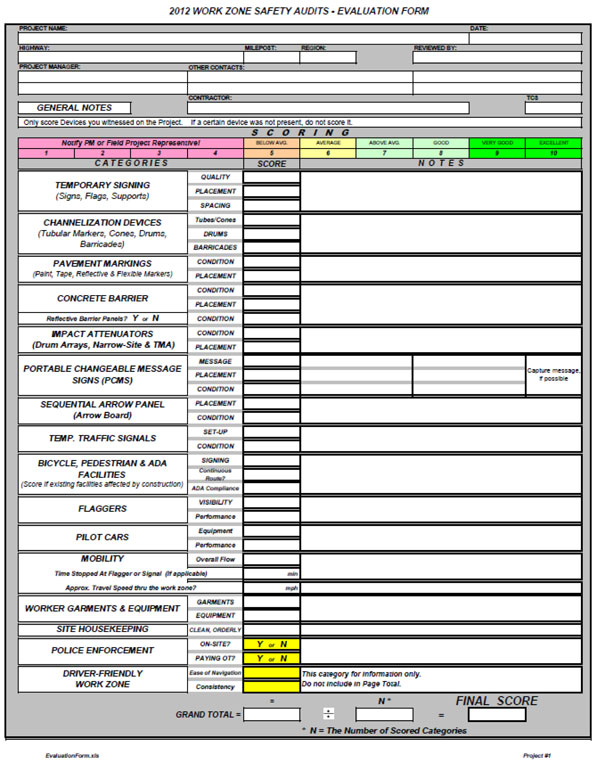
Figure 4-2. Example of the Inspection Form Used by Oregon DOT
Traffic Control Plans Unit. 2009 Construction Work Zone Tour. Oregon Department of Transportation, Salem, OR
4.1.2.2 Potential Sources in the Near Future
Microscopic traffic simulation – Traffic simulation is a powerful alternatives analysis tool used for a variety of operational assessments. Simulation has been used to compare and rank various work zone traffic control strategies such as speed and merge control, queue warning systems, ramp metering on freeways and signal timing changes on connected arterials, or any combinations of these.
Although traditionally used to assess the operational efficiency and mobility impacts of various alternatives, some users dig deeper into the simulation output to extract data that can, in theory, be used as safety surrogates. The FHWA has sponsored research into the development and testing of such a safety surrogate assessment model (SSAM) (11, 12). The tool takes the output from one of the traffic simulation models and processes the output to yield the following potential safety surrogate measures:
- Minimum TTC
- Minimum post-encroachment time
- Initial deceleration rate
- Maximum deceleration rate
- Maximum speed
- Maximum speed differential
- Classification as lane-change, rear-end, or path-crossing event type
- Vehicle velocity change had the event proceeded to a crash
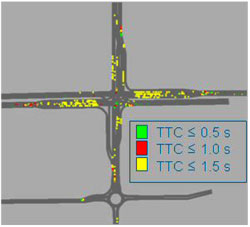
Figure 4-3. TTC is one Type of Safety Surrogate Data
that can be Extracted from Traffic Simulation Model Output
Gettman, D., L. Pu, T. Sayed, and S. Shelby. Surrogate Safety Assessment Model and Validation:
Final Report. Report No. FHWA-HRT-08-051. FHWA, U.S. Department of Transportation, Washington, DC. May 2008.
Accessible at https://www.fhwa.dot.gov/publications/research/safety/08051/08051.pdf
Some safety surrogates (e.g. speed variance) can be relatively easily obtained using virtual detectors. Others, such as decelerations and TTC estimates, require some significant post-processing of the simulation output (which is why the SSAM was developed). However, coding and calibrating a simulation model to use with SSAM does take considerable time and effort to do correctly. At the same time, it is not yet clear whether the underlying traffic behavior algorithms in the models accurately represent how the introduction of a work zone onto a roadway truly affects the safety surrogate outputs.
The connected vehicle initiative already mentioned multiple times in this document is also expected to be a useful source of safety surrogate data at work zones in the future. The same types of measures listed above that are computed through traffic simulation (encroachments, deceleration rates, speed differentials between vehicles, etc.) will likely be available from actual vehicles through this initiative. Extraction and analysis of this data should yield valuable insights into work zone features and conditions that contribute to higher crash frequencies, and conversely to those features that promote safer vehicle operations.
4.1.2.3 Key Considerations and Trade-offs of Safety Surrogate Data Sources
Table 4-2 summarizes the key considerations and trade-offs associated with the various types of safety surrogate data that could be used for work zone performance measurement. One of the key considerations of all of the possible data sources described is the fact that the assumptions that such data is indeed correlated to work zone safety and crash experiences has not yet been verified. However, since essentially all of the data sources can be obtained from a work zone fairly quickly, they can help identify potential safety concerns and problem locations much faster than can be accomplished using actual crash data alone. As such, agencies and contractors should consider the collection and use of safety surrogate data as a good compliment to work zone crash monitoring and analyses.
| Data Source | Key Considerations and Trade-offs |
|---|---|
| All data types |
|
| TOC or work zone ITS speed sensor data |
|
| Speed data collected with hand-held radar or lidar |
|
| Travel times through the work zone to assess speed limit compliance |
|
| Videotaped traffic behavior analyzed to determine erratic maneuver and vehicle conflict rates |
|
| Work zone inspection scores |
|
| Traffic simulation output (analyzed with SSAM) |
|
| Connected vehicle data |
|
4.1.3 Worker Accident Data Sources
The previous sections on crashes and safety surrogate data emphasize the traffic safety aspect of work zone performance. Although traffic safety is indeed of paramount importance to both agencies and contractors, the safety of their own employees is equally important. Accident statistics indicate that more highway workers are injured by work equipment and work vehicles within the work space than by traffic passing by or intruding into the work zone.
4.1.3.1 Sources That Already Exist
|
Worker Accident Data Collected Specifically for the Work Zone
|
Data collected specifically for a work zone – The Occupational Safety and Health Administration (OSHA) requires all employers with 11 or more employees to keep injury and illness records of its employees and to post them each year. Injuries and fatalities are then reported to OSHA, who may request the accident records as well. OSHA and the Bureau of Labor Statistics (BLS) track accident statistics across the country for the various job classifications, including the construction industry. Therefore, agency or contractor injury records themselves are the main sources of worker accident data available. OSHA provides some guidance on the key elements to include in an accident report.
| The Bureau of Labor Statistics, United States Department of Labor tracks health statistics for occupations, including highway construction (13). |
Certainly, each agency or contractor will have ready access to its own worker accident data. For a smaller contractor, the amount of worker accident data available will be fairly small; for large agencies and contractors, the amount of worker injury data collected will be greater. However, interest may exist in how those data compare to other contractors in general, to other agencies, etc. Fortunately, state workers compensation commissions can provide basic accident trends at a fairly aggregate level (such as for highway construction employers). Likewise, accident statistics available through the BLS can shed light on basic trends regarding injuries occurring in the highway and heavy construction field nationally. Although causal or contributory factors will not generally exist in these databases, relative frequencies of types of injuries, overall accident rates, etc. may be accessible for comparison purposes. OSHA also publishes some statistics on overall worker accidents (and accident rates as a function of hours worked) for comparison as well.
4.1.3.2 Possible Sources in the Near Future
The New York State DOT construction accident record keeping program requires contractors to provide accident data on worker injuries occurring during highway work activities. Information on types of injuries, and narratives as to the events leading up to the accidents, have been useful in post-accident reviews of trends by the agency. In turn, the agency has enacted increased training, awareness programs, etc. to try and reduce some of the more common accidents. Other agencies may eventually choose to adopt a similar data collection and assessment approach. Of course, the same issues that existed for the collection of traffic crash data, such as the upfront costs and efforts to establish a program and the allocation of resources to maintain it over time, will exist here as well.
4.1.3.3 Key Considerations and Trade-offs of Worker Accident Data Sources
A summary of the key considerations and trade-offs associated with the various sources of worker accident data are presented in Table 4-3.
| Data Source | Key Considerations and Trade-offs |
|---|---|
| Agency or contractor worker injury records |
|
| State worker compensation commission statistics |
|
| Bureau of Labor Statistics, OSHA worker accident statistics |
|
| Worker accident information in an agency-collected work zone crash and accident database |
|
4.2 Identifying and Computing Specific Safety Measures of Interest
4.2.1 General Considerations
Work zone safety performance measures can be useful to agencies and contractors in at least two ways:
- To determine whether a safety problem exists at a particular work zone, so that an assessment can be initiated to determine if the issue or issues can be corrected while the work zone is still in place;
- To determine how a specific work zone design feature or combination of features, operating strategy, etc. affects the safety performance of a work zone, so that future decisions about the work zone design or maintenance of traffic plan are improved.
In both cases, one of the key challenges is in developing a reasonable level of confidence in the conclusions reached about the data. Hopefully, both crash and worker accident data at any given project are relatively rare events. However, their rarity does make it difficult to determine whether the number or rate of crashes or accidents that occur over time is greater than what should be expected, or is within the range expected given the normal randomness of these events.
4.2.2 Specific Crash Measures
Table 4-4 illustrates four types of work zone traffic crash performance measures that were deemed to be of high or moderate importance by a panel of work zone practitioners. Although basic counts of crashes occurring at a project or over a region (many states track the total number of fatalities or fatal crashes that occur in their work zones each year) is commonly used as a performance measure, the real value in monitoring traffic crash counts is in assessing whether the number is greater than would be expected if the work zone were not present (and if so, by how much). Comparing the counts during the work zone period of interest to an average representing the same period prior to the work zone deployment is one way to assess if crashes have increased. Typically, a three-year average immediately prior to work zone deployment is used. However, this approach ignores the effect of any changes in traffic demand over time. In addition, this approach does not account for the stochastic nature of crashes themselves when comparing actual crash frequencies to what have been expected to occur if the work zone were not present.
A relatively simple procedure is available to assist in determining whether crashes have increased relative to what they would have been without the work zone (14). The following data are needed:
- the number of accidents observed during the work zone period of interest on the work zone segment of interest (L);
- the total number of accidents on the same segment and for the same period of interest in previous (pre-work zone) calendar years (K);
- the ratio of the work zone analysis period to the designated before period (rd);
- an estimate of the ratio of traffic in the work zone to traffic on the same segment and during the same calendar period for three years prior (
 ); and
 - the maximum percent safety reduction the district expects or is willing to accept (θ%tolerable).
| Measure | Computations Required | Value or Importance Ranking | Potential Audience(s) |
|---|---|---|---|
| Number of crashes per time period of interest, change in crash frequency from the no-work zone condition | Use of simple crash counts does not require computations. Determination of how much the counts differ from what would have been “expected” had the work zone not been present is described in the text. | High |
Traveling public Work zone operations practitioners |
| Change in crash rate per vehicle-mile-traveled per time period | Determine the number of crashes occurring during the period of interest (total project, certain phase, during peak periods, during certain work times). Compute the number of vehicles traveling through the work zone during the period and multiply by the length of the work zone to determine the VMT. Divide the number of crashes by the VMT. Compute for the same period of interest before the work zone was deployed. Determine the difference or percent change in rates. | High |
Traveling public Work zone operations practitioners |
| Distribution of crashes (or changes in the distributions) by severity, type of crash, contributing factor, etc. | Determine which crash factors are of interest. Determine levels for each factor, and number of crashes in each level. Divide each level by the total number of crashes across all levels. Compute the same for data obtained before the work zone was deployed. Compare the distributions. | Moderate |
Work zone design practitioners Work zone operations practitioners |
| Change in crash costs per time period of interest | Determine the number of crashes by severity over the work zone period of interest. Determine the expected number of crashes that would have occurred without the work zone present (described in the text). Determine the difference in crashes by severity. Multiply the difference in each severity level by the FHWA estimate of crash costs for that severity level. Sum across all severity levels. | Moderate | Work zone design practitioners |
Many agencies or contractors are interested in whether crashes have increased at all during the work zone period. However, if an agency chooses to acknowledge that crashes do tend to increase somewhat when a work zone is present, and only wishes to determine if crashes at a given work zone increase by more than what is typical, they would make use of the θ%tolerable in the computations below.
Four computational steps are required:
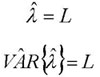
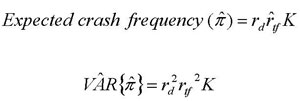
Step 1. Estimate the safety of the work zone segment during the period of interest ( ![]() ) and the variance of that estimate:
) and the variance of that estimate:
Step 2. Estimate what would have been the safety of the segment during the same time period had the work zone not been there ( ![]() ) and that variance of the estimate:
) and that variance of the estimate:
The value for ![]() is estimated using an “average” of the accident frequency on the same segment and during the same calendar period while accounting for changes in traffic volumes. A three-year average is recommended, reflecting a balance between the use of recent data and obtaining large enough sample sizes. If traffic has grown and is greater in the work zone than on the same segment for the three years prior,
is estimated using an “average” of the accident frequency on the same segment and during the same calendar period while accounting for changes in traffic volumes. A three-year average is recommended, reflecting a balance between the use of recent data and obtaining large enough sample sizes. If traffic has grown and is greater in the work zone than on the same segment for the three years prior, ![]() will be greater than 1. If traffic has decreased as a result of general trends or implementation of travel demand management strategies introduced as part of the temporary traffic management plan, then
will be greater than 1. If traffic has decreased as a result of general trends or implementation of travel demand management strategies introduced as part of the temporary traffic management plan, then ![]() will be less than 1. If no information on traffic volumes is available, a value of 1.0 should be used for
will be less than 1. If no information on traffic volumes is available, a value of 1.0 should be used for ![]() .
.
Step 3. Estimate the tolerable work zone safety given the maximum safety reduction the district expects or is willing to accept ( ![]() ) and the variance of that estimate:
) and the variance of that estimate:

Step 4. Determine if the safety of the work zone segment during the period of interest ( ![]() ) is worse than the expected or tolerable work zone safety (
) is worse than the expected or tolerable work zone safety ( ![]() ) at the desired level of confidence (ε):
) at the desired level of confidence (ε):
Safety of the work zone segment during the period of interest is worse than expected or tolerable.
There is not enough evidence to conclude that safety of the work zone segment during the period of interest
is worse than expected or tolerable (with caveat explained below).
The N(ε,0,1) value corresponds to the standard normal statistic for the confidence level of interest. If the agency or contractor wants to be 90 percent confident that the number of crashes exceeds the threshold expected value, the N(ε,0,1) value would be 1.282. If the agency or contractor were only interested in a 50/50 guess as to whether the crash number exceeds the threshold, the N(ε,0,1) value would be 0. A simple way to apply step 4 is presented in Figure 4-4. The x-axis represents the computed expected number of crashes of the segment during the time period of interest if the work zone was not there ( ![]() ). Values on the y-axis indicate the minimum number of work zone crashes observed during the period of interest that would indicate an increase in crashes had indeed occurred. Three levels of confidence are shown, 90 percent, 75 percent, and 50 percent. Note that the 50 percent “guess” is the same as the expected value without the work zone (as would be expected). Also note that crashes typically need to be 20 to 50 percent higher than expected to be 90 percent confident that crash frequency has indeed increased within the work zone.
). Values on the y-axis indicate the minimum number of work zone crashes observed during the period of interest that would indicate an increase in crashes had indeed occurred. Three levels of confidence are shown, 90 percent, 75 percent, and 50 percent. Note that the 50 percent “guess” is the same as the expected value without the work zone (as would be expected). Also note that crashes typically need to be 20 to 50 percent higher than expected to be 90 percent confident that crash frequency has indeed increased within the work zone.
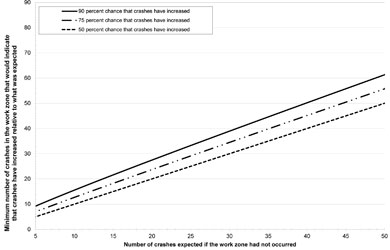
Figure 4-4. Determination of Whether Crashes have Increased Significantly in a Work Zone
Battelle
Although the use of expected crash frequencies is the preferred approach for analyses, and is the approach followed in the recently-released Highway Safety Manual (15), some practitioners are more comfortable with using crash rates as a function of VMT. Despite the statistical limitations of this approach when the number of crashes being compared is fairly low, it can also be used to compare pre-work zone crash conditions with those occurring during the work zone.
4.2.3 Specific Safety Surrogate Measures
Table 4-5 provides a summary of work zone safety surrogate performance measures, how they were ranked by the practitioners, and their intended audience(s). Measures related to speeds are appealing to practitioners and understood by the traveling public, but have not been strongly correlated to safety. Several potential surrogate measures can be obtained through traffic simulation, but currently such measures are not highly rated by practitioners. Additional research and use of such measures will likely be needed before they are more readily adopted for work zone performance measurement.
| Measure | Computations Required | Value or Importance Ranking | Potential Audience(s) |
|---|---|---|---|
| Speed limit compliance percentage | General indication of compliance can be obtained through work zone drive throughs. Formal computations can be done with a sample of at least 120 spot speed samples at a location | High |
Traveling public Work zone operations practitioners |
| Speed variance | Standard computation of the variance of a sample of speeds | High | Work zone operations practitioners |
| Change in emergency response or service patrol dispatches within a work zone | Computations should be performed similarly to those outlined for crash analyses. | Moderate | Work zone operations practitioners |
| Frequency of low time to collision rates | Frequency or rate during the work zone can be obtained through video analysis of erratic maneuver and vehicle conflict data. More often estimated as part of traffic simulation analyses. | Moderately Low | Work zone design practitioners |
| Work zone inspection scores | Inspection criteria can be scored numerically in various ways. Weightings and sums across various criteria is straightforward | Moderately Low | Work zone operations practitioners |
| Frequency of high deceleration rates | Frequency or rate during the work zone can be obtained through video analysis of erratic maneuver and vehicle conflict data. More often estimated as part of traffic simulation analyses. | Moderately Low | Work zone design practitioners |
| Frequency of forced merges per lane closure hour or number of vehicles | Frequency or rate during the work zone can be obtained through video analysis of erratic maneuver and vehicle conflict data. More often estimated as part of traffic simulation analyses. | Moderately Low | Work zone design practitioners |
| Frequency of very small headways | Frequency or rate during the work zone can be obtained through video analysis of erratic maneuver and vehicle conflict data. More often estimated as part of traffic simulation analyses. | Moderately Low | Work zone design practitioners |
4.2.4 Specific Worker Accident Measures
Finally, Table 4-6 presents some work zone performance measures pertaining to worker accidents. Simple counts can be easily tracked by an agency or contractor, and are simple to interpret. If the target or expectation is low (i.e., zero occurrences for an agency or contractor in a given time period), the use of counts is meaningful. However, as the size of the agency or contractor increases, the frequencies of accidents would not be expected to be zero, and efforts to assess whether improvements are being made would necessitate rate-based metrics, commonly in terms of worker hours of exposure. For agencies and contractors with a substantial amount of worker accident data available, it can also be meaningful to look at accident trends in terms of types of injuries, contributing factors, etc. as percentages of the total dataset, and compare to statewide or national trends.
| Measure | Computations Required | Value or Importance Ranking | Potential Audience(s) |
|---|---|---|---|
| Frequency of worker accidents | No computations needed | High |
Traveling public Work zone operations practitioners |
| Worker injury rates per person-hours of work (i.e., 200,000) | Determine frequency of worker accidents recorded in a given period divided by the total number of agency or contractor worker hours. These can be developed for a single work zone (if large enough) or across multiple work zones as desired. | High | Work zone operations practitioners |
| Distribution of types of injuries, causes or contributing factors of accidents occurring | Determine frequency of each type of worker accident, divide by the total number of worker accidents in the dataset. | High | Work zone operations practitioners |
PDF files can be viewed with the Acrobat® Reader®.
< Previous | Next >