3.0 DATA SOURCES AND COMPUTATIONAL METHODS FOR MOBILITY-RELATED PERFORMANCE MEASURES
Considerable attention has been given in recent years to the mobility impacts of work zones upon travelers, business owners, and nearby residents. Many state work zone policies in place around the country have specific limitations on the allowable amount of delay that work zones may cause. Some agencies also limit the hours during which lanes can be closed on certain roadways so as to reduce or eliminate the potential for queues and delays to be created.
Work zone performance has multiple mobility-related dimensions. Specifically, mobility impacts are commonly described and monitored in terms of the following categories:
- Throughput;
- Delays;
- Unit travel times (i.e., minutes per mile traveled, which can also be expressed as an average travel speed over the length of the roadway segment);
- Travel time reliability; and
- Traffic queues.
A number of data sources are available to assess these mobility impacts. In some cases, data that already exists within an agency or is gathered as part of other agency requirements can be used; in other cases, data must be collected in and around the work zone in order to measure mobility impacts. A discussion of these various sources is presented in the following sections.
3.1 Mobility-Related Data Sources
3.1.1 Throughput Data
Data pertaining to the number of vehicles (or, in some cases, people) that pass through a work zone, overall and as a rate per unit time, are useful to practitioners in assessing the adequacy of design decisions pertaining to the work zone MOT and the overall transportation management plan (TMP). Such data also represents vehicle/person exposure to the work zone that is then used in normalizing other types of data and performance measures. Traffic throughput is dependent upon traffic demand attempting to pass through the work zone, as depicted in Figure 3-1. If the work zone capacity is adequate to service traffic demands at all times throughout the day, then traffic demand volumes and throughput will be the same. However, if the work zone capacity is not sufficient to meet the traffic demand during certain times of the day, throughput per unit time will be equal to work zone capacity rather than traffic demand volumes. These conditions are characterized by congested traffic flows and traffic queues, and often result in significant traffic diversion away from the work zone during those congested periods. For these reasons, it is generally necessary to collect count data at work zones that experience overcapacity conditions if accurate throughput measures during the congested periods are desired.
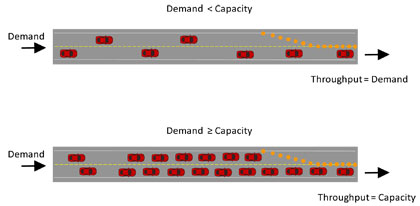
Figure 3-1. Relationship between Traffic Demand and Throughput at Work Zones
Battelle
|
Work zone throughput measures should be based on data from multiple days |
Of course, if throughput is measured continuously over the entire duration of congestion build up and dissipation each day, cumulative throughput will be equal to cumulative demand volumes. It is important to keep in mind that traffic volumes during particular portions of a day (nighttime, AM or PM peak periods, etc.) can vary significantly from day to day, due to a variety of reasons. For purposes of work zone performance measurement, it is therefore beneficial to use an average from several days of data for throughput measures (normally, at least three days of data are desirable) to establish the “typical” volumes during the time period(s) of interest.
3.1.1.1 Data Sources That Already Exist
|
Throughput Data That May be Available from Existing Agency Sources
|
Data already existing within an agency – A number of sources of work zone throughput data exist within most agencies. In many metropolitan areas, for example, tremendous amounts of detailed traffic volume data collected by TOCs can be accessed for work zone throughput. Work zones that occur within the limits of TOC coverage need only to identify which traffic sensors are of interest for which dates and times, and request the data from the TOC operations personnel. Likewise, vehicle count data can be accessed from some arterial street signal systems for work zone throughput.
Toll facility operators likewise have a ready source of throughput data available to them in the form of usage data. Because of the need or desire to continue to collect revenue, it is likely that interruption of the power supply will be less of a concern for toll facility work zone data. It should be noted, though, that project work may involve the loss of power within the work zone limits, rendering traffic sensors unusable unless steps are taken ahead of time to ensure power to them is maintained.
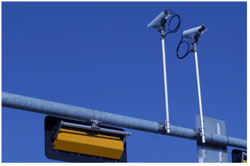
Figure 3-2. Some Traffic Signal Systems can be a Source of Traffic Volume Data
TTI
|
Verify that ATR volume data obtained for work zone performance measurement purposes are the “true” counts obtained and not an expected value generated by the system. |
For those work zones located outside of the limits of TOC coverage or on toll facilities, agencies also collect significant amounts of traffic volume data to support their own programming and planning efforts, and to comply with federal reporting requirements about vehicle travel in its jurisdiction. Most agencies have deployed permanent automatic traffic recording (ATR) stations at strategic locations on key roadways. For work zones located immediately upstream or downstream of these stations, it is usually a simple manner to request count data for the dates of interest (during the work zone, and if significant diversion is expected, before and/or after the work zone as well). As mentioned above, it will be important to determine whether the data reflects capacity-constrained throughput or traffic demand volumes. More importantly, some agencies have algorithms built into their data systems to check for “irregularities” in the ATR data. A work zone that significantly reduces traffic flows over the ATR sensor could trigger an “irregularity” alarm and be replaced in the dataset with an expected value for that time period. Consequently, it is important to check to ensure that the volumes taken from an ATR location are indeed the actual counts during the days of interest.
|
AADT estimates on a roadway can be used to approximate throughput (and vehicle exposure) if it can reasonably be assumed that traffic demands never exceeded work zone capacity, and no other reasons existed to cause significant diversion away from the project. |
In many cases, even an ATR station is not conveniently located near the work zone of interest. If data cannot be specifically collected for the work zone (as discussed below), practitioners are limited to the availability of annual average daily traffic (AADT) estimates that the planning and programming division may have available for the various roadway links within the system. While these are not actual counts, they can be useful for estimating work zone throughput when 1) it is believed that demand volumes will not exceed the capacity of the work zone, 2) it is believed that little or no diversion from the work zone will occur, and 3) estimates of throughput are desired for purposes of computing vehicular or traveler exposure levels through the work zone. If estimates other than 24-hour exposure are desired, such as traffic exposure during peak periods or during short-term lane closure activities, it will be necessary to apply an estimated time-of-day volume distribution (usually obtained from ATR station data for similar roadway types) to extract the throughput values for the time periods of interest.
|
Throughput Data Collected Specifically for a Work Zone
|
Data collected specifically for a work zone – If existing sources of work zone throughput are not sufficient for performance measurement purposes (because of large amounts of expected diversion or significant periods of congestion developing due to reduced work zone capacity, for example), practitioners will need to obtain data specifically collected for the work zone.
If a work zone ITS has been deployed to help manage traffic and provide real-time driver information, data from that system can be used for performance measurement provided that arrangements have been made ahead of time for archiving the data and making it accessible for analysis in the desired format. Practitioners can also develop a sampling plan to collect throughput data during key phases or at key times of the day. Such a plan should include repeated measurements on separate days to increase the robustness of the values obtained (a minimum of three measurements should be targeted).
Data samples can be obtained through various mechanical means (e.g., pneumatic tube counters, in-lane devices, portable video camera recordings) or can be done manually. It should be noted that mechanical counters and manual counters may not be very practical for data collection on high-volume, high-speed roadways.
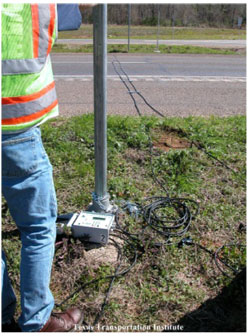
Figure 3-3. Mechanical Counters can Sample Throughput
and/or Demand Volumes at a Work Zone
TTI
|
Sources of Person Throughput Data
|
Person throughput data – Although vehicle throughput measures will normally be obtained, some work zones may be better measured on a per-person basis, if demand management strategies that encourage transit ridership, increased vehicle occupancy (i.e., high occupancy vehicle [HOV] or high occupancy toll [HOT] lanes), or green travel modes (walking, biking) are a component of a project’s TMP. Consequently, urban work zones that impact pedestrian travel may also necessitate person volume data collection and analysis.
| The New Jersey Department of Transportation identifies bicycle and pedestrian traffic as key evaluation measures (both within the project and on alternative routes) as part of its work zone traffic mitigation guidelines (2). |
Typical person count sources include:
- Manual sampling of vehicle occupancy through the work zone; and
- Counts (manual or electronic) of pedestrian throughput.
The vehicle occupancy rate determined through sampling is then multiplied by vehicle throughput to determine person throughput in the work zone.
3.1.1.2 Potential Sources in the Near Future
Connected Vehicle Initiative – The national connected vehicle initiative now under development by multiple federal and state agencies as well as private-sector vehicle manufacturers and other partners may offer potential for gathering work zone throughput data. Work is underway to establish general architectures, communication protocols, and other standards upon which a connected vehicle system will operate. To be useful, sufficient market penetration of this technology will first need to occur so that reasonable estimates of throughput can be made based on the data provided by the various connected vehicles that pass through the work zone.
Figure 3-4. The Connected Vehicle Initiative involves Communication between
Vehicles and between Vehicles and Roadside Infrastructure
TTI
3.1.1.3 Key Considerations and Trade-offs of Throughput Data Sources
Table 3-1 presents a tabular summary outlining the key considerations and trade-offs associated with the various throughput data sources currently available. As noted previously, the location of the data relative to the work zone is a key consideration regardless of the data source used. Checking any ATR data to ensure that they are the “true” volumes and not modified because of an errant assumption about a sensor problem is another key consideration.
| Data Source | Key Considerations and Trade-offs |
|---|---|
| All data types |
|
| TOC or signal system vehicle count data, toll facility usage data |
|
| ATR station data |
|
| Agency AADT estimates |
|
| Work Zone ITS data |
|
| Throughput data collection via mechanical counters or manual counts |
|
| Manual collection of vehicle occupancy levels |
|
| Manual or electronic collection of pedestrian throughput |
|
| Connected vehicle data |
|
3.1.2 Delay, Unit Travel Time, and Travel Time Reliability Data
Travel time delay, unit travel times, and travel time reliability can all describe work zone effects upon traveler mobility. Delay is perhaps the most common data category used in assessing work zone mobility impacts, and is defined as the difference between the actual travel time through the work zone and the travel time it normally takes to make the trip at that time of the day. In urban areas where trip origins and destinations are complex, some agencies find it preferable to discuss mobility effects in terms of unit travel times (i.e., minutes of travel per mile or other roadway length). Meanwhile, travel time reliability refers to the day-to-day fluctuations in trip times on a facility that a motorist must add to their expected trip time in order to ensure an on-time arrival. Shoulder closures and other temporary geometric restrictions in work zones can increase the effects of traffic incidents on travel times, thereby increasing the unreliability of travel times through the work zone. Similar to unit travel times, travel time reliability generally has more applicability to work zones on high-volume roadways in urban areas.
3.1.2.1 Data Sources Currently Available
|
Delay, Unit Travel Time, and Travel Time Reliability Data That May be Available from Existing Agency Sources
|
Data from existing agency sources – Sources that measure speeds at spot locations and interpolate between locations to approximate travel times over segments are common nationally. Most TOCs are now estimating travel times using data from their spot speed sensors and posting them on dynamic message signs (DMS). In general terms, use of spot speed sensor data to estimate travel times is less accurate than point-to-point travel time measures, especially when the roadway segment is congested. However, speed sensors will detect delays more quickly than point-to-point travel time measurement methods.
TOC staff can also estimate travel times through the use of its camera surveillance system. Knowing the locations of the cameras and the distance between them, TOC operators can identify a unique vehicle in one camera view (a large truck, an automobile with a company logo on the side, etc.), record the time, pull up the next camera view downstream, wait until that same vehicle comes into view, and record that time. Subtracting the two times will then yield the elapsed travel time between the two cameras. This approach has been successfully used by personnel in the Freeway and Arterial System for Transportation (FAST) operations center in Las Vegas, NV.
Figure 3-5. Delays can be Estimated from a Series of
Spot Speed Sensors along the Roadway Segment
TTI
Travel times and delays through a work zone are most directly determined from point-to-point travel time measurements. Historically, point-to-point travel time data was obtainable only through more costly technologies such as automatic vehicle identification (AVI), automatic vehicle location (AVL), or license plate recognition systems. Regions with significant toll road presence will generally have enough AVI transponder coverage to allow for reasonably accurate point-to-point travel time data to be obtained. In addition, it should be noted that data collected in this manner reflect recent, rather than, current conditions. For example, point-to-point travel time data that indicates delays of 30 minutes actually refers to trips that were initiated more than 30 minutes ago, not necessarily trips that are being initiated or entering a roadway segment of interest at the present time.
|
Delay, Unit Travel Time, and Travel Time Reliability Data Collected Specifically for a Work Zone
|
Data collected specifically for a work zone – Work zones located outside the boundaries of an operating TOC must rely on temporary data collection efforts. A variety of technical options are available. A work zone ITS deployment can often provide speed or travel time data, especially if the system is deployed to provide real-time traveler information. Care must be taken to ensure that such data is archived and made available for performance measurement analysis.
Conceptually, portable data collection systems could be developed for any type of point-to-point travel time data collection technology. Such a technology could be attached to any of a number of portable traffic data collection trailers in use as part of existing work zone ITS and easily integrated into the data streaming capabilities of those units. Currently, a number of work zone ITS vendors are working on the integration of Bluetooth antenna into their data collection and processing capabilities (see next section on potential sources).
| The Arizona Department of Transportation used a license plate recognition system through a work zone on State Route 68 to monitor the contractor's compliance with a travel time delay incentive/disincentive clause in the contract (4). |
A number of lower-cost manual data collection approaches can also be used to obtain travel time data in work zones. Data collectors can utilize hand-held radar or lidar devices to obtain spot speeds at one or more locations along a work zone. These data may be sufficient for estimating travel time or delay if the location of work zone congestion is fairly short. Data collection personnel can also drive through the work zone multiple times and record the elapsed time it takes to complete each pass. This approach is most appropriate when conditions on the roadway were free flow prior to the work zone being deployed so that “normal” travel times can be assumed (free flow speed divided by travel distance). If not, travel time data prior to the implementation of the work zone will be needed as well. Because they are labor intensive, both of these techniques are more appropriate when they are used to target specific periods (i.e., peak hour travel time) or certain work tasks. These techniques are also more feasible when used over shorter roadway segments. For situations where field personnel cannot obtain travel times by driving through the work zone, but can occasionally document how long a traffic queue extends upstream of the work zone, it is possible to estimate delay using basic traffic flow relationships. Again, for this approach to apply, conditions prior to the implementation of the work zone must be approximately free-flow (i.e., all delays that occur can be assigned to the presence of the work zone).
To estimate how the documented queues result in travel time delays, it is assumed that both the queue itself and the work zone result in slower speeds for some travel distance. As depicted in Figure 3-6, if a queue has formed upstream of the work zone (at the lane closure bottleneck), it is realistic to assume that the flow rate through the work zone is at or near capacity, such that the speed at capacity flow can be assumed to govern through the work zone. For simplicity, an assumption of a linear relationship between speeds and density would suggest that the capacity flow speed would be one-half of the free-flow speed on the facility. Upstream of the work zone, the queue that develops would be flowing at a speed less than the capacity flow speed. Again using a simple linear speed-density relationship, the following equation (presented in Figure 3-6) produces an estimate of the average speed in queue as a function of the normal roadway capacity and the capacity expected through the work zone.
The capacity of the work zone can be estimated using procedures in the Highway Capacity Manual (HCM) (5). The HCM also provides procedures to estimate the normal traffic-carrying capacity of the roadway segment as a function of the free-flow speed on the facility. Assuming that these speeds are maintained, on average, through the entire length of the queue and work zone documented, estimates of average delays per vehicle through the queue can be computed as a function of the length of queue. Some threshold (most likely the desired speed or the posted work zone speed limit [UWZSL]) would serve as the basis against which the longer travel times through the queue would be computed. This queue delay would then be added to the delay that would be generated as vehicles pass through the remainder of the work zone at capacity flow speeds (30-35 mph):
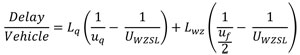
Once the average delay per vehicle is estimated for each time interval that a queue is noted on the documentation form, the total vehicle-hours of delay is computed simply by multiplying the normal hourly volume by these average delay values. If the begin and end times of the lane closure and queue do not occur exactly on the hour, extrapolation techniques should be used to estimate the delays during that portion of an hour.
Figure 3-6. Components of Work Zone Delay
Ullman, G.L. T.J. Lomax, and T. Scriba. A Primer on Work Zone Safety and Mobility Performance Measurement.
Report No. FHWA HOP-11-033. FHWA, U.S. Department of Transportation, Washington, DC. September 2011.
Accessible at http://ops.fhwa.dot.gov/wz/resources/publications/fhwahop11033/fhwahop11033.pdf.
3.1.2.2 Potential Sources in the Near Future
Figure 3-7. Bluetooth Detection Technology is a Low-cost Method of
Collecting Anonymous Point-to-Point Travel Time Data
TTI
| The Indiana Department of Transportation has used anonymous matching of Bluetooth devices in vehicles to track point-to-point travel times in work zones (6). |
Point-to-Point Travel Times by Bluetooth Address Matching – Most mobile electronics, and many vehicles themselves, are now enabled with Bluetooth technology to allow them to connect and communicate directly with other devices. Recent advances in Bluetooth signal detection technology and address matching capabilities has made it possible to track Bluetooth devices as a low cost way to obtain point-to-point travel time. Multiple address-matching protocols are now available, and ITS vendors are working on both permanent and portable deployment solutions of this technology. Advantages of Bluetooth technology are its privacy (the device wireless addresses are all that is tracked, so user information is kept private) and its relatively low cost. Like other point-to-point travel time collection technologies, however, the data represent recently completed trips rather than current trips underway. Thus, the delays being measured through the Bluetooth system will lag those actually being experienced by those currently entering the work zone.
| The Virginia Department of Transportation examined the potential of obtaining historical private-sector traffic data for the purposes of computing work zone performance metrics (7). |
Private (3rd Party) Sources of Travel Time and Speed Data – Private-sector traffic information companies collect traffic speed and travel time data from various sources, fuse that data together, and then sell that information to various users to power various real-time travel information systems. Some agencies have now started to enter into agreements to obtain that data on routes they do not have instrumented in exchange for financial compensation and/or for data the agency already is collecting. These data will also be usable for the purposes of work zone performance measurement. In fact, some agencies have found that they can obtain such data after-the-fact for very little compensation (the main value of the data to these companies is in its real-time traveler information applications). To be useful, the data mapping protocols used by the private-sector companies (these are known as traffic message channel location codes) must be translated to mapping protocols used by the agency or contractor (such as mile point or reference markers). In addition, agencies and contractors must determine whether it will be possible to obtain data from individual days (currently, at least one private-sector company provides data averaged by time-of-day and day-of-week on a month-by-month basis).
Connected Vehicle Initiative – Although connected vehicle data may eventually be useful for estimates of work zone throughput, it is likely to be more valuable sooner as a source of data for travel times and delays. As noted previously, work is underway to establish general architectures, communication protocols, and other standards upon which a connected vehicle system will operate. Presently, protocols and standards as to how vehicles will communicate with each other (i.e., vehicle-to-vehicle or V2V) is farther along than standards as to how vehicles will communicate with roadside devices (i.e., vehicle-to-infrastructure or V2I) that will be needed before agencies will be able to easily access data for work zone performance measurement purposes.
3.1.2.3 Key Considerations and Trade-offs of Delay, Unit Travel Time, and Travel Time Reliability Data Sources
Table 3-2 presents a tabular summary outlining the key considerations and trade-offs associated with the various throughput data sources currently available. Regardless of the technology or manual procedures used, it is important to have the limits of the travel time measurement extend upstream and downstream of the work zone to ensure all of the potential impacts are fully encapsulated. It is also important to keep in mind the differences between travel times measured through spot speed sensors and point-to-point travel time estimates.
| Data Source | Key Considerations and Trade-offs |
|---|---|
| TOC spot speed sensor data |
|
| TOC point-to-point travel time data |
|
| Work zone ITS data |
|
| Portable point-to-point travel time data collection |
|
| Manual spot-speed data |
|
| Manual travel time data collection by driving through the work zone |
|
| 3rd party (private-sector) travel time and speed data |
|
| Bluetooth data |
|
| Connected vehicle data |
|
3.1.3 Traffic Queue Data
The last type of work zone mobility-related performance data available to agencies and contractors are traffic queue data. Whereas some agencies have established work zone mobility policies and goals based on travel delays, others have based policies on the avoidance and limitation of queues. As would be expected, individual vehicle delays and queue lengths are highly correlated. However, traffic queues are also a safety concern, due to the high speed differentials that commonly exist between traffic approaching a queue and traffic already in queue. Consequently, emphasis on monitoring the occurrence of extent of queuing at a work zone is a higher priority for some agencies.
To fully characterize queues at a work zone, both the duration of queuing and its length over time need to be obtained. Traffic queues are the storage of vehicles when traffic demand exceeds the work zone capacity (maximum throughput). Queue lengths can change dramatically over time as demand volumes change and/or large numbers of drivers divert to alternative routes.
3.1.3.1 Sources Currently Available
|
Queue Data Collected Specifically for a Work Zone
|
Data collected specifically for a work zone – Very few agency data sources exist or are normally collected which can also be used to measure and document traffic queues. If the work zone is located within the limits of TOC sensor coverage, spot speed traffic sensors can be used to approximate queue lengths. Thus, the accuracy of the estimation process depends on the spacing of the spot speed sensors, and the existence of detectors beyond the upstream end of the queue. The process to estimate queue lengths and durations from spot sensor data consists of four basic steps, as shown in Figure 3-8 (8):
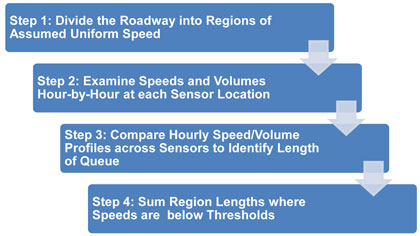
Figure 3-8. Steps to Estimate Queue Lengths from Spot Speed Sensor Data
Ullman, G.L. T.J. Lomax, and T. Scriba. A Primer on Work Zone Safety and Mobility Performance Measurement.
Report No. FHWA HOP-11-033. FHWA, U.S. Department of Transportation, Washington, DC. September 2011.
Accessible at http://ops.fhwa.dot.gov/wz/resources/publications/fhwahop11033/fhwahop11033.pdf
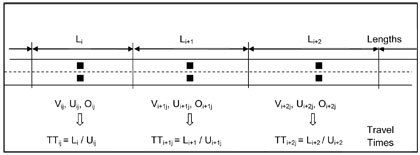
Step 1: Divide the Roadway into Regions of Assumed Uniform Speed – In step 1, the roadway section where a work zone exists is divided into a series of segments of various lengths (L), with conditions in each segment assumed to be represented by its corresponding spot sensor data of volumes (V), average speeds (U), and detector occupancies (O) as illustrated below. Within each segment length, the travel time (TT) is estimated as the segment length divided by the average speed.
Step 2: Examine Speeds and Volumes Hour-by-Hour at each Sensor Location – To approximate queue lengths from spot sensors, the speeds at each sensor are examined in sequence and over time to identify the regions and times at each region in which speeds drop below a selected threshold. Speeds at successive sensor locations are examined together, and the length Li for each segment below the speed threshold is added together for each time interval of interest. In the example on the next page, spot traffic sensors are located 0.2 mile, 0.8 mile, and 1.3 miles upstream of the temporary lane closure. Project diary information indicates that a lane closure began at 9:00 AM and ended at 3:30 PM.
Step 3: Compare Hourly Speeds across Sensors to Identify Extent of Queue Propagation – Starting with the downstream region, the average speeds over time at each region are examined in sequence moving upstream to estimate the upstream end of the queue each hour (as shown in Figure 3-9). For each hour (or other analysis period preferred by the agency), the objective is to identify how far upstream the queue has propagated. To accomplish this, the agency should select a speed threshold it will use to define the difference between normal traffic flow and traffic flow in a queue. This threshold can be defined as part of the agency’s work zone policy or procedures in absolute terms (e.g., speeds below 10 miles per hour, or speeds less than one-half of the free-flow speed of traffic on a facility), or in terms of the amount of reduction in speed observed by traffic approaching the work zone.
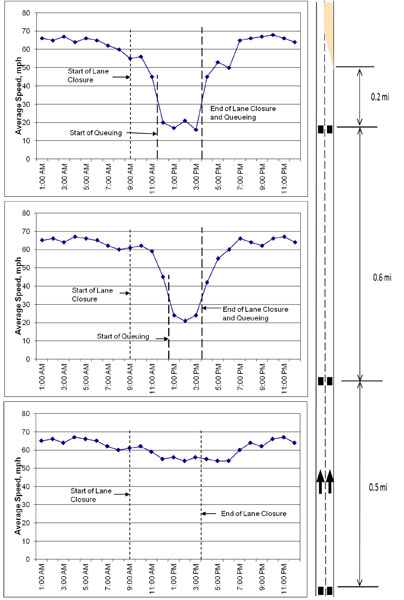
Figure 3-9. Example of Sensor Speed Analysis to Determine Duration and Length of Queue
G.L. Ullman, R.J. Porter, and G.J. Karkee. Monitoring Work Zone Safety and Mobility Impacts in Texas.
Research Report FHWA/TX-09/0-5571-1. Texas Transportation Institute, College Station, TX, September 2008.
Once a threshold is selected, it is a fairly simple task to determine the two regions in sequence that have a normal, high average speed at the upstream region and a low, congested speed indicative of the presence of queuing. The midpoint between the spot sensors of those two regions is where it is assumed that the upstream end of the queue is positioned during that hour. Performing this analysis hour-by-hour will result in a queue length profile over time at the work zone.
Step 4: Sum Region Lengths Where Speeds are Below the Threshold – To determine queue lengths for the above example, a 40 mph speed threshold was selected as indicating queued traffic conditions. Consequently, the analysis of speeds at the upstream sensor locations indicates that a queue began to develop at approximately 11:30 AM at the first sensor, which grew upstream and reduced speeds at the second sensor at about 12:30 PM. The queue did not extend back to the third sensor, since speeds never dropped below 40 mph at that location during the hours of work activity. The estimated queue length each hour is shown in Table 3-3 below:
| Time | Estimated Location of Upstream End of Queue | Estimated Queue Length |
|---|---|---|
| 11:00 am | None | 0 |
| 12:00 pm | Between Sensors #1 and #2 | 0.2 + (0.6/2) = 0.5 mile |
| 1:00 pm | Between Sensors #2 and #3 | 0.2 + 0.6 + (0.5/2) = 1.05 mile |
| 2:00 pm | Between Sensors #2 and #3 | 1.05 mile |
| 3:00 pm | Between Sensors #2 and #3 | 1.05 mile |
| 4:00 pm | None | 0 |
This approach will also work for data obtained from a work zone ITS deployment that uses spot speed sensors.
If TOC or work zone spot speed sensor data are not available for a work zone of interest, an agency or contractor must rely on manual techniques to obtain traffic queue data. Some TOCs and work zone ITS deployments, particularly those that exist primarily for incident identification and response purposes, do not offer full traffic sensor coverage of their system. Rather, as shown in Figure 3-10, operators in the control room constantly scan cameras located throughout the system looking for stalled vehicles, crashes, or other operational problems. Such systems can be used to gather queue length data for work zones located within camera coverage. Operators must be trained to visually track the start of queue formation, identify key landmarks that can be used to estimate the upstream queue location on a regular basis over the duration of the queue, and document when the queue dissipates. This may require access to and use of multiple cameras if the queue propagates several miles upstream of the work zone. As an alternative, it may be possible for programmers at the TOC to write a script to capture snapshots of the camera views of interest at specific intervals, for post-event analysis of queues.
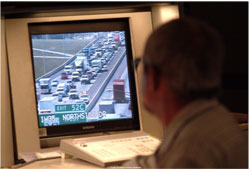
Figure 3-10. TOC Operators can Manually Record Upstream End of Queue
Periodically for Use in Computing Queue Lengths and Durations
TTI
| The Michigan Department of Transportation has established a manual data collection and recording process delays and queues at projects selected for monitoring that do not have electronic surveillance in place (1). |
Another possible manual technique is for field personnel at the project site to record the queues observed. If the queue does not grow significantly and the upstream end can be seen from the work space, a field inspector or temporary traffic control technician can document it from the roadside. If the queue grows beyond view from the work space, staff may have to travel upstream in a vehicle to locate the upstream end. Continuous passes through the queue and the work zone could also be performed, each time identifying the upstream end of the queue and the beginning of the lane closure or work space that is serving as the bottleneck and thus represents the downstream end of the queue. However it is accomplished, the goal is still to document:
- The time when queuing begins;
- The length of the queue at regular intervals; and
- The time when queuing ends.
3.1.3.2 Potential Sources in the Near Future
Computer Screenshot Captures from 3rd Party Traveler Information Providers – Many private-sector traveler information providers provide website access to current travel conditions in a map format. Typically, color coding on the various routes is used to denote travel speeds on each roadway segment for which it has data. Colors generally range from green (for normal or good travel speeds) to red or black (for stopped or nearly stopped traffic). These maps most likely have a slight time lag to them (the amount of that lag is not known for certain and is not typically advertised by the providers themselves), but can provide a reasonable snapshot of travel conditions on a facility. As shown in Figure 3-11, there are software programs which can “capture” the image on a computer screen and store it in one of several possible file formats. Currently, someone with some computer science background could write a simple script to activate this screen capture software on a regular basis (such as every 15 minutes) and save the equivalent of a time-lapse series of queuing that occurs at a work zone over time. In the near future, it is possible that a time-lapse snapshot feature could be added to these software applications to accomplish the same task. Staff could then use the screen capture images to estimate when the queuing started, how long the queue was at each point in time (scaling off the images), and when the queue dissipated. One challenge with using this approach will be in determining the appropriate map resolution level for the computer screen to capture the images. If the resolution is in too close to the work zone, the queue may grow out beyond the limits of the image. If the resolution is too far out, it will be difficult to accurately estimate the length of the queue at that snapshot in time.
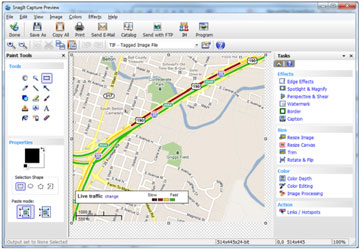
Figure 3-11. Periodic Screen Captures of Private-Sector Traveler Information Maps
can also be Used to Gather Work Zone Queuing Data
Google traffic map captured with the Snagit screen capture software tool
Private (3rd Party) Sources of Travel Time and Speed Data – Similar to the use of these data for work zone travel time and delay data, 3rd party sources of data can also be used for assessment of traffic queues at work zones. The overall approach can be identical to that outlined above for using spot sensors from a transportation management center or a work zone ITS deployment. Issues regarding the resolution between roadway segments as defined by the vendor and segments defined by the DOT will still exist, as will the need to get to individual day data for work zones where temporary lane closures cause only occasional queues.
Connected Vehicle Initiative – Detailed information about current vehicle speed is one of the key data elements planned for this initiative. Along with the current position of each vehicle, this data stream may eventually provide detailed queue location information by identifying specific vehicle locations at which speeds decrease below a defined threshold. Algorithms will be needed to collate the speed behavior of multiple vehicles to determine where the queue is said to “begin” at any point in time.
3.1.3.3 Key Considerations and Trade-offs of Traffic Queue Data Sources
Table 3-4 provides a summary of key considerations and trade-offs that exist with the existing and potential sources of traffic queue data for work zone performance measurement. Many of these considerations are similar to those documented under the travel time, delay, and travel time reliability data sources. Manual data collection techniques (by TOC operators or by field personnel) will need the buy-in and support of agency or contractor administration, as it will impact staff ability to accomplish other assigned tasks.
| Data Source | Key Considerations and Trade-offs |
|---|---|
| All data types |
|
| Transportation management center or work zone ITS deployment data using spot speed sensors |
|
| Use of TOC cameras and operators to visually identify and document queues |
|
| Collection of queue data by field personnel |
|
| Computer screenshot captures of real-time traffic condition maps |
|
| Use of 3rd party traveler information data |
|
| Connected vehicle data |
|
3.2 Identifying and Computing Specific Mobility Measures of Interest
3.2.1 General Considerations
Once a determination of what work zone mobility-related data are or will be available, the final task is to determine what specific measures of performance are of interest to the agency, contractor, traveling public, etc. As noted previously, agency or contractor goals, policies, and/or concerns related to mobility will also influence the number and type of measures that will be of interest. The corresponding performance, exposure, and indicator/stratification data are then gathered and collated as necessary to compute those measures.
To a large extent, the choice of appropriate measures depends on the MOT approach of each individual work zone, which in turn will depend on the roadway and traffic characteristics where the work is to be performed. Work zones where the MOT approach involves long-term closures of one or more travel lanes may suggest that measures pertaining to peak period traffic operations are of main importance. Conversely, work zones that use temporary lane closures during off-peak periods as the primary MOT approach would benefit more from a measure that targets mobility during the hours of those temporary lane closures than during peak hours. In many cases, the overall project will involve multiple phases in which different MOT approaches may be used in those different phases.
Regardless of the specific MOT approach used, in almost all cases, the main interest in the mobility performance measures will be in terms of how conditions during the work zone changed relative to the pre-work zone (or normal) conditions on that roadway segment. In locations where volumes are relatively low and operating conditions are good most of the time, any mobility impacts that are computed (increased travel times, presence of traffic queues, etc.) will be easily attributed to the work zone. In locations where traffic conditions are degraded already during peak periods or other times of the day, the additional delays or queues above those normally occurring will be of main interest. This can further affect the choice of performance measures that are to be computed. In some jurisdictions with TOCs, efforts are underway to develop simple-to-use computer dashboards that can provide current traffic conditions in and around a work zone (see Figure 3-12).
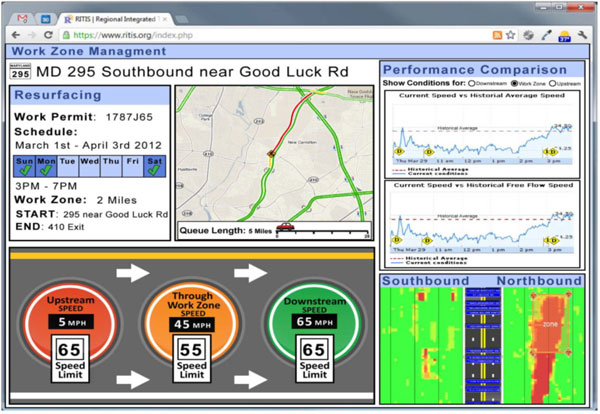
Figure 3-12. Example of a Work Zone Mobility Dashboard Under Development
Paracha, J. Work Zone Performance Measurement using Probe Data.
Presentation of Maryland Work Zone Performance Measurement Project
Each jurisdiction will have to make its own decisions as to the performance measures it chooses to track. The following sections should be used as a guide as to the types of mobility-related work zone performance measures that should be considered by an agency or contractor, and not as a comprehensive list of all acceptable measures.
3.2.2 Specific Throughput Measures
Table 3-5 presents a summary of possible throughput-related performance measures. Computational requirements of each measure, and its relative rating of importance by a panel of practitioners, are provided. Also presented in the table is an assessment of possible audiences or user groups for that measure.
Two of the measures in the table pertain to changes in throughput that occur relative to the throughput occurring before the work zone was deployed. These reductions can reflect either a reduced capacity through the work zone (relative to pre-work zone conditions), reduced demand volumes due to driver diversion to other routes or modes, or a combination of both. Some agencies and contractors emphasize the minimization of mobility impacts during hours when a work zone is inactive (hence, the specification of that particular measure).
3.2.3 Specific Unit Travel Time and Delay Measures
A number of possible performance measures pertaining to unit travel times and delays occurring in a work zone or series of work zones are provided in Table 3-6. Unit travel times, either along a corridor with multiple work zones, or through an individual work zone, can be computed fairly simply using any of the travel time data sources listed previously. These metrics are best suited for comparing to other similar facilities that do not have work zones in place, and can be a simple way of assessing the general effects of work zones on the corridor if data had not been collected prior to the deployment of the work zone(s). If data before the work zones were deployed is available, it is also possible to compute a change in a unit travel time measure.
A fairly broad list of delay-based performance measures are also defined in Table 3-6. Average delays per vehicle are fairly well understood by the driving public, as are indications of the likelihood of being delayed (expressed as a percentage of vehicles delayed). Some agencies may choose to quantify any delays that occur at a work zone; others may choose to quantify only those that exceed a threshold defined in their safety and mobility policy. Given that most work zones will not experience travel delays at all times of the day or night, emphasis may be given to evaluating peak periods only or periods when work zone capacity is reduced (such as during temporary lane closures or full roadway closures). From an overall process assessment perspective, the number (or percentage) of work zones that experience delays that exceed an agency’s delay threshold can be a useful performance measure as well.
The majority of the measures listed pertain to vehicular travel (i.e., delay per vehicle, vehicles experiencing queues greater than some threshold), which are generally easier to collect or estimate than person travel. However, if a work zone is likely to alter modal splits on a facility due to demand management strategies encouraging carpooling or transit use, per-person measures may be more appropriate to use.
| Measure | Computations Required | Value or Importance Ranking | Potential Audience(s) |
|---|---|---|---|
| Reduction in maximum throughput during specific work tasks | Maximum throughput flow rate before – Maximum throughput flow rate during work task | High |
MOT design practitioners, Work zone operations practitioners |
| Reduction in maximum throughput when work zone is inactive | Maximum throughput flow rate before – Maximum throughput flow rate during work inactivity period | High |
MOT design practitioners, Work zone operations practitioners |
| Maximum vehicle throughput per hour or other period | Maximum throughput flow rate during work zone | High |
MOT design practitioners, Work zone operations practitioners |
| Maximum person throughput (per hour or other period) | Maximum throughput flow rate during work zone period of interest ∙ Average vehicle occupancy rate in the work zone | Moderate |
MOT design practitioners, Work zone operations practitioners |
| Measure | Computations Required | Value or Importance Ranking | Potential Audience(s) |
|---|---|---|---|
| Average unit travel time for a given period or speed along a corridor with two or more work zones | Obtain an average total travel time through the corridor for the period of interest (peak period, during a particular phase or work activity, etc.) and divide by the length of the travel time route used. | High | All |
| Average unit travel time or speed through the work zone during a given period | Obtain an average total travel time through the work zone for the period of interest (peak period, during a particular phase or work activity, etc.) and divide by the length of the travel time route through the work zone. | High | All |
| Average per vehicle delays along a corridor in a given period due to work zones | Obtain an average total travel time through the corridor under non-work zone conditions for the period of interest.a Determine the average total travel time for the same roadway segment and period when work zones are present. Subtract the two to determine the per vehicle delay due to the work zones during the period of interest | High |
Traveling public, Work zone operations practitioners |
| Delay per vehicle in a given time period through a work zone | Obtain an average travel time under non-work zone conditions for the period of interest and the roadway segment where the work zone will occur.a Determine the average total travel time for the same roadway segment and period when the work zone is present. Subtract the two to determine the per vehicle delay due to the work zone during the period of interest | High | All |
| Percent of time (for the period of interest) when delay per vehicle exceeds a threshold | Determine the total amount of time that a work zone is present for the periods of interest (e.g., the total hours that the work zone has a temporary lane closure in place). Determine the number of hours in those periods that the delay exceeded the threshold. Divide the “exceeds delay threshold” hours by the total hours of interest. | High | Work zone operations practitioners |
| Total vehicle-hours of delay per time period due to work zones located along a corridor | Determine average vehicle delays due to work zones along a corridor for the periods of interest. Determine total demand volumes in the corridor during the period. Multiply volume by the per vehicle delay. | Moderate | Work zone operations practitioners |
| Time required to convey delay information to drivers or pedestrians in corridor | Determine the average time it takes from the time a determination of the amount of delay present in the work zone is made to when it is posted on a sign, website, text message, etc. | Moderate | Work zone operations practitioners |
| Percent of projects along a corridor where delays exceed a threshold for a duration greater than a threshold | Determine each work zone in the corridor where delays exceeded the defined threshold at least once. Divide by the total number of work zones that occurred along that corridor. | Moderate | Work zone operations practitioners |
| Percent of travelers along a corridor that experience delay due to one or more work zones | Determine periods when work zones are creating delays along the corridor. Determine demand volumes during those periods, and for the entire day. Divide the volumes during periods of delay by the total daily volume. | Moderate | Work zone operations practitioners |
| Percent of travelers who experience a delay through a project | Determine the periods when the work zone creates delay. Determine demand volumes during those periods, and for the entire day. Divide the volumes during periods of delay by the total daily volume at the work zone.b | Moderate | Work zone operations practitioners |
3.2.4 Specific Travel Time Reliability Measures
|
Travel time reliability can be a useful work zone mobility performance measure on roadways already experiencing recurrent and non-recurrent congestion. |
Travel time reliability on a facility may be adversely affected by the deployment of a work zone by increasing the adverse effects of weather, incidents, or even peak period recurrent congestion. When conditions prior to the initiation of the work zone are good, the computation of travel time reliability measures may be somewhat redundant with the other types of mobility measures that can be computed more simply. However, when the roadway segment is already experiencing a significant amount of travel time delays and traffic congestion prior to the start of the work zone, it may be important to track travel time reliability during the work zone to more fully capture the effects of work upon mobility. The measures shown in Table 3-7 identify three of the major indices currently used for travel time reliability measurement. Presently, all three of these measures are somewhat difficult to convey to the traveling public, and so are useful primarily to practitioners with day-to-day operational responsibility of the work zones.
3.2.5 Specific Traffic Queue Measures
Table 3-8 presents a number of possible performance measures to characterize traffic queues that may develop in work zones. The measures reflect both project-level assessments (queue durations and lengths that occur at a given work zone) as well as broader region or jurisdictional assessments (percentage of projects experiencing queues that exceed time and/or length thresholds).
Traffic queues tend to be highly variable and dynamic in work zones, as they are very sensitive to changes in both demand volumes and the capacity of the work zone. Furthermore, once a queue develops, the capacity of the work zone often dips as traffic moves from a uniform travel speed condition to one of stop-and-go behavior approaching and passing through the work zone bottleneck. Capturing the percentage of time that a queue is present thus requires almost continuous monitoring and collection or documentation when such queues develop.
| Measure | Computations Required | Value or Importance Ranking | Potential Audience(s) |
|---|---|---|---|
| Change in xx-percentile travel time through the limits of a project, or along a route where one or more work zones are located | Collect travel time data across multiple days for the time period of interest prior to work zone deployment. Order travel times from lowest to highest. Determine the xx-percentile highest travel time in the sample. Repeat once work zone is deployed. Compute the difference between the two times. | High | Work zone operations practitioners |
| Change in planning index through the limits of the work zone or along a route where one or more work zones are located | Collect travel time data across multiple days for the time period of interest prior to work zone deployment. Determine the average travel time during that period. Determine the free-flow travel time on that roadway segment and divide into the average travel time. Repeat once work zone is deployed. Compute the difference between the two indices. | Moderate | Work zone operations practitioners |
| Change in buffer index through the limits of the work zone or along a route where one or more work zones are located | Collect travel time data across multiple days for the time period of interest prior to work zone deployment. Determine the average travel time during that period, and the xx-percentile travel time (the 95th percentile travel time is often used). Divide the xx-percentile travel time by the average travel time to obtain the buffer index. Repeat once the work zone is deployed. Compute the difference between these two indices. | Moderate low | Work zone operations practitioners |
| Measure | Computations Required | Value or Importance Ranking | Potential Audience(s) |
|---|---|---|---|
| Average queue duration for a given time period, set of work activity periods, etc. | Obtain beginning and ending times of queues within the periods of interest over several days. Sum the amount of queuing time each day and divide by the number of days of data used. An agency may prefer to compute the average duration only for the periods when a queue actually occurred. In this case, the measure is the average queue duration when a queue is present in a given time period, set of work activity periods, etc. | High | All |
| Percent of time when queues occur in a given time period, set of work activity periods, etc. | Obtain beginning and ending times of queues within the periods of interest over several days. Sum the queue time for those periods across the days sampled. Divide by the sum of total time in those periods for those same days. | High |
MOT design practitioners, Work zone operations practitioners |
| Percent of time when a queue exceeds a threshold in a given time period, set of work activity periods, etc. | Computed the same way as for the previous measure, with the caveat that queue times are not counted unless they exceed the threshold value. | High |
MOT design practitioners, Work zone operations practitioners |
| Maximum queue length for a given time period, set of work activity periods, etc. | Obtain queue length data from the periods of interest over the duration of the work zone. Determine the maximum queue length recorded. | High | All |
| Maximum total length of queue along a corridor experienced by a traveler due to one or more work zones | Obtain queue length data from each work zone along a corridor for the periods of interest over a series of days. For each day of data, combine queue lengths observed at similar times to estimate the total combined length of queues at those time intervals. Determine the maximum total queue length recorded. | High |
Traveling public, Work zone operations practitioners |
| Average length of queue in a given time period, set of work activity periods, etc. | Obtain the beginning and ending times of queues, and queue length data at regular intervals over the period of interest on each of several days. For each sampling interval, compute an average queue length for that interval. Multiply those average queue lengths by duration of that interval, and divide by the total duration of queue measured in the period of interest across the days that were sampled. | High |
Traveling public, Work zone operations practitioners |
| Percent of work zones with maximum queue length exceeding a threshold for a duration greater than a threshold | Obtain queue length data from each work zone being monitored. Identify times when queue lengths exceeded a defined length threshold for a period of time longer than a defined duration threshold. Divide the number of work zones exceeding these thresholds by the total number of work zones that were monitored. | Moderate | Work zone operations practitioners |
| Percent of travelers who experience a queue in a given time period, set of work activity periods, etc. | Obtain beginning and ending times of queues in the period of interest on several days. Determine demand volumes occurring on each of those days during the period of interest, and during the times when a queue was determined to be present. Divide the total period demand volumes by the demand volumes when queues were present. If desired, the entire daily demand volume may be used instead of the demand volumes just during the period of interest. | Moderate |
MOT design practitioners, Work zone operations practitioners |
PDF files can be viewed with the Acrobat® Reader®.
< Previous | Next >