5.0 DATA SOURCES AND COMPUTATIONAL METHODS FOR CUSTOMER SATISFACTION-RELATED WORK ZONE PERFORMANCE MEASURES
Most agencies and contractors recognize that the opinions and perceptions of travelers, residents, and businesses are an important component to the successful completion of a highway project. As stewards of significant amounts of public-owned infrastructure and funding, transportation agencies in particular are very sensitive to the opinions of its citizens, and strive to ensure that its customers experience a high degree of satisfaction with the agency.
The delays, congestion, and overall inconveniences caused by work zones can be very challenging to an agency or contractor who desires to maintain good relationships with the travelers, residents, and business owners who are its customers. Therefore, monitoring and measuring customer satisfaction associated with work zones is a critical component to an agency’s or contractor’s set of useful work zone performance measures.
5.1 Customer Satisfaction Data Sources
Agencies and contractors can assess customer satisfaction associated with a particular work zone, or with all work zones in general in a region, along a corridor, or even throughout a city or state. For the most part, methods available to obtain customer satisfaction data are similar for both types of assessments. However, the questions asked and amount of data ultimately needed to establish some level of confidence in the results obtained will differ. In most cases, an agency should work through an institutional review board (IRB) when preparing to obtain customer satisfaction data, as the collection of such data is construed as human subjects research.
5.1.1 Sources that Currently Exist
|
Sources of Customer Satisfaction Data
|
Several methods can be used to obtain either type of customer satisfaction data. The first method, focus group studies, consist of a group of people (usually between 6 and 10) who are brought together and asked about their perceptions, opinions, beliefs, and attitudes towards a product, service, or concept. Focus groups can also help aid in establishing questions and anticipated answers for larger questionnaires/surveys. Group participants should be diverse in terms of socio-economic background, age, gender, and education. In some cases, it may be necessary or desirable to evaluate certain traveler groups (commuters, local residents, business owners, transit bus operators, etc.) if concerns exist about certain user group opinions.
In a focus group study, the meeting facilitator engages the participants in open dialog, but keeps them on a script of issues and general questions during the one to two hours that the meetings typically last. Examples of discussion topics might include: problems encountered or noticed in a particular work zone or in work zones in general and thoughts on how a work zone could be improved. In some instances, it will be possible to obtain an overall consensus on a certain topic; in other cases, multiple viewpoints and positions on a topic can exist. Focus groups generally do not involve enough participants to provide statistically significant findings, so their primary value is in the insights gained as participants provide their opinions, experiences, and suggestions to the various questions asked by the facilitator and subsequent discussion that may evolve within the group. Therefore, focus group results should be viewed as anecdotal findings and not as an assessment of the overall driving population within the work zone area.

Figure 5-1. Focus Group Participants provide their Opinions about Particular Topics
and can Offer Ideas on Possible Improvement Needs
TTI
The next customer satisfaction data available for use by agencies or contractors are one-on-one interviews. Such interviews can be done in person or over the telephone. Personal interviews are more appropriate when information pertaining to a particular project is of interest. For example, interviewers may approach potential participants in a public area within or just downstream of a work zone with the intent of gathering data while the driving experience through the work zone is still fresh on the participants mind. Conversely, when interest is on multiple work zones or work zones in general in a given region, such as is illustrated in Figure 5-2, a broader sample base is usually preferred and is more easily obtainable over the telephone.
When interviews focus on a single work zone, it is important to remember that the interview data is reflective of when the interview is conducted. Responses may vary at the same location over time if conditions change. Also, trained interviewers are usually needed to ask and record questions during the interview and assess findings post-discussion. For in-person interviews, the survey needs to be short (3 or 4 questions), as travelers will typically not be inclined to stay and participate for a long period of time. The administration of both in-person and telephone interviews is fairly labor intensive.
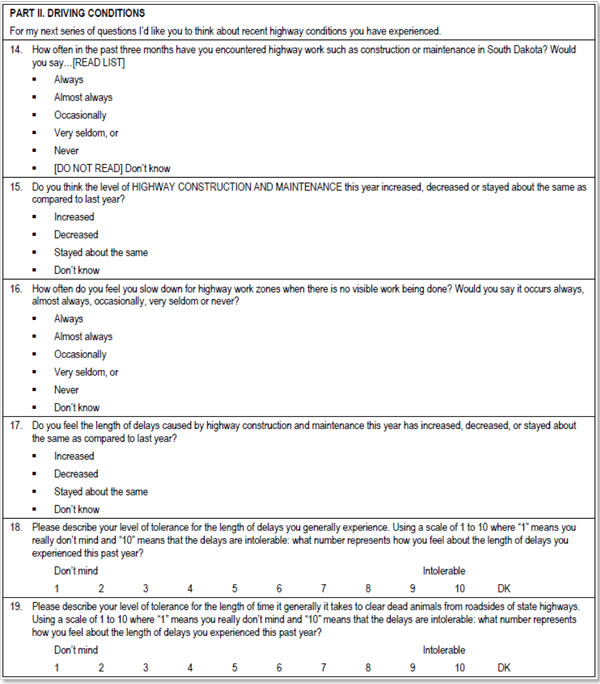
Figure 5-2. Example of a Script Used during a Telephone Interview of
South Dakota Motorists
Bender, D. and J. Schamber. SSDOT 2002 Statewide Customer Survey. Report No. SD2002-07-F. South Dakota Department of Transportation, Pierre, SD. December 2002. Accessible at http://sddot.com/business/research/projects/docs/SD2002_07_Final_Report.pdf.
Another way that customer satisfaction data can be collected is through formal customer surveys/questionnaires administered through the mail, email, or from an agency or contractor website. Questionnaires/surveys may be designed for quantitative statistical analysis or for qualitative assessment. Generally, responses are limited to predetermined options although there may be an option to provide comments. Surveys can usually be developed to gather enough data to yield statistically significant findings. However, a trained survey designer should be used whenever possible to avoid developing questions and responses that lead or bias the results obtained.
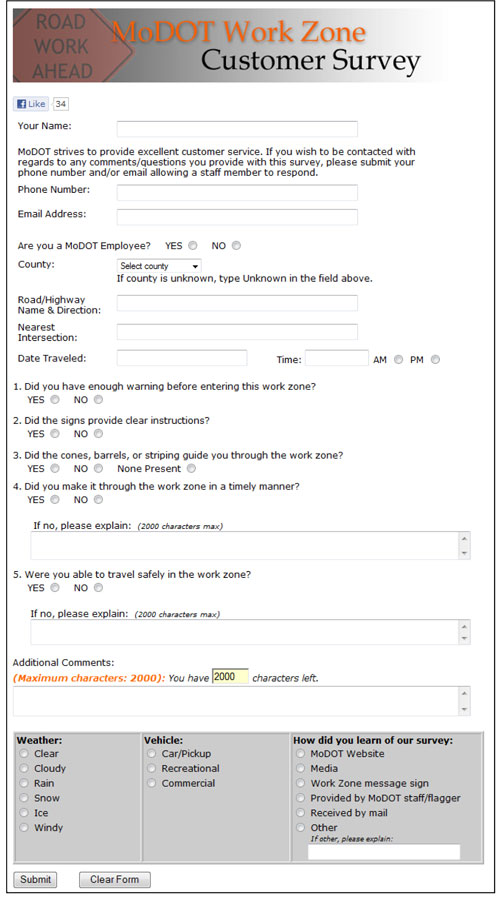
Figure 5-3. Agency Websites are a Common Venue Used for Customer Surveys/Questionnaires.
MoDOT Work Zone Customer Survey. Missouri Department of Transportation.
Accessible at http://www.modot.mo.gov/workzones/Comments.htm.
Surveys are often most useful when done periodically to compare responses over time. Survey costs can be high depending on the type of survey and the sample size. If administered via email or through an agency’s website, it is important to recognize that there is a potential for selection bias, as younger and more educated travelers tend to be more comfortable with using the internet. It is also important to realize that almost all types of questionnaires and surveys suffer from a slight negative bias. Customers who are unhappy with conditions and have a complaint are more likely to respond than those without problems or complaints.
|
Travelers, residents, or nearby businesses may embellish conditions somewhat when making a work zone-related complaint |
A fourth source of customer satisfaction data for agencies and contractors is the unsolicited customer complaints. Most agencies have a formal process in place to respond to complaints (as do some contractors). However, the availability of the data for work zone performance monitoring and measurement purposes is dependent upon agency documentation practices. Some agencies maintain formal databases to track complaint arrivals and disposition, which can facilitate search and collation of the data for work zone related complaints. Some complaints will be easily associated with a work zone or work zones in a given corridor or region (i.e., complaints regarding the condition of a work zone, closure of a ramp or intersection, etc.). Other complaints, however, may be more indirect. For example, an increase in the number of complaints regarding poor signal timing at an intersection may be due to increased traffic that diverted from a nearby route where a work zone has degraded travel conditions.
Customer complaints can be an effective data source for identifying specific operational or safety problems in work zones, and if tracked over time can aid agencies in assessing the effectiveness of their efforts to reduce such complaints. Some agencies (such as the Illinois Tollway) even solicit traveler comments and complaints in its work zones (see Figure 5-4). When taking the time to file a complaint, a driver may embellish the conditions they experienced. Complaints filed are not necessarily indicative of the overall level of driver satisfaction, as those who are not unhappy generally do not contact the agency to indicate their general satisfaction. It may be possible to establish general complaint rates and compare between projects or regions. However, statistical analyzes of such comparisons may not be possible due to small sample sizes.
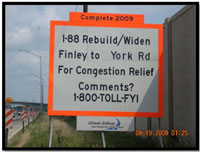
Figure 5-4. Illinois Tollway Actively Solicit Input about Work Zones on Its Facilities
Best Practices in Work Zone Assessment, Data Collection, and Performance Evaluation.
Scan Team Report, NCHRP Domestic Scan 08-04. October 2010.
Accessible at http://onlinepubs.trb.org/onlinepubs/nchrp/docs/NCHRP20-68A_08-04.pdf.
5.1.2 Potential Sources in the Near Future
Many agencies (and some contractors) have begun embracing the use of social media technologies, primarily Facebook and Twitter, to communicate with its customers. Examples already exist of efforts by various state DOTs to disseminate current travel conditions through these venues. A few agencies have begun using these sites as a way to collect customer opinion and satisfaction information. This approach does offer agencies the opportunity to easily “push” questions out to the more technology-savvy portion of its customer base. In addition, it does appear to be a popular way for that group of customers to interact with the agency to ask questions and obtain tailored responses. Concerns about selection biases and similar issues that surround the traditional customer survey techniques will continue to exist with these new approaches as well. Similar to customer complaint sources, social media responses may be skewed more negatively than a representative sample of the entire driving population would reveal. As long as they are used with consideration given to these biases, they can be an extremely useful method of obtaining information about perceived issues and problems.
Another emerging technology with potential use for obtaining customer satisfaction data is the use of web-based tools to conduct on-line focus group discussions. These tools are already being used for product testing and placement research (see, for example, http://www.e-focusgroups.com/online.html). Depending on the tool used, capabilities exist to connect participants via web cameras to allow non-verbal interaction among participants. Various parts of the survey screen are assigned to various mechanisms for interacting with the group. For example, the system may allow the facilitator to “poll” the group on various questions, allow for private chat sessions between the facilitator and each of the participants, provide a “groupthink” area where participants can type in various thoughts they have on a topic and allow others to comment (similar to a Facebook post). These tools improve the ability of the facilitator to record the various ideas and statements provided during discussions.
5.1.3 Key Considerations and Trade-Offs of Work Zone Customer Satisfaction Data Sources
A summary of the key considerations and trade-offs associated with customer satisfaction data sources for work zone performance measurement is presented in Table 5-1. As noted previously, most of these require attention to and compliance with federal regulations governing human subjects research.
| Data Source | Key Considerations and Trade-offs |
|---|---|
| Focus groups |
|
| One-on-one interviews |
|
| Surveys/Questionnaires |
|
| Complaints |
|
| Social media uses |
|
| On-line focus groups |
|
5.2 Identifying and Computing Specific Customer Satisfaction Performance Measures
Several possible measures to assess customer satisfaction in a work zone or across multiple work zones are presented in Table 5-2. Assessments of the quality and adequacy of specific aspects or features of a work zone or group of work zones was perceived by the expert panel as having a high level of importance or value to the agency or contractor, because it provided targeted guidance on issues to correct or improve. Interestingly, assessments of the quality or satisfaction associated with traveling through a work zone were viewed as only moderately important by the panel. It was noted that such ratings can be heavily influenced by media reports (positively or negatively) and will likely reflect most recent experiences that may or may not be totally attributable to the work zone itself (a major accident occurring in the work zone during the peak period, for example, could bias those customers regarding the overall quality of travel through the work zone in peak periods on most days).
| Measure | Computations Required | Value or Importance Ranking | Potential Audience(s) |
|---|---|---|---|
| Ratings of the quality of various work zone features (signs, information provided regarding delays, queues, work activities) seen while driving through a work zone | No computations needed | High |
Work zone design practitioners Work zone operations practitioners |
| Ratings of satisfaction with travel conditions through multiple work zones on a corridor or in a region or network | No computations needed | Moderately High |
Work zone design practitioners Work zone operations practitioners |
| Frequency or rate of complaints | No computations needed | Moderately High |
Work zone design practitioners Work zone operations practitioners |
| Ratings of satisfaction while traveling through work zone | No computations needed | Moderate |
Work zone design practitioners Work zone operations practitioners |
PDF files can be viewed with the Acrobat® Reader®.
< Previous | Next >