8. PILOT TEST #3: I-95, PHILADELPHIA, PA
DESCRIPTION
A third pilot test location selected for study was an approximate 8-mile segment of I-95 in southern Philadelphia, PA, extending from Broad Street on the south to East Allegheny Avenue on the north. This section of I-95 consists of three to four lanes per direction, with occasional lane additions and drops around the major interchanges with I-676 and I-76. Traffic volumes on this section of roadway in 2008 ranged from 90,000 to 150,000 vpd. The posted speed limit is between 55 and 60 mph.
Between August 18 and October 31, 2008, a highway contractor performed the following roadway repairs at various locations within this segment:
- Concrete deck repairs on selected bridges
- Asphalt milling
- Asphalt overlay paving
- Pavement patching and sealing
- Construction of an expansion dam at one of the bridges
Work activities were limited to between the hours of 9 pm and 5 am Monday through Friday. Over this time period, a total of 13 nights of work activity occurred in the northbound direction of travel, and 28 nights of activity in the southbound direction. On each night, the contractor usually closed two travel lanes at a location. There were instances, however, when three or more lanes were closed and traffic was narrowed down to a single lane of travel in that particular direction. On two nights, the contractor closed lanes in both directions of travel. The remaining nights involved lane closures in either one direction or the other.
DATA SOURCES
The Pennsylvania Department of Transportation (PennDOT) Philadelphia district office agreed to have its field personnel provide data collection support over the duration of the pilot test. The data collection form that requests work activity, lane closure information (location, duration, number of lanes closed and open), and approximate hourly queue length data were filled out by these personnel on most nights that work activity occurred. These lane closure and queue length data were then used to estimate work zone exposure measures, as well as average individual vehicle delay and total vehicle-hours of delay during congestion (using the previously described manual computation procedures and hourly traffic volumes).
In addition to the field personnel manual data collection efforts, data from a series of roadside-mounted non-intrusive traffic sensors located throughout the corridor were accessed to provide spot sensor data for analysis purposes. At some locations, sensors counted traffic in both travel directions; at other locations, only one direction of travel was being collected. In addition, there were some issues with some of the sensors on certain nights of work activity. As a result, data were not always available at all sensor locations on all nights of interest in the evaluation period.
Table 26 and Table 27 provide a summary of the location of sensors in this roadway segment in each travel direction. The effective spacing between successive sensors during this pilot test ranged from about 0.3 miles to 2.8 miles. Unfortunately, several nights of work activity occurred where sensor spacing was fairly large, which limited the sensitivity of the sensor data to detect and assess work zone impacts upon travel mobility. Although each sensor, when operational, could provide lane-by-lane volumes and speeds, these lane data were summed and averaged to yield overall sensor station measures for use in this pilot test analysis.
Floating vehicle travel time studies were conducted on three nights in early September 2008 to provide a ground-truth comparison of the field personnel and traffic sensor data sources. In addition, truck transponder data was obtained for those nights when work activity was occurring. Researchers were able to obtain truck data over 20 miles (10 miles per direction) on four consecutive nights in August 2008 when work activity and temporary lane closures were in place. Table 28 summarizes the amount of truck speed data that were obtained. Overall, the sample is very low, averaging 0.2 speed measurements per mile per hour. No observations were recorded in most mile segments during most hours of the work periods (82 percent of the mile-segment-hours had no observations). The maximum amount of data that was obtained for any mile segment during any hour of analysis was 5 observations.
| Sensor Location | Milepoint | Distance from Upstream Sensor |
|---|---|---|
| Island Ave | 12.7 | --- |
| Enterprise Ave | 14.5 | 1.8 |
| Broad St | 16.6 | 2.1 |
| between S. Darren and S. 11th | 17.9 | 1.3 |
| Walt Whitman Bridge | 18.5 | 0.6 |
| S of I-676/I-95 | 20.8 | 2.3 |
| between Frankford and Girard | 22.8 | 2.0 |
| S of Betsy Ross Bridge | 25.4 | 2.6 |
| Lefevre St | 26.3 | 0.9 |
| Sensor Location | Milepoint | Distance from Upstream Sensor |
|---|---|---|
| Lefevre St | 26.3 | --- |
| S of Betsy Ross Bridge | 25.4 | 0.9 |
| between Frankford and Girard | 22.8 | 2.6 |
| N of I-676/I-95 | 21.3 | 1.5 |
| Walt Whitman Bridge | 18.5 | 2.8 |
| Pattison Ave | 17.9 | 0.6 |
| between S. Darren and S. 11th | 17.6 | 0.3 |
| Broad St | 16.7 | 0.9 |
| Enterprise Ave. | 14.5 | 2.3 |
| Island Ave | 13.3 | 1.2 |
| Date | Hours of Closure Examined | Length of Section Examineda | Truck Transponder Observations | Observations per Mile per Hour | |
|---|---|---|---|---|---|
| Average | Maximum | ||||
| Aug. 18, 2008 | 9 hr | 20 mi | 28 | 0.2 | 2 |
| Aug. 19, 2008 | 9 hr | 20 mi | 47 | 0.3 | 5 |
| Aug. 20, 2008 | 9 hr | 20 mi | 41 | 0.2 | 2 |
| Aug. 21, 2008 | 9 hr | 20 mi | 46 | 0.3 | 3 |
| 4-Day Average | 9 hr | 20 mi | 40.5 | 0.2 | 5 |
RESULTS
Exposure Measures
As shown in Figure 12, the field crew documentation tables indicated that work actually occurred on slightly more than 40 percent of the nights during the evaluation period. Considering only Sunday through Thursday nights when the contractor was actually allowed to be on I-95 and close lanes, work activity occurred on slightly more than 55 percent of the allowable nights. Inclement weather did likely cause the contractor not to work on some of the nights; these were not identified as part of pilot test (but would need to be if an agency were relying on such a measure to gauge the actual level of contractor effort on a project). In addition, the Philadelphia Phillies major league baseball team participated in post-season play in the fall of 2008. It is possible that the contractor was restricted from working on nights when the team was in town at the nearby ballpark.
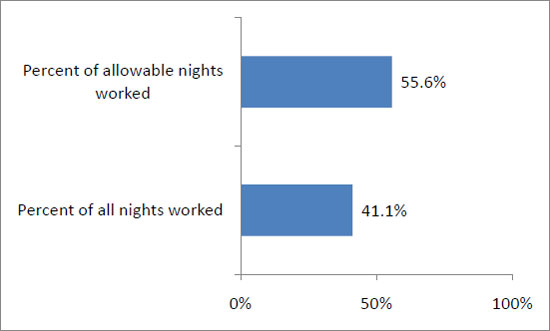
Figure 12. Work Exposure Measures, I-95 Philadelphia.
Table 29 summarizes the hours of work activity reported on the field crew data collection forms. Over a total of 30 nights of activity in the pilot test evaluation period, the contractor performed 252 hours of work, averaging approximately 8.4 hours per work shift.
| Work Exposure Measure | Value |
|---|---|
| Total hours of work activity during project | 252 |
| Average # hours of work per day | 8.4 |
The next facet of exposure data gathered and computed for the Pennsylvania project were the roadway capacity losses. These are provided in Table 30. Overall, the majority of lane closure time involved the closure of two out of four available lanes. The maximum number of lanes present within the limits of the work zone each night was used as the baseline, rather than attempting to characterize each auxiliary lane or lane drop segment separately. Over the 30 nights of work in the evaluation period, a total of 1,980 lane-mile-hours of roadway capacity loss were required for the project. This equates to an average of 2.9 miles of lane closure each night of work activity.
| Capacity Loss Exposure Measure | Value |
|---|---|
| Percent of work hours involving: | |
| 1 of 4 lanes closed in a given direction | 2.6% |
| 2 of 4 lanes closed in a given direction | 93.8% |
| 3 of 4 lanes closed in a given direction | 3.6% |
| Percent of inactive hours involving lane closures | 0% |
| Lane-Mile-Hours of closures in evaluation period | 1,980 |
| Average lane closure length per work activity period | 2.9 miles |
The vehicular exposure to the work zone lane closures during the evaluation period are provided in Table 31. Slightly less than 500,000 vehicles passed through the nighttime temporary lane closures during the evaluation period. Overall, this corresponds to about 6 percent of the total amount of traffic that utilized this section of I-95 during the evaluation period. Meanwhile, nearly 1.5 million vehicle miles of travel occurred through the temporary lane closures over the duration of the evaluation period of this project.
| Capacity Loss Exposure Measure | Value |
|---|---|
| Number of vehicles passing through active lane closures in evaluation period | 493,000 |
| Percent of total traffic in evaluation period encountering work activity and lane closures | 6.2% |
| Total vehicle-miles-traveled past active work zone lane closures in evaluation period | 1,430,000 veh-mi |
Queuing Measures
Figure 13 and Table 32 both summarize queue measure characteristics at this site as documented by field personnel on the data collection form, and through analysis of available traffic sensor data from the regional TMC. Because work activity typically occurred simultaneously in both directions of travel each night, separate analyses were performed for each direction. The restriction of temporary lane closures to nighttime hours no doubt did reduce the frequency and severity of queues and congestion that might have otherwise developed. As noted in Table 32, field crews still reported the creation of queues on 77 percent of the nights when a lane closure was implemented in the northbound direction, and on 100 percent of the nights with a lane closure in the southbound direction. For this pilot test location, the traffic sensor data at this site tracked fairly closely to the field crew data for these particular performance measures.
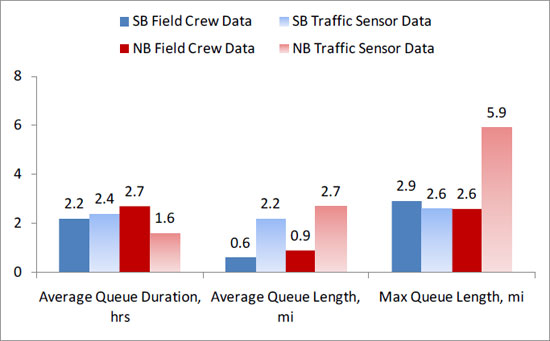
Figure 13. Comparison of Queue Length Measures, I-95 Philadelphia.
As Table 32 also illustrates, analyses of the traffic sensor data from this site found evidence of queuing on 78 percent of the nights of work activity and lane closures in the northbound direction, and 73 percent of the nights in the southbound direction. Even though the distance between sensors was quite large in some locations in the study section, the sensors happened to be in good locations on most nights to detect the development and duration of queues. The traffic sensor data did not align quite as well with the field crew data when it came to queue lengths (as shown in Figure 13), or the amount of time that the queues exceeded the 1-mile and 2-mile thresholds.
| Queue Measure | Southbound | Northbound | ||
|---|---|---|---|---|
| Based on Field Crew Data | Based on Traffic Sensor Data | Based on Field Crew Data | Based on Traffic Sensor Data | |
| Days of work activity when queuing occurred | 100.0% | 72.7% | 76.9% | 77.8% |
| Amount of work activity time when queue > 1 mi | 5.5% | 14.5% | 14.7% | 20.0% |
| Amount of work activity time when queue > 2 mi | 0.2% | 14.8% | 3.2% | 20.0% |
| Amount of traffic volume through active work zone that encounters a queue | 53.8% | 35.2% | 52.6% | 51.6% |
Floating-vehicle travel time studies were performed during September 8-12, 2008 in order to provide a means of comparing the two data collection approaches to a “ground-truth” measure of queues and delays. No slowdowns or queues were detected on one night of data collection and the contractor was rained out on two other nights, so only two nights of work activity could be compared. For some reason, the lane closures that week were actually not documented in the field data collection forms, even though there were nights in which the lane closures apparently resulted in small queues at the sites. Therefore, Table 33 summarizes the comparison between traffic sensor and ground-truth queue measures from the travel time studies. The traffic sensor data was relatively accurate in identifying the duration of queuing that occurred on both nights, but tended to estimated longer maximum queues.
| September 8, 2008 Southbound | September 10, 2008 Southbound | |||
|---|---|---|---|---|
| Based on Traffic Sensor Data | Measured via TT Studies | Based on Traffic Sensor Data | Measured via TT Studies | |
| Queue Duration (Hrs) | 2.3 | 2.0 | 1.5 | 1.5 |
| Maximum Queue Length (Mi) | 2.1 | 0.4 | 2.1 | 0.9 |
TT= travel time
Once again, the small sample size of truck transponder data did not allow for a comprehensive comparison to field personnel or traffic sensor data. A lack of speeds in successive mile segments during the same or successive hours of work activity limited the analysis to simply identifying individual speeds that were below what was considered to be uncongested. Those speeds were then assumed to be indicative of the presence of a traffic queue in the mile segment in which they occurred during that one-hour period. Unfortunately, even that simplistic assumption did not appear to correlate well with the other data sources. For example, Table 34 identifies those mile point segments and hours each night where truck transponder speeds were below 35 mph, and compares those hours and mile points to queues reported by the field personnel on the data collection forms. On two nights, lower truck speeds did correspond to periods of work activity when field personnel reported queuing occurring in the vicinity of the lane closure. On the remaining nights, field personnel did not report any queues, even though a few very slow truck speeds were recorded. Therefore, it is difficult to know with any certainty whether the truck speeds were indicative of work zone impacts, or the result of other behaviors by the truck drivers such as pulling off the roadway to refuel or to get some sleep.
| Date and Direction | Time | Location | Speed, mph (# in sample) |
Queue Documented by Field Crew? |
|---|---|---|---|---|
| August 19 (Southbound) | 3 am | MP 13 | 22 (1) | No |
| August 20 (Southbound) | 11 pm | MP 4 | 3 (1) | Yes |
| August 21 (Northbound) | 9 pm | MP 9 | 12.7 (3) | Yes |
| August 21 (Southbound) | 9 pm | MP 7 | 5 (1) | Noa |
| August 22 (Northbound) | 12 am | MP 8 | 2 (1) | Nob |
| 1 am | MP 10 | 4 (1) | ||
| 2 am | MP 9 | 8 (1) | ||
| August 22 (Southbound) | 1 am | MP 7,8 | 3.5 (2) | Nob |
| 2 am | MP 7,8 | 21.5 (2) |
a Queue was reported, but not beginning until 10:30 pm
b Queue reportedly dissipated by midnight
Delay Measures
Table 35 presents a comparison of the delays computed using the field personnel estimates of queuing and the computational procedures for estimating delays based on queue lengths, to delay estimates computed from the available traffic sensor data. On one hand, the total vehicle-hours of delay computed using the project field crew measurements bracket the estimates derived from the traffic sensor data. On the other hand, this result is due mainly to the extremely large range of values documented in Table 35 for the delay computations based on the field crew estimates. As has been the case in each of the pilot tests discussed, a lack of information existed on whether the queue documented in the data collection form was located within the limits of the work zone (and thus operating at speeds closer to the speed of capacity flow on the facility) or was located at the lane closure taper and thus operating at a much lower stop-and-go speed over the length of the queue. The wide range in assumed operating speeds within the queue in turn led to highly different estimates of the individual motorist delay that is experienced, and thus much different computational results with respect to the total delays generated by the work activity during the evaluation period. Depending on which assumption is more correct, motorists who encounter a queue at the work zone may be delayed less than a minute, or as much as 30 minutes.
| Delay Measure | Southbound | Northbound | ||
|---|---|---|---|---|
| Based on Field Crew Dataa | Based on Traffic Sensor Data | Based on Field Crew Dataa | Based on Traffic Sensor Data | |
| Total delay during work activities | 2,020-23,313 veh-hr | 5,152 veh-hr | 509-5,586 veh-hr | 1,594 veh-hr |
| Delay per night of work | 72-831 veh-hr | 184 veh-hr | 94-367 veh-hr | 123 veh-hr |
| Delay per night of work when queues developed | 72-831 veh-hrs | 253 veh-hr | 101-394 veh-hr | 158 veh-hr |
| Average delay per entering vehicle during work\activities | 0.3-3.8 min/veh | 0.8 min/veh | 0.2-2.6 min/veh | 0.7 min/veh |
| Average delay per queued vehicle during work activities | 0.6-7.1 min/veh | 2.3 min/veh | 0.4-4.9 min/veh | 1.4 min/veh |
| Maximum delay per queued vehicle during work activities | 2.9-29.8 min/veh | 8.5 min/veh | 2.7-26.3 min/veh | 6.8 min/veh |
a The lower end of the range shown was computed assuming the queue was located within the work zone and moving at capacity flow speeds; the upper end was computed assuming the queue was located upstream from the lane closure taper and moving at the computed reduced speed in queue from equation 1.
If these values are compared to those obtained from the traffic sensor data, one would conclude that the queues tended to be located within the work zone and operating at speeds approaching capacity flow speeds, and not the extremely low stop-and-go speeds that characterize queues located at the beginning of lane closure tapers. However, examination of speeds determined through the ground truth travel time studies suggests that the traffic sensors yielded speeds that were higher than those actually occurring in the queues at this site, and so tended to underestimate the delays being created for motorists encountering a queue (Table 36). As noted previously, the limited amount of truck transponder data did not allow for an assessment of delay that could be compared to these other sources of data.
| September 8, 2008 Southbound | September 10, 2008 Southbound | |||
|---|---|---|---|---|
| Based on Traffic Sensor Data | Measured via TT Studies | Based on Traffic Sensor Data | Measured via TT Studies | |
| Average Speed in Queue (Mph) | 20 | 7 | 27 | 12 |
| Average Delay per Vehicle (Min) | 4.1 | 5.2 | 2.3 | 4.1 |
KEY FINDINGS FROM I-95 PHILADELPHIAPILOT TEST
Overall, the experiences from this pilot test mimic those of the other two pilot tests already described. Field personnel did appear to do a reasonably accurate job of documenting work activity and queue data, when such data were recorded. Unfortunately, it is less clear from this pilot test the degree to which queues were indeed recorded over the evaluation period. The fact that multiple nights of lane closure activity and queuing occurred when data collection personnel were at the site to collect ground truth queue and travel time data but were not recorded on the field crew data collection forms does raise questions about how many other nights were missed.
previous | next